StochastiX

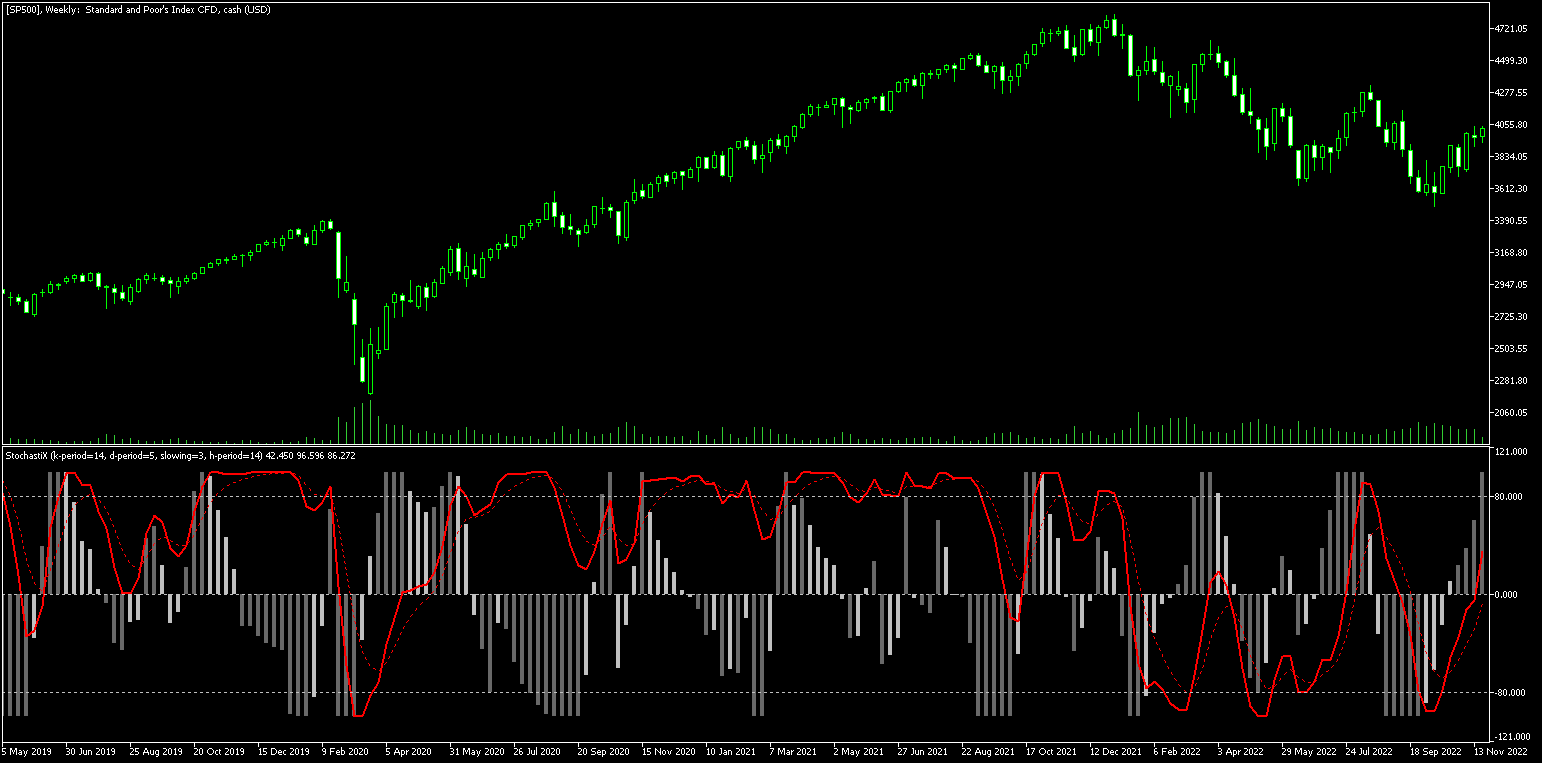
StochastiX is an extension of a well-known indicator.
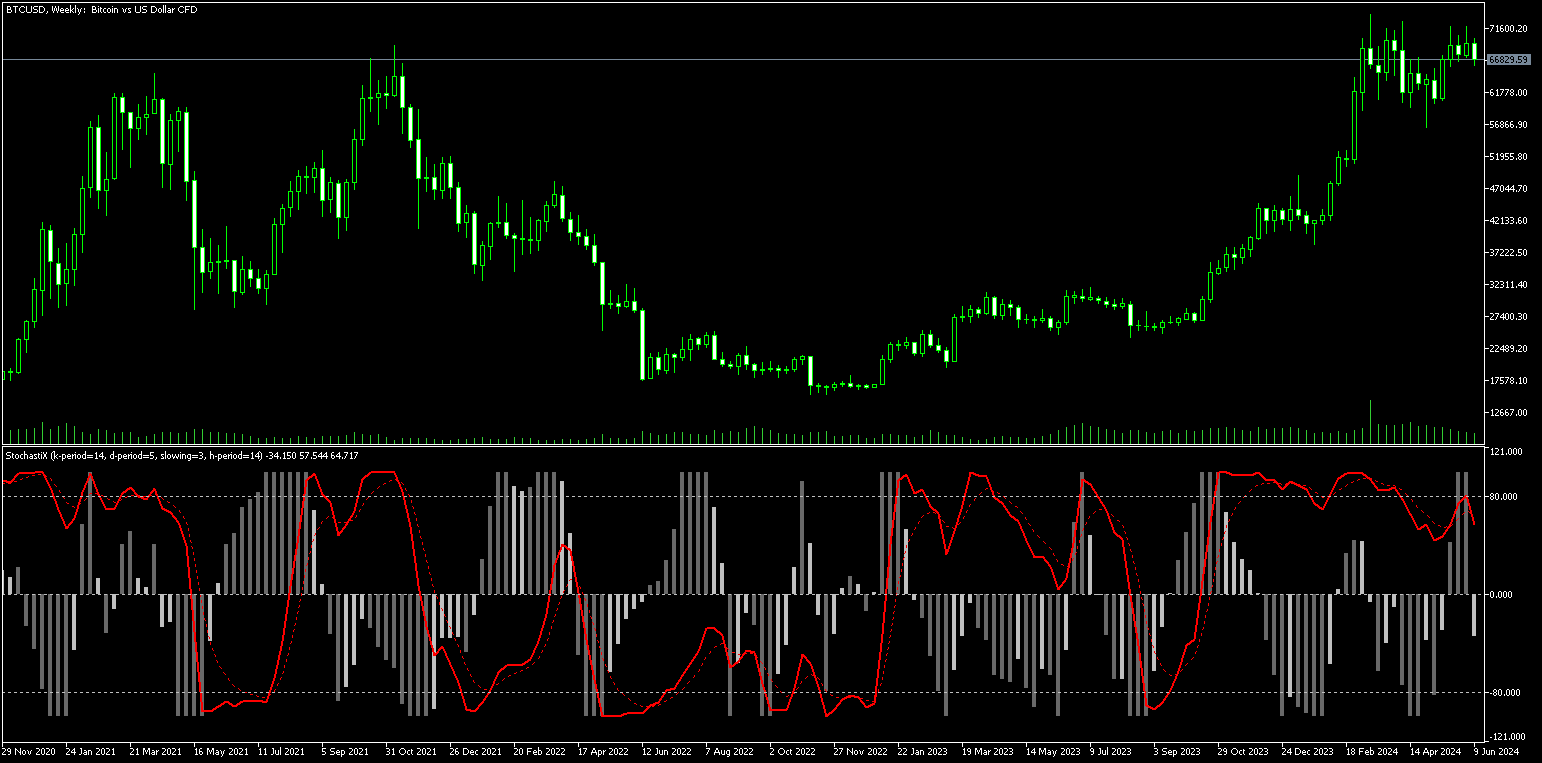
1) StochastiX is displayed in the range of -100 to 100.
2) A histogram is calculated from the difference of the main and signal curves - again as a stochastic, but without smoothing.

The histogram gives the user a hint about the dynamics of oscillator changes. Patterns need to be studied from real graphs.

I wish you successful trading.
Önerilen ürünler
Introducing RSIScalperPro - the revolutionary RSI-based indicator for Metatrader 5, specifically designed for scalping in the one-minute chart. With RSIScalperPro, you'll have a powerful toolkit for precise entry and exit signals to take your trading to the next level. RSIScalperPro utilizes two different RSI indicators that provide clear signals for overbought and oversold areas. You can customize the time periods and limit values of the two RSIs according to your preferences to achieve the be
Note: If you want to apply this indicators on indicators which are shown in a sub-window, then consider using this indicator instead:  https://www.mql5.com/en/market/product/109066.&nbsp ; AIntel Predict - Your Gateway to Future Trading Success! Unlock the power of predictive analytics with AIntel Predict. Say goodbye to the guesswork and hello to improved forecasting, as AIntel Predict leverages historical data to unveil the future of your trades like never before. Whether you're a seasoned tra
The Effort and Result indicator is based on the work of Karthik Marar; a volume spread analysis trader. It compares a price change (Result) to the volume size (Effort) for a certain period.  By comparing the effort and result, we can get more information about the future price movement. Both values are normalized and converted to a scale of 0 - 100 % based on a selectable look-back period. This indicator is also known as the Effort Index. The law of effort and result The law of effort vs. res
Short Description Fox Wave Account Nexus is a professional dashboard for real-time monitoring of multiple MetaTrader 5 accounts across different terminals from a single chart. Full Description  Fox Wave Account Nexus Professional Multi-Account Monitoring Dashboard for MetaTrader 5 Fox Wave Account Nexus is a powerful visual dashboard designed for traders who operate multiple MT5 accounts simultaneously and need instant, centralized control . The indicator collects live data from all con
Donchian Breakout And Rsi
Mattia Impicciatore
4.5 (2)
Genel Açıklama Bu gösterge, klasik Donchian Kanalı ’nın geliştirilmiş bir versiyonudur ve gerçek işlem için pratik işlevlerle zenginleştirilmiştir. Standart üç çizgiye (üst, alt ve orta çizgi) ek olarak sistem breakout (fiyat kırılımı) noktalarını tespit eder ve bunları grafikte oklarla görsel olarak gösterir. Ayrıca grafiği sadeleştirmek için mevcut trend yönünün tersindeki çizgi yalnızca görüntülenir. Gösterge şunları içerir: Görsel sinyaller : Kırılım sırasında renkli oklar Otomatik bildiriml
FREE
An indicator of patterns #45 and #46 (Three Falling Peaks and Three Rising Valleys) from Encyclopedia of Chart Patterns by Thomas N. Bulkowski. Parameters: Alerts - show alert when an arrow appears   Push - send a push notification when an arrow appears (requires configuration in the terminal) PeriodBars - indicator period K - an additional parameter that influences the accuracy of pattern shape recognition. The smaller the value is, the smoother the row of peaks/valleys should be, so fewer patt
Mirror Chart MT5
Andrej Hermann
5 (1)
The Mirror Chart MT5 is a overlay indicator specifically designed to project a second financial instrument directly onto the main chart window. This tool is invaluable for traders who rely on correlation analysis, as it visualizes the price movements of two different instruments in real time. Unlike traditional overlays, this indicator utilizes intelligent, dynamic centering and scaling logic. It continuously analyzes the visible price range in the current window for both symbols and calculates
FREE
Gösterge, tarihsel olanlarla karşılaştırılabilecek güncel teklifler oluşturur ve bu temelde bir fiyat hareketi tahmini yapar. Gösterge, istenen tarihe hızlı navigasyon için bir metin alanına sahiptir. Seçenekler: Sembol - göstergenin göstereceği sembolün seçimi; SymbolPeriod - göstergenin veri alacağı dönemin seçimi; GöstergeRenk - gösterge rengi; Ters - doğru tırnakları tersine çevirir, yanlış - orijinal görünüm; Sonraki, tarihi girebileceğiniz ve 'enter' tuşuna basarak hemen atlayab
Sc MTF Volume MT5
Krisztian Kenedi
5 (1)
Çoklu zaman dilimi desteği, özelleştirilebilir görsel sinyaller ve yapılandırılabilir uyarı sistemi ile Hacim (Volume) göstergesi. Serbest programlama hizmetleri, güncellemeler ve diğer TrueTL ürünleri MQL5 profilimde mevcuttur. Geri bildirim ve değerlendirmeler çok takdir edilmektedir! Hacim (Volume) nedir? Hacim, teknik analizin en temel göstergelerinden biridir. Belirli bir bar veya zaman dilimi boyunca işlem gören kontrakt, hisse veya lot sayısını temsil eder. MetaTrader'da varsayılan ola
FREE
ALIEN Dashboard
Youssef Esseghaiar
ALIEN DASHBOARD FULL EDITION – Professional ICT & Precision Trading Dashboard for MT5 ( HYBRID ENGINE ) Overview The   Alien Dashboard Full Edition   is a comprehensive, all‑in‑one technical indicator for MetaTrader 5 that merges the most powerful concepts from Inner Circle Trader (ICT) methodology with advanced precision‑entry logic, multi‑timeframe analysis, and an intuitive on‑chart dashboard. Designed for serious traders who want to visualise institutional order flow, identify high‑probabili
Description: TrendAccess can optimize your trading time by showing you the trend via two different calculation modes quick and easy. No more searching for Trends. Just open the chart and look at the trend display. Features: Shows Uptrend, Downtrend and "No Trend" indicator Shows the calculated ZigZag Profile Works on all timeframes Two different calculation Modes (MACD and Candle-based calculation) Settings: Variable  Standard Value Description  Calculation Mode  Candle based  Choose betwe
BBands PMO
Norio Takahashi
The indicator allows you to simplify the interpretation of signals produced by the classical MACD indicator.  It is based on the double-smoothed rate of change (ROC).  Bollinger Bands is made from EMA line.  The indicator is a logical continuation of the series of indicators using this classical and efficient technical indicator. The strength of the trend is determined by Bands and main line. If the bands width are smaller than the specified value, judge it as suqueeze and do not recommend tra
Çoklu zaman dilimi desteği, özelleştirilebilir görsel sinyaller ve yapılandırılabilir uyarı sistemi ile Bollinger Bands göstergesi. Freelance programlama hizmetleri, güncellemeler ve diğer TrueTL ürünleri MQL5 profilimde mevcuttur. Geri bildirim ve değerlendirmeler çok memnuniyetle karşılanır! Bollinger Bands Nedir? Bollinger Bantları, üç çizgiden oluşan bir teknik analiz aracıdır: orta bant (hareketli ortalama), üst bant ve alt bant. Üst ve alt bantlar, orta banttan standart sapmalar olarak
FREE
Was: $249  Now: $99   Market Profile defines a number of day types that can help the trader to determine market behaviour. A key feature is the Value Area, representing the range of price action where 70% of trading took place. Understanding the Value Area can give traders valuable insight into market direction and establish the higher odds trade. It is an excellent addition to any system you may be using. Inspired by Jim Dalton’s book “Mind Over Markets”, this indicator is designed to suit the
This indicator measures the largest distance between a price (high or low) and a moving average. It also shows the average distance above and below the moving average. It may come in handy for strategies that open reverse positions as price moves away from a moving average within a certain range, awaiting it to return so the position can be closed. It just works on any symbol and timeframe. Parameters: Moving average period : Period for moving average calculation. Moving average method : You can
In combination with the BT you can test python strategies. The BT has a history of M1 bars from 2016 onwards (over 5 years, source DukasCopy). At this moment the history for the basic 28 instruments will be available. All time frames are deducted from these M1 bars (M5, M10, M15, M20, M30, H1, H2, H3, H4, H6, H8, H12, D1). Stepping through the history in M1 bar increment or multiple M1 bar increments. Orders and positions will be updated every increment. All history bars of the instruments are
SMC Vision
Kriangkrai Pongtiwat
SMC ProVision 2.0 — Professional Smart Money Concept Analysis Stop guessing. Start reading the market like institutions do. SMC ProVision maps the full smart money footprint directly on your chart — with a clean, minimal design that won't clutter your screen. Market Structure — BOS / CHoCH with HH・HL・LH・LL labels Order Blocks — Standard & Refined with mitigation tracking Breaker Blocks — Auto-converted from mitigated OBs Fair Value Gaps — Fill percentage & mitigation status Liquidity —
FREE
Advisor for hedging trading or pair trading. A convenient panel allows you to open positions on the necessary trading instruments and lots. Automatically determines the type of trading account - netting or hedging. Advisor can close all its positions upon reaching profit or loss (determined in the settings). A negative value is required to control losses (for example, -100, -500, etc.). If the corresponding fields are 0, the EA will not use this function.   Settings: Close profit (if 0 here
Hyper Vision
Gayathiri Gopalakrishnan
HyperVision v1.00 — Smart Money Concepts | All-In-One Institutional Trading System for MT5 The most complete SMC indicator ever built for MetaTrader 5. One tool. Every edge. HyperVision is a professional-grade, all-in-one Smart Money Concepts indicator engineered for traders who want to stop guessing and start trading with institutional precision. Built from the ground up for MetaTrader 5, it combines market structure analysis, order flow detection, machine learning forecasting, and advanced ris
Çoklu zaman dilimi desteği, özelleştirilebilir görsel sinyaller ve yapılandırılabilir uyarı sistemi ile Accelerator Oscillator (AC) göstergesi. Serbest programlama hizmetleri, güncellemeler ve diğer TrueTL ürünleri MQL5 profilimde mevcuttur. Geri bildirim ve değerlendirmeler çok takdir edilmektedir! AC nedir? Accelerator Oscillator (AC), Bill Williams tarafından geliştirilen ve mevcut itici gücün ivmelenmesini veya yavaşlamasını ölçen bir momentum göstergesidir. Gösterge, Awesome Oscillator (
FREE
SnR Smart Eco2
Syamsurizal Dimjati
SUPPORT & RESISTANCE (S&R) Smart Ecosystem Support & Resistance Detection automatically identifies price zones where buying or selling pressure has repeatedly appeared in the past. Zones are built using price reaction strength, fractal behavior, ATR-based zone width, and historical validation. This module provides: Dynamic support and resistance zones Zone classification (weak, untested, verified, proven, turncoat) Optional zone merging and extension Visual clarity with theme-based or custom col
Price Magnet — Price Density and Attraction Levels Indicator Price Magnet is a professional analytical tool designed to identify key support and resistance levels based on statistical Price Density. The indicator analyzes a specified historical period and detects price levels where the market spent the most time. These zones act as “magnets,” attracting price action or forming a structural base for potential reversals. Unlike traditional Volume Profile tools, Price Magnet focuses on price-time d
Premium seviye, %80'den fazla doğru tahmin doğruluğuna sahip benzersiz bir göstergedir! Bu gösterge en iyi Ticaret Uzmanları tarafından iki aydan uzun süredir test edilmiştir! Yazarın göstergesini başka hiçbir yerde bulamazsınız! Ekran görüntülerinden bu aracın doğruluğunu kendiniz görebilirsiniz! 1, sona erme süresi 1 mum olan ikili opsiyon ticareti için harikadır. 2 tüm döviz çiftleri, hisse senetleri, emtialar, kripto para birimleri üzerinde çalışır Talimatlar: Kırmızı ok göründüğü an
Çoklu zaman dilimi desteği, özelleştirilebilir görsel sinyaller ve yapılandırılabilir uyarı sistemi ile Rate of Change (ROC) göstergesi. Freelance programlama hizmetleri, güncellemeler ve diğer TrueTL ürünleri MQL5 profilimde mevcuttur. Geri bildirim ve değerlendirmeleriniz çok değerlidir! ROC Nedir? Rate of Change (ROC), belirli bir dönem boyunca fiyattaki yüzde değişimini ölçen bir momentum osilatörüdür. Mevcut fiyatı n dönem önceki fiyatla karşılaştırır ve farkı yüzde olarak ifade eder; bu
FREE
Percent
Raphael Moretti
The indicator will plot a line on the chart that corresponds to the closing price of the previous day, and based on this, it will plot the percentage levels of change in the price of the asset in question. It can be used on any asset. Period: Determine whether the closing price should be daily, weekly or monthly Minimum percentage: Determine the percentage for the indicator to plot the levels and sub-levels on the chart, eg 0.5 it will plot on the chart a line for every 0.5% variation and the su
Çoklu zaman dilimi desteği, özelleştirilebilir görsel sinyaller ve yapılandırılabilir uyarı sistemi ile Williams %R göstergesi. Freelance programlama hizmetleri, güncellemeler ve diğer TrueTL ürünleri MQL5 profilimde mevcuttur. Geri bildirim ve değerlendirmeleriniz çok değerlidir! Williams %R Nedir? Williams %R, Larry Williams tarafından geliştirilen bir momentum osilatörüdür. -100 ile 0 arasında hareket eder. 0'a yakın değerler aşırı alım koşullarını, -100'e yakın değerler aşırı satım koşull
FREE
Big Figure Indicator MT5
Vonjinirina Alfred Randrianiaina
3.5 (4)
"BIG FIGURE INDICATOR", otomatik olarak fiyat grafiklerindeki belirli seviyelerde yatay çizgiler tanımlar ve çizer; örneğin, bütün sayılar veya yarım sayılar gibi (örneğin, para birimi işlemlerinde 1.0000 veya 1.5000). Bu seviyeler, büyük tüccarların ve yatırımcıların odaklanabileceği yuvarlak sayıları temsil ettikleri için psikolojik olarak önemli kabul edilir ve potansiyel destek veya direnç seviyelerine yol açabilir. Büyük rakam göstergesi, tüccarların önemli fiyat seviyelerini belirlemeleri
FREE
L'indicatore SMC Venom Model BPR è uno strumento professionale per i trader che operano nell'ambito del concetto di Smart Money (SMC). Identifica automaticamente due modelli chiave sul grafico dei prezzi: FVG   (Fair Value Gap) è una combinazione di tre candele, in cui c'è un gap tra la prima e la terza candela. Forma una zona tra livelli in cui non c'è supporto di volume, il che spesso porta a una correzione dei prezzi. BPR   (Balanced Price Range) è una combinazione di due modelli FVG che for
FVG - Fair Value Gap The FVG - Fair Value Gap is an advanced MQL5 indicator designed for traders who utilize institutional order flow and Smart Money Concepts to identify market inefficiencies. This indicator automatically detects and highlights Fair Value Gaps (FVGs) on your chart, providing a clear visual representation of potential support and resistance zones, reversal points, and high-probability trading setups. Key Features: Automated FVG Detection:   The indicator automatically identifie
VMS Oscillator
Vincent Jose Proenca
Volume & Move Strength (VMS) Indicator for MT5 The VMS Indicator displays the relationship between trading volume and price movement strength, helping traders assess how well market activity supports price action. How It Works: Measures tick volume as trading activity. Calculates move strength using a normalized True Range (%). Both values can be smoothed (default: 5) and optionally normalized (0–100) for consistency across markets. Plots two lines in a separate window: Blue (Volume) – trading a
FREE
Bu ürünün alıcıları ayrıca şunları da satın alıyor
ARIPoint
Temirlan Kdyrkhan
ARIPoint is a powerful trading companion designed to generate high-probability entry signals with dynamic TP/SL/DP levels based on volatility. Built-in performance tracking shows win/loss stats, PP1/PP2 hits, and success rates all updated live. Key Features: Buy/Sell signals with adaptive volatility bands Real-time TP/SL/DP levels based on ATR Built-in MA Filter with optional ATR/StdDev volatility Performance stats panel (Success, Profit/Loss, PP1/PP2) Alerts via popup, sound, push, or email Cu
SuperScalp Pro
Van Minh Nguyen
4.63 (24)
SuperScalp Pro – Gelişmiş Çoklu Filtre Scalping Gösterge Sistemi SuperScalp Pro, işlem fırsatlarını belirlemeye yardımcı olmak için klasik Supertrend ile birden fazla akıllı onay filtresini birleştiren gelişmiş bir scalping göstergesidir. M1’den H4’e kadar farklı zaman dilimlerinde verimli şekilde çalışır ve XAUUSD, BTCUSD ile majör Forex pariteleri için optimize edilmiştir. Gösterge, net Al ve Sat sinyalleri sunar ve ATR tabanlı otomatik giriş fiyatı, stop loss ve take profit seviyeleri hesapla
Entry In The Zone and SMC Multi Timeframe is a real-time 2-in-1 market analysis tool that combines market structure analysis and a No Repaint BUY / SELL signal system into a single indicator, built on Smart Money Concepts (SMC) — a widely adopted framework used by professional traders to understand market structure. This indicator helps you see the market more clearly, make decisions based on structure rather than guesswork, and focus on high-probability zones where price is more likely to react
Divergence Bomber
Ihor Otkydach
4.9 (88)
Bu göstergeyi satın alan herkese aşağıdaki ekstra içerikler ücretsiz olarak sunulmaktadır: Her işlemi otomatik olarak yöneten, Stop Loss ve Take Profit seviyelerini ayarlayan ve işlemleri strateji kurallarına göre kapatan özel yardımcı araç: "Bomber Utility" Göstergenin farklı varlıklar üzerinde kullanılmasına yönelik ayar dosyaları (set dosyaları) Bomber Utility için 3 farklı modda kullanım sunan ayar dosyaları: "Minimum Risk", "Dengeli Risk" ve "Bekle-Gör Stratejisi" Bu ticaret stratejisini hı
Power Candles V3 - Kendi Kendini Optimize Eden Güç Göstergesi Power Candles V3, döviz ve enstrüman gücünü, eklendiği her grafikte eyleme geçirilebilir bir ticaret planına dönüştürür. Sadece mumları renklendirmek yerine, arka planda canlı bir otomatik optimizasyon çalıştırır ve önünüzdeki sembol için en iyi Stop Loss, Take Profit ve sinyal eşiğini size sunar. Tek bir tıklama ile canlı ticarete uyarlanır - giriş, Stop Loss ve Take Profit ışınları grafikte tam fiyatlarla görünür ve uyarılar yön bil
SignalTech MT5 is a fully rule based trading system for EURUSD, USDCHF, USDJPY, AUDUSD, NZDUSD, EURJPY, AUDJPY, NZDJPY, CADJPY.  All the winning trades with chart setups are published on the comments page. 2025-12 1174 Pips 2026-01 2624 Pips 2026-02 2937 Pips 2026-03 2165 Pips 2026-04 2243 Pips It can generate signals with Buy/Sell Arrows and Pop-Up/Sound Alerts. Each signal has clear Entry and Stop Loss levels, which should be automatically flagged on the chart, as well as potential Targets 1,
Tanıtım       Quantum Breakout PRO   , Breakout Bölgeleri ile ticaret yapma şeklinizi değiştiren çığır açan MQL5 Göstergesi! 13 yılı aşkın ticaret tecrübesine sahip deneyimli tüccarlardan oluşan bir ekip tarafından geliştirilmiştir.       Kuantum Breakout PRO       yenilikçi ve dinamik koparma bölgesi stratejisiyle ticaret yolculuğunuzu yeni zirvelere taşımak için tasarlanmıştır. Kuantum Breakout Göstergesi, size 5 kar hedefi bölgesi ile kırılma bölgelerinde sinyal okları ve kırılma kutusuna da
Azimuth Pro
Ottaviano De Cicco
5 (7)
Azimuth Pro V2: Synthetic Fractal Structure and Confirmed Entries for MT5 Overview Azimuth Pro is a multi-level swing structure indicator by Merkava Labs . Four nested swing layers, swing-anchored VWAP, ABC pattern detection, three-timeframe structural filtering, and closed-bar confirmed entries — one chart, one workflow from micro-swings to macro-cycles. This is not a blind signal product. It is a structure-first workflow for traders who care about location, context, and timing. V2 Launch Offe
Gann Made Easy , bay teorisini kullanarak ticaretin en iyi ilkelerine dayanan, profesyonel ve kullanımı kolay bir Forex ticaret sistemidir. WD Gann. Gösterge, Zararı Durdur ve Kâr Al Seviyeleri dahil olmak üzere doğru SATIN AL ve SAT sinyalleri sağlar. PUSH bildirimlerini kullanarak hareket halindeyken bile işlem yapabilirsiniz. Satın alma işleminden sonra, alım satım talimatlarını ve harika ek göstergeleri ücretsiz olarak almak için lütfen benimle iletişime geçin! Muhtemelen Gann ticaret yöntem
RelicusRoad Pro MT5
Relicus LLC
4.96 (24)
RelicusRoad Pro: Kantitatif Piyasa İşletim Sistemi ÖMÜR BOYU ERİŞİMDE %70 İNDİRİM (SINIRLI SÜRE) - 2.000+ TRADER'A KATILIN Neden çoğu trader "mükemmel" indikatörlere rağmen başarısız olur? Çünkü tekil kavramları boşlukta trade ederler. Bağlamı olmayan bir sinyal kumardır. Sürekli kazanmak için KONFLÜANS (UYUM) gerekir. RelicusRoad Pro basit bir ok indikatörü değildir. Tam bir Kantitatif Piyasa Ekosistemi dir. Tescilli volatilite modellemesini kullanarak fiyatın ilerlediği "Adil Değer Yolu"nu har
MetaTrader 5 için Akıllı Çok Katmanlı Kırılım ve Geri Çekilme Dedektörü "Akıllı, Basit, Hızlı!" Yüksek olasılıklı kırılım girişlerini kaçırmaktan bıktınız mı? Kırılımları trend yönü ve para birimi momentumuyla hizalamaya çalışarak birden fazla grafiği saatlerce tarayıp — yine de hareketi kaçırıyor musunuz? Break Pullback, tüm bunları tek bir göstergede çözüyor. Break Pullback Nedir? Break Pullback, piyasa yapısı, kırılım ve trend devamı kurulumlarında işlem yapan yatırımcılar için özel olarak
Bu indikatörü satın alırsanız, Profesyonel Trade Manager’ımı  + EA ÜCRETSİZ olarak alacaksınız. Öncelikle, bu Ticaret Sistemi'nin Non-Repainting, Non-Redrawing ve Non-Lagging Göstergesi olduğunu vurgulamak önemlidir, bu da hem manuel hem de robot ticareti için ideal hale getirir. Online kurs, kılavuz ve ön ayarları indir. "Smart Trend Trading System MT5", yeni ve deneyimli tüccarlar için özelleştirilmiş kapsamlı bir ticaret çözümüdür. 10'dan fazla premium göstergeyi birleştiriyor ve 7'den fazla
Atomic Analyst MT5
Issam Kassas
3.94 (31)
Öncelikle belirtmek gerekir ki bu Ticaret Göstergesi Yeniden Çizim Yapmaz, Gecikmez ve Gecikme Göstermez, bu da hem manuel hem de robot ticareti için ideal hale getirir. Kullanıcı kılavuzu: ayarlar, girişler ve strateji. Atom Analisti, Piyasada Daha İyi Bir Avantaj Bulmak İçin Fiyatın Gücünü ve Momentumunu Kullanan PA Fiyat Hareketi Göstergesidir. Gürültüleri ve Yanlış Sinyalleri Kaldırmaya ve Ticaret Potansiyelini Artırmaya Yardımcı Olan Gelişmiş Filtrelerle Donatılmıştır. Birden fazla katmanl
Quantum TrendPulse
Bogdan Ion Puscasu
5 (25)
SuperTrend   ,   RSI   ve   Stochastic'in   gücünü tek bir kapsamlı göstergede birleştirerek işlem potansiyelinizi en üst düzeye çıkaran nihai işlem aracı olan   Quantum TrendPulse'u   tanıtıyoruz. Hassasiyet ve verimlilik arayan yatırımcılar için tasarlanan bu gösterge, piyasa trendlerini, momentum değişimlerini ve en uygun giriş ve çıkış noktalarını güvenle belirlemenize yardımcı olur. Temel Özellikler: SuperTrend Entegrasyonu:   Güncel piyasa trendlerini kolayca takip edin ve karlılık dalgası
FX Trend MT5 NG
Daniel Stein
5 (4)
FX Trend NG: Yeni Nesil Çoklu Piyasa Trend Zekâsı Genel Bakış FX Trend NG , çoklu zaman dilimlerinde çalışan profesyonel bir trend analiz ve piyasa izleme aracıdır. Piyasanın yapısını saniyeler içinde anlamanızı sağlar. Birden fazla grafik arasında geçiş yapmak yerine, hangi enstrümanların trendde olduğunu, momentumun nerede zayıfladığını ve hangi zaman dilimlerinin uyumlu olduğunu anında görebilirsiniz. Lansman Teklifi – FX Trend NG sadece $30 (6 Ay) veya $80 Ömür Boyu Lisans ile edinin. Zate
Btmm state engine pro
Garry James Goodchild
5 (4)
BTMM State Engine Pro is a MetaTrader 5 indicator for traders who use the Beat The Market Maker approach: Asian session context, kill zone timing, level progression, peak formation detection, and a multi-pair scanner from a single chart. It combines cycle state logic with a built-in scanner dashboard so you do not need the same tool on many charts at once. What it does Draws the Asian session range; session times can follow broker server offset or be set in inputs. Tracks level progression (L
Market Structure Order Block Dashboard MT5, piyasa yapısını ve ana fiyat reaksiyon bölgelerini doğrudan grafikte okumak isteyen traderlar için tasarlanmış bir MT5 göstergesidir. BOS, ChoCH, Order Blocks, Fair Value Gaps (FVG), Likidite, Kill Zones, Volume Profile ve hızlı analiz için kompakt bir paneli bir araya getirir. Bu gösterge, piyasa yapısını, ICT ve Smart Money kavramlarını karar çerçevesi olarak kullanan traderlara yöneliktir. Trend devamlarını, olası tersine dönüşleri, fiyat dengesizli
Öncelikle, bu Ticaret Aracının Non-Repainting, Non-Redrawing ve Non-Lagging Gösterge olduğunu vurgulamakta fayda var, bu da onu profesyonel ticaret için ideal hale getiriyor. Çevrimiçi kurs, kullanıcı kılavuzu ve demo. Akıllı Fiyat Hareketi Kavramları Göstergesi, hem yeni hem de deneyimli tüccarlar için çok güçlü bir araçtır. İleri ticaret fikirlerini, Inner Circle Trader Analizi ve Smart Money Concepts Ticaret Stratejileri gibi 20'den fazla kullanışlı göstergeyi bir araya getirerek bir araya
OrderFlux | MetaTrader 5 için Footprint Orderflow (Sipariş Akışı) Sürüm 2.0 – Aktif Yatırımcılar için Gerçek Zamanlı Bid/Ask (Alış/Satış) Görselleştirmesi OrderFlux, MT5 için bir footprint ve orderflow (sipariş akışı) göstergesidir. Sadece fiyatın nereye gittiğini değil, hareketin içinde neler olduğunu gösterir: Fiyat seviyesi başına Bid/Ask hacmi, delta, imbalance (dengesizlik) ve hacim dağılımı. Pek çok grafik size yalnızca bir mumun nihai sonucunu gösterir. OrderFlux size oraya giden yolu gös
Grabber System MT5
Ihor Otkydach
4.83 (23)
Size mükemmel bir teknik gösterge olan Grabber’ı tanıtıyorum. Bu araç, kullanıma hazır bir “her şey dahil” işlem stratejisi olarak çalışır. Tek bir yazılım kodu içinde güçlü piyasa teknik analiz araçları, işlem sinyalleri (oklar), uyarı işlevleri ve push bildirimleri entegre edilmiştir. Bu göstergeyi satın alan herkes aşağıdaki hediyeleri ücretsiz olarak alır: Açık emirleri otomatik yönetmek için Grabber Yardımcı Aracı Kurulum, yapılandırma ve nasıl işlem yapılacağını adım adım anlatan video kıl
Crystal Heikin Ashi Signals
Muhammad Jawad Shabir
5 (2)
Crystal Heikin Ashi Signals - Professional Trend & Signal Detection Indicator Advanced Heikin Ashi Visualization with Intelligent Signal System for Manual & Automated Trading Final Price: $149 ---------> Price goes up $10 after every 10 sales . Limited slots available — act fast . Overview Crystal Heikin Ashi Signals is a professional-grade MetaTrader 5 indicator that combines pure Heikin Ashi candle visualization with an advanced momentum-shift detection system. Designed for both manual traders
Önce dürüst olalım. Hiçbir gösterge tek başına sizi kârlı yapmaz. Eğer biri size aksini söylüyorsa, size bir hayal satıyordur. Mükemmel al/sat okları gösteren her gösterge, kusursuzmuş gibi görünecek şekilde yapılabilir — sadece geçmişin doğru bir bölümünü yakınlaştırıp kazanan işlemleri ekran görüntüsü almanız yeterlidir. Biz bunu yapmıyoruz.  SMC Intraday Formula bir araçtır. Piyasa yapısını sizin için okur, en yüksek olasılıklı fiyat bölgelerini belirler ve şu anda akıllı paranın izinin nası
" Dynamic Scalper System MT5 " göstergesi, trend dalgaları içinde işlem yapmak için scalping yöntemi için tasarlanmıştır. Başlıca döviz çiftleri ve altın üzerinde test edilmiştir, diğer işlem araçlarıyla uyumluluğu mümkündür. Ek fiyat hareketi desteğiyle trend boyunca pozisyonların kısa vadeli açılması için sinyaller sağlar. Göstergenin prensibi. Büyük oklar trend yönünü belirler. Küçük oklar şeklinde scalping için sinyaller üreten bir algoritma trend dalgaları içinde çalışır. Kırmızı oklar yü
Bu gösterge paneli, seçilen semboller için mevcut en son   harmonik kalıpları   gösterir, böylece zamandan tasarruf edersiniz ve daha verimli olursunuz /   MT4 sürümü . Ücretsiz Gösterge:   Basic Harmonic Pattern Gösterge sütunları Symbol :   seçilen semboller görünecektir Trend:   yükseliş veya düşüş Pattern :   desen türü (gartley, kelebek, yarasa, yengeç, köpekbalığı, cypher veya ABCD) Entry :   giriş fiyatı SL:   zararı durdur fiyatı TP1:   1. kar alma fiyatı TP2:   2. kar alma fiyatı TP
Meridian Pro
Ottaviano De Cicco
5 (2)
Meridian Pro 2.00: Professional Multi-Timeframe Trend Matrix for MT5 Meridian Pro 2.00 is a professional adaptive trend matrix for MetaTrader 5. It combines the original Meridian trend engine, a clean chart ribbon, closed-bar signal arrows, an 8-timeframe dashboard, Fuel momentum, weighted consensus, synthetic HTF processing and chart-native higher-timeframe context lines. The goal is simple: read current trend, multi-timeframe structure, strength, momentum and EA-ready state from one discipline
OmniSync Projection
Antonio-alin Teculescu
5 (1)
Chronos Fractal Engine is an innovative price projection indicator for MetaTrader 5, designed to transform your technical analysis by intelligently identifying and projecting historical price patterns. Built upon an advanced correlation algorithm and the fractal principles of the market, this powerful tool visualizes potential future price movements, giving you a unique edge in your trading decisions. What is Chronos Fractal Engine? At its core, the Chronos Fractal Engine employs a sophisticat
FX Power MT5 NG
Daniel Stein
5 (31)
FX Power: Daha Akıllı Ticaret Kararları için Para Birimlerinin Gücünü Analiz Edin Genel Bakış FX Power , her piyasa koşulunda başlıca para birimlerinin ve altının gerçek gücünü anlamak için vazgeçilmez bir araçtır. Güçlü para birimlerini alıp zayıf olanları satarak, FX Power ticaret kararlarınızı basitleştirir ve yüksek olasılıklı fırsatları ortaya çıkarır. İster trendlere sadık kalın ister Delta'nın aşırı değerlerini kullanarak tersine dönüşleri öngörün, bu araç ticaret tarzınıza mükemmel bir
FX Levels MT5
Daniel Stein
5 (13)
FX Levels: Tüm Piyasalar İçin Son Derece Hassas Destek ve Direnç Hızlı Bakış Döviz kurları, endeksler, hisseler veya emtialar gibi herhangi bir piyasada güvenilir destek ve direnç seviyeleri belirlemek mi istiyorsunuz? FX Levels geleneksel “Lighthouse” yöntemini ileri düzey bir dinamik yaklaşımla birleştirerek neredeyse evrensel bir doğruluk sağlar. Gerçek broker deneyimimize ve otomatik günlük güncellemeler ile gerçek zamanlı güncellemelerin birleşimine dayalı olarak, FX Levels size dönüş nok
Market Structure Patterns
Samuel Manoel De Souza
4.47 (19)
Market Structure Patterns ,   smart money concepts   (akıllı para kavramları) temelinde geliştirilen ve   SMC/ICT   öğelerini grafik üzerinde gösteren bir göstergedir. Bu öğeler, işlem kararlarınızı bir üst seviyeye taşımanıza yardımcı olur. Grafikte bir unsur oluştuğunda, fiyat bir seviyeyi geçtiğinde veya bir kutu/bölgeye girdiğinde,   uyarılar ,   bildirimler   ve   e-posta mesajları   aracılığıyla anında bilgilendirilirsiniz. Geliştiriciler,   global variables   (küresel değişkenler) aracıl
TREND ÇİZGİLERİ PRO       Piyasanın gerçek yön değiştirdiği noktayı anlamaya yardımcı olur. Gösterge, gerçek trend dönüşlerini ve büyük oyuncuların piyasaya yeniden girdiği noktaları gösterir. Anlıyorsun   BOS hatları   Daha yüksek zaman dilimlerindeki trend değişiklikleri ve önemli seviyeler, karmaşık ayarlar veya gereksiz gürültü olmadan gösterilir. Sinyaller yeniden çizilmez ve çubuk kapandıktan sonra grafikte kalır. MT4 SÜRÜMÜ   -   RFI LEVELS PRO   göstergesiyle   birlikte kullanıldığında m
Yazarın diğer ürünleri
Description by chatGPT: In the dance of flames, a candle transforms, From the close of old, a new light is born. A derivative of candles, changing forms, Unveiling secrets in the flickering morn. Like indicators, patterns do precede, On charts of price, where future paths are sown. The candle's dance, a signal to take heed, Foretelling tales in fiery lines shown. I trust the candlemakers to discern, Using indicators as their guiding light. In every flame, a lesson to be learned, In every shift
FREE
The indicator enables very quick orientation in the market phase (re/accumulation, re/distribution, up/down trend). It is counted only from price data (without volume). It is based on the assumptions of Wyckoff's law of Causa and Effect. Oscillations are an expression of the level of market uncertainty and point to the presence of Big Money. Such a "storm" is followed by a calmer trend that needs to be exited. You need to use other tools or shorter period of the same indicator for that. I keep t
This indicator shows the MACD line and the difference WMACD - MACD to it. that is, the divergence between price and weighted acceleration. Divergence is shown with a histogram. It took a bit of math to get a readable result. What does the histogram say? If the course is consistent with the price movement, then the price is driven by volumes. It is passing through an area of higher liquidity, the market is being manipulated by strong money. Within Wyckoff's theory, these are typically climax and
Market Profile, Volume Profile? Extra paid in TradingView, displayed for the last moment in time or discreetly, e.g. after 24 hours. Counting super-accurate values from a histogram...? None of these ways suited me. I was looking for an expression of the dynamics of the market, its liquidity, I just wanted to clearly see where the money was flowing. I thought I would calculate the volume weighted price percentiles for a certain period. To make the calculation more accurate, I calculate from a low
The Fat and Slim indicator tracks strong and weak money in the market. It is derived from RSI, MFI and many similar indicators. Input values are closing prices and volumes. The RSI (yellow curve) is in the range -100 ... 100. It is additionally multiplied by a coefficient so that the curve is not compressed to the middle values at higher periods (a problem with the classic RSI with different periods). Strong/Fat red curve is RSI weighted by higher volumes. Weak/Slim blue curve is calculated so t
The stochastic indicator itself creates false signals. One way to determine that the price is trending is to use the parabolic SAR indicator. As a rule, it is plotted on the chart. The projection of the SAR into the Stochastic Indicator is not complicated (pSAR-min)/(max-min). This will allow you to track price movement from two views in one place. It depends very much on the parameter settings. If the price is trending, the SAR moves towards the midpoints or close to them. On the other hand, a
Filtrele:
Değerlendirme yok
Değerlendirmeye yanıt