YouTube'dan Mağaza ile ilgili eğitici videoları izleyin
Bir alım-satım robotu veya gösterge nasıl satın alınır?
Uzman Danışmanınızı
sanal sunucuda çalıştırın
sanal sunucuda çalıştırın
Satın almadan önce göstergeyi/alım-satım robotunu test edin
Mağazada kazanç sağlamak ister misiniz?
Satış için bir ürün nasıl sunulur?
MetaTrader 4 için Uzman Danışmanlar ve göstergeler - 77

This is a must have tool for every trader, because this indicator provides the scoreboard with most important basic information for trading. It displays current server time, remaining time of the current bar, a calculated lot for the specified risk and free margin, characteristic bar sizes, and spreads. When placed on a chart, the indicator creates a text label in the upper right corner with the following information: -17:50 [70%] 11:42:30 SL:0 SP:17 B:A41/M39/D67 L:0.26/5% remaining time to cur
FREE
Daily Average Retracement Dashboard is an indicator that allows you to monitor multiple currency pairs at one time. This indicator is mainly for strategies that trade price retracement based on Resistance 3/4 or Support 3/4. After applying this indicator to the chart window, it will hide the chart and display the currency pairs in a table form. There are several data shown on the table that will help trader know when to analyze the currency and do trade using retracement. The indicator will only
FREE

Property of Vertical Capital Edition: Gugol_Quants About USA INDEXES QUANT_INDICATOR: This is a indicator created by math modulation to be used as a trading tool, which was developed in MQL. (MT4) This indicator is for use only with US500(S&P500), NAS100(Nasdaq Composite) and US30(Dow Jones). Signals are activated on "Open" Candle. It’s based on Intraday/Swing Trades whose main timeframe is H1, H2, H3 and H4. However you can use it with other assets by testing with the appropriate settings. *
FREE
An indicator for analyzing different currency pairs simultaneously Forex is a complex market that requires several currency pairs to be analyzed simultaneously Determine the number of currency pairs yourself Determine the currency pair you want to analyze to analyze 4 of the most important and similar currency pairs at the same time. For direct and simple analysis, some currency pairs have changed (EURUSD>>>USDEUR) Do not doubt that to succeed in this market, you must analyze several currency pa
FREE

The utility is designed to close and delete positions when the specified loss/profit values are reached in the currency/percentage of the Deposit. The chart displays a panel with information: profit/loss on the account, the number of open positions, and total positions in lots. Parameters: SHOW THE DASHBOARD - TRUE - Yes, FALSE - No. CURRENCY PAIRS - TRUE - All, FALSE-Current. STOP PROFIT IN $ OF THE DEPOSIT - Profit value in the Deposit currency. STOP LOSS IN $ OF THE DEPOSIT - Loss value in
FREE
With Symbol Switch you can easily change the symbol of all open charts without losing your analysis or template. Easily monitor many symbols with only one monitor. Auto save\load analysis separately for each symbol (including all graphical analysis and attached indicators). The indicator shows the symbols which are visible in your MT4 "Market Watch" window. To add\remove a symbol just add\remove it from MT4 "Market Watch" window. Monitoring all symbols profit with the panel. Works with all broke
FREE

This is a light version of OneClickWonder. It has a limitation of lotsize ( 0.01 ) and also the trade direction (only SELL ) and magic number is fiexd (magic number = 11 ) ------------------------------------ OneClickWonder manages open trades by Magic Number and Symbol , providing: · Individual or Basket Trailing Stop · Optional Averaging system (adds new trades automatically) · OneClickOrder buttons (BUY / SELL directly from chart) · Works
FREE

The Tickerly TV Connector allows seamless integration between TradingView strategies and your MT4 terminal.
With this tool, you can automate trade execution by linking TradingView’s powerful scripting environment to your MetaTrader Terminal. Features include fast trade execution via Tickerly’s engine and easy setup using webhooks.
This EA is perfect for traders who want to deploy custom TradingView strategies on MT4, keeping their terminals in sync with real-time market conditions. Requires m
FREE
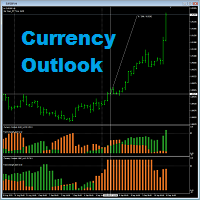
Currency Outlook is an indicator that can help us "Trade the right pair in the right direction and at the right time". This indicator analyzes prices of all cross currency pairs of the selected currency and report the result to us in form of double colours histogram diagram. The maximum height of the histogram diagram of the indicator is 100. The indicator is exclusively programming for AUD, CAD, CHF, EUR, GBP, JPY, NZD and USD. A feature for calculating trade lot size has been added to th
FREE

Simple. Informative. Instantly Visible on Your Chart. Alwinson Active Trades Info (MT4 Version) is a lightweight custom indicator that displays a real-time summary of your currently open trades —right on your chart. No more switching tabs just to see what pairs are active and how much lot size is in play.
Alwinson Active Trades Info is also available for the MetaTrader 5 (MT5) version (please check on my other products).
Key Features: Displays a list of all symbols with open positions
FREE

This is a fully functional evaluation version for working on "CADCHF". Full version - Risk Controller If there are active deals on the account when the robot is launched, then all of them except CADCHF will be closed! Risk controller is a tool allowing you to automatically control orders, losses and emotionally motivated actions.
Main advantages Limitation of the total account loss. When the MinimalDepo value is reached, any trade will be closed. Limitation of losses per day. Limitation of los
FREE
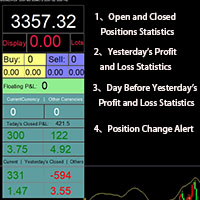
Smart Trade Monitor — Real-Time Position Tracking, P&L Analysis & Alert System Real-Time Monitoring : Auto-tracks open/closed positions, displays yesterday’s & previous day’s P&L—no manual calculations!
Smart Alerts (Premium Only) : Instant push notifications + sound alerts for position changes—never miss a trading opportunity!
User-Friendly : One-click setup, key data displayed directly on charts for faster decisions.
Cross-Platform : Supports both MT4 & MT5, compatible with
FREE

Telegram Trading Panel – Telegram üzerinden MT4 emir kontrol aracı Amaç
MetaTrader 4 için yardımcı araç: Telegram’daki inline klavyelerle emir aç/kapat, SL/TP ayarla, bekleyen emir oluştur ve pozisyon bilgilerini görüntüle. Mobil/VPS kullanımına uygundur. Özellikler Telegram paneli: Piyasa BUY/SELL Tek emri kapat veya “Hepsini kapat” Bekleyen emirler: Buy/Sell Limit, Buy/Sell Stop (fiyat + süre) Yardımlı Break Even: SL’i açılış fiyatına ±1 pip (onaylı) ayarla Para veya pip ile SL/TP Pozisyon bil
FREE
This is a MetaTrader 4 script. It helps to export all trades into a CSV file as per Symbol and selected periods.
Input Select Symbol: This is 2-option input. Select current symbol or all symbols to export its orders. Select Period: This is 7-option input. It includes Last Month, This Month, Last Week, This Week, Today, All History, and Date Specified. Specify Starting Date: Enter a date if you selected Date Specified in "Select Period" input. Specify Ending Date: Enter a date if you selected Da
FREE

Forget about searching for the pair you want to open on the Market Watch screen. With TPX Symbol Charger, you'll make your life easier by adding multiple pairs with just one click. You can edit the list of pairs you trade, and with one click, you'll go to the pair you want quickly and accurately! Just fill in the list of pairs, separating them with a semicolon (;). To create a second line of pairs, simply include an asterisk between the semicolons (;*;). Another useful TPX tool for you!
FREE

Good morning, The following indicator is very useful when managing multiple trades on the same instrument. It allows you to see the average entry price for BUY and SELL trades. If there is an imbalance (as shown in the example photo), the indicator will display the averages of the SELL/BUY trades and a GOLD line that marks the breakeven price (excluding swap and commissions).
FREE

Everything is very simple here. I have never understood indicators without external parameters. And the Awesome Oscillator is no exception. Now you can customize this indicator to suit your needs and strategies.
Reference: The Awesome Oscillator indicator shows the distance in points between two moving averages (fast and slow).
The AO_Robex indicator has in its parameters a change in the period of moving averages. The default parameters are the same as in the standard indicator.
FREE

VisualOrders and InfoAccount - an indicator for analyzing your own trading or analyzing someone else's account.
Additionally, there is a possibility to quickly obtain information on the account and the terminal. Information is placed both on the chart and in the Experts tab.
All displayed information is disabled in the settings, allowing the trader to leave only the necessary information.
FREE

Martingala Assistance, as its name says ... It is an assistant, an expert advisor that monitors all the orders for the asset in which it has been placed, no matter if that order was by some other expert advisor or by the trader placed on the Manually, he will start his work after each order that is negative.
See more products on: https://www.mql5.com/en/users/joaquinmetayer/seller .
FREE

Garfield Equity Loss Closer is an expert advisor who will stay in control of the equity / float of the account, when the negative float reaches the amount defined from the inputs, he will close all existing orders.
Only one input, it is the negative amount in the currency of your account that you must reach to start closing all positions.
Its use is recommended for those expert advisors who use a volume increase system, either hedging (recovery zone) or martingale since sometimes without real
FREE

The panel for the MT4 terminal is designed to help the trader quickly set pending orders for a breakout of the previous bar.
The utility calculates the order lot itself at the specified stop loss price and maximum loss percentage.
The panel also has a button for converting to breakeven. When you click, the stop loss of an open position is converted to the order opening price.
FREE

PendingOrderActivator manages pending orders in the forex market in a continuous cycle.
The user must configure the duration of the orders, stop loss levels, take profit levels, and the MagicNumber.
The expert advisor automatically places pending orders based on the distance from the current price and deletes them when the opposite order is triggered.
When an order is activated, the bot will take a break until the user reconfigures it or changes the timeframe, at which point the bot will reactiv
FREE
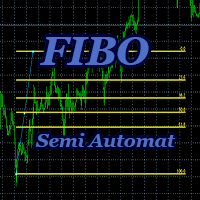
Advisor-assistant for those who like trading on Fibonacci levels. Automatically finds manually plotted Fibonacci Lines on the chart, and opens an order when the levels are broken. The Expert Advisor has 4 customizable levels and the ability to turn them off as unnecessary.
Parameters: Lot - order volume (lot); Requote - price slippage; Magic - individual number for all EA orders, works only with own orders; Name Fibo - set initial name of Fibonacci lines; Level parameters are ide
FREE

The MAtrio indicator displays three moving averages on any timeframe at once with a period of 50-day, 100-day, 200-day. After attaching to the chart, it immediately displays three moving averages with the parameters of simple (SMA) moving average SmoothingType50 , simple (SMA) moving average SmoothingType100 , simple (SMA) moving average SmoothingType200 . Accordingly, with the price type ValuePrices50, ValuePrices100, ValuePrices200 , by default, the price is Close price everywhere. All parame
FREE
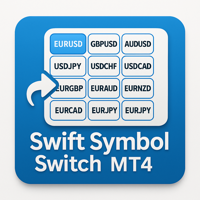
Add a clean, on-chart button panel that lets you instantly switch between any forex pair, crypto, or commodity with a single click—no typing, no symbol search, and no menu digging required. This EA works seamlessly with any MT4 broker and on any timeframe, making it ideal for scalpers, swing traders, and long-term analysts alike. It automatically detects broker-specific symbol suffixes, highlights the currently active pair for easy tracking, and includes both light and dark mode themes to match
FREE

This Program will not execute any trades!
Works on any chart and any time frame!
This is the MT4 version.
MT5 version: https://www.mql5.com/en/market/product/125600?source=Site+Market+My+Products+Page
This Program will produce a comment box at the top left of the chart and show you your equity % difference throughout the day. Updating constantly in real time.
The daily resets back to zero on open of a new market open day. Using new current equity at start of day as reference for future calc
FREE

This indicator provides essential information in a simple table about market range and identify whether the market has touched important pivot levels and breakout previous high/low. This version is still in the testing phase and is being offered for free and can only be used for a period of 3 months. We value your feedback to help us improve this application.
FREE

this is a multi-functional orders all closing script
MT4 version
Feature: 1, it can close all orders of the chart symbol or all symbols. (select mode) 2, it can close all orders of buy, sell or both type. 3, it can close all orders of profit, loss, or any. 4, you can specify magic number, order comment as filters for the order closing operation. 5, it can also do partial closing by percentage to all orders.
it's strongly recommended to set a "hotkey" to this script when you use it. wish you
FREE

This indicator is an utility for have always under control, how much time is left at the end of the bar setted.
The utility show on the lower right of the chart, the countdown to the end.
When the remaining seconds is = to the seconds set in the input, the color of remaining seconds on chart, change color and play a warning sound to warn you that the bar is about the end. When the remaining seconds is < to the seconds set in the input, the utility play a beep to warn you that the bar is in co
FREE

Script for Close all open BUY orders.
Usage:
- Enable Automate Trading
- Attach / Double click the script
ENJOY IT.
//+------------------------------------------------------------------+ //| Close Buy.mq4 | //| Copyright 2015, SangBatosai-Code5 | //| https://www.mql5.com/en/users/mahakaya | //| Credit: | //| SangBatosai-Code5
FREE

Msg2Slack, MT4/MT5 metin kutularından Slack'e mesaj gönderen araçtır. Metin kutusunun sağ tarafında bulunan düğmeye tek bir tıklama ile Slack kanalınıza kolayca metin ve grafik görüntüleri gönderebilirsiniz. Grafikte çizgiler, işaretler, yorumlar ve daha fazlasını çizseniz bile görüntü yayınlanacaktır.
İster kendinize ister bir gruba mesaj göndermek isteyin, bu basit ama güçlü araç, grafik görüntüleri yakalamayı ve anında mesaj göndermeyi inanılmaz derecede kolaylaştırır.
Msg2Slack aracı, graf
FREE

Blind Broker System 'in tek amacı ticaret planlarınızı gizlemek ve onları Broker'ınız için görünmez kılmaktır. Onu gerçekten "kör" yapmak ve zarar durdurma seviyeleriniz, hacimleriniz, kar alma seviyeleriniz hakkında önceden hiçbir şey bilmediğinden emin olmak istiyorsanız, bu ticaret robotunu kullanın.
Blind Broker System alternatif bir sipariş yönetimi sistemidir. Bir anlamda Meta Trader Terminal içindeki sistemle aynıdır.
Aradaki fark, Blind Broker System üzerinden verilen tüm emirlerin
FREE

MetaTrader to Prometheus Exporter Optimize your trading by easily exporting your MetaTrader data to Prometheus and transform it into powerful visual insights through Grafana dashboards. This utility bridges the gap between your trading platform and modern monitoring solutions.
Key Features:
Automatic export of trading metrics from MetaTrader (MT4/MT5) Full Prometheus format compatibility for immediate integration Simple and flexible metric configuration Low performance impact on MetaTrader Su
FREE

This indicator works on this way: Trader should provided the n period "Number of Candle" ( the default period is 6) Then the indicator will calculate the number of pips in the last n period (not the current candle) And that is display on the chart With that the should confirmed his up trend or down trend analyse according to the number of pips in the last n candles( bullish or bearish) he has provided
FREE

The indicator allows you to trade binary options. The recommended time frame is М1 and the expiration time is 1 minute. The indicator suitable for auto and manual trading. A possible signal is specified as a arrows above/under a candle. You should wait until the candle closes! Arrows are not re-painted Trade sessions: LONDON and NEWYORK section Currency pairs: GRB/USD Working time frame: M1 Expiration time: 1 minute. The indicator also shows good results when using the martingale strategy - "Mar
FREE

Piyasa 4H veya 1H hareketli ortalamanın (MA) üzerindeyken alış, altındayken satış yapmayı düşünmek büyük kayıp riskini azaltır. Kazanma oranını artırır.
5 dakikalık mum kapanışının 1 saatlik (H1) veya 4 saatlik (H4) 20MA'yı kestiği tam anda sizi uyarır.
Bu araç, yüksek zaman dilimi onayına önem veren yatırımcılar için tasarlanmıştır. Arka planda piyasayı izleyerek, kritik trend değişimlerini kaçırmadan istediğiniz grafiğe odaklanmanıza olanak tanır. Onay için M5 mum kapanışını kullanarak,
FREE

Revolutionize Your Trading Experience with Our Advanced Management Panel Maximize efficiency and control with our cutting-edge Management Trades Panel, exclusively designed for discerning traders. Our innovative panel is a game-changer in the realm of financial trading, offering unparalleled functionality and user-friendly features. Key Features: Automated Daily Profit/Loss Closure : Set your desired profit or loss thresholds, and let our panel automatically close all current trades when these
FREE
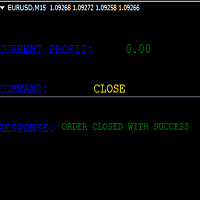
KEYBOARD CONTROL TRADING This script allows you to buy, sell or close positions using the keys on your keyboard. This allows you to create shortcuts to place buy or sell orders or to close an open position.
Setting:
LOT: To choose the lot size of your order.
TAKE PROFIT PIPS: To set your take profit in pips
STOP LOSS PIPS: To set the stop loss in pips
KEY FOR BUYING: To choose the keyboard touch to buy: -Up : To choose the UP direction key to place purchases -B : To choose the direction k
FREE

Make trades on symbols which are corelated not making any sense. So what if we can check, which of symbols are not corelated to each other and are oposit in current trend. For this simple and quick analyze you can use this utility. Simply run and see list of symbol pairs which are oposit to each other. Results of analyse will be printed in Strategies log. Duplicity A -> B == B -> A is not displayed.
You can specify period for which will be calculated trend (Daily,Hourly,Mothly), choice de
FREE
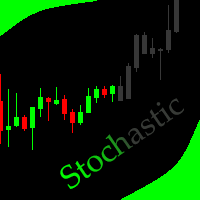
This indicator allows to hide Stochastic oscillator (on all MT4 timeframes) from a date define by the user, with a vertical line (Alone) or a panel (with "Hidden Candles"). Indicator Inputs: % K Period % D Period Slowing Apply To Method Information on "Stochastic Oscillator" indicator is available here: https://www.metatrader4.com/en/trading-platform/help/analytics/tech_indicators/stochastic_oscillator ************************************************************* Hey traders!! Give me your
FREE

Welcome. This indicator is for alarming the trader by sound when Symbol's price goes above or below certain level(s). It doesn't do any trading. Setting the levels is very handy, you just drag them with the mouse on the chart. You can customize the sounds the Indicator alarms you by (may be useful for office with a number of the terminals running). Also, this product includes an auxiliary Windows application that makes the usage even more handy. This product includes 4 parts: Sounder_TopBottomLe
FREE

The chart bucket indicator primarily creates custom candlesticks which comes with adjustable colors, color themes and sizes and even comes with a demo. Also included are trade details relevant to trading and binary options.
If your a binary options trader this may be useful for timing of bars with actual price that you can compare with your binary options broker.
Key Features Custom Candlestick Themes, Custom Colors & Sizes. Ask/Bid Point Difference.
Open/Close Point Difference of current bar
FREE
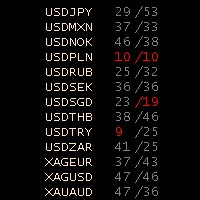
Stochastic Oscillator Panel Introducing the Stochastic Oscillator Panel, a comprehensive representation of the stochastic oscillator for all currencies (up to 75 pairs). This powerful tool operates within the current time frame, utilizing the simple moving average and relying on the Low/High prices. The panel consists of three columns: Name of the currency MODE_MAIN (main line) MODE_SIGNAL (signal line) The Stochastic Oscillator Panel provides visual cues through color coding: Green color (overb
FREE

Introducing the “Symbol Cost Info MT4” indicator – your ultimate tool for staying ahead in the forex market! This innovative indicator is designed to empower traders with real-time cost information, directly on their charts. Here’s why every trader needs the “Symbol Cost Info MT4” in their arsenal: Real-Time Spread Monitoring : Keep a close eye on the spread for any currency pair, ensuring you enter the market at the most cost-effective times. Pip Value at Your Fingertips : Instantly know t
FREE

This expert is a utility to help any trader to find the right lot size according to the risk he wants to take. It calculates the lot size based on account equity and added stop loss.
The utility can't to open or close position.
Attach the expert in the same symbol as the one you want to open position.
PARAMETERS LossPips - Stop loss in pips for your position. RiskPercent - Risk of equity you want to get.
FREE

"Giant" is a flexible system in relation to trading strategies. It consists of two high-quality indicators that are installed on five different timeframes of the same currency pair (see screenshot). It monitors the trend and gives signals to open. The system passed a large number of checks and showed high accuracy. Indicators are sold separately. The second word in the main name is the indicator itself. This issue sells the indicator "Nicely" .
FREE

Price Change Indicator Introduction The Price Change Indicator is a powerful tool designed to help traders identify significant price movements over a specified period. By calculating and visualizing percentage changes between current and historical prices, it allows traders to quickly spot potential trading opportunities when markets show unusual volatility or momentum. Features Real-time monitoring of price changes Visual histogram display when changes exceed threshold Text display showing cur
FREE
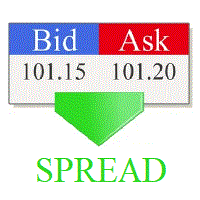
Real-time spread tracking and monitoring software
Displays spread values in form of histograms on current timeframe of chart Convenient for analyzing spread changes, as well as for comparing trading conditions of different brokers By placing on desired chart, the spread changes at different trading times are displayed
Additionally Fully customizable Works on any instrument Works with any broker
FREE

Binary Options Assistant (BOA) ICE Signals Indicator provides signals based on gkNextLevel Binary Options Strategy. Indicators: 2 Bollinger Bands & Stochastic
Stop missing trades, stop jumping from chart to chart looking for trade set-ups and get all the signals on 1 chart! U se any of the BOA Signals Indicator with the Binary Options Assistant (BOA) Multi Currency Dashboard .
All BOA Signal Indicator settings are adjustable to give you more strategy combinations. The signals can be seen
FREE

Choosing the levels of StopLoss and TakeProfit can have a very strong impact on the overall performance of trading. In addition to the obvious parameters of a trade transaction - the size of a possible win or probable loss - the levels of StopLoss and TakeProfit also affect the expected duration of the transaction, and the profitability of trading in general. If you have already determined the optimal transaction duration using the “ AIS-ODT ” script, then you can begin to determine the paramete
FREE

The panel allows you to place and open orders with one click of a button.
It is possible to quickly change the parameters of the lot, take profit, stop loss and expiration time.
The expiration parameter is valid only for pending orders. The trading panel works in the tester. To open a pending order, click on the buy or sell stop button, and then on a place on the chart.
(This function cannot work in the strategy tester for technical reasons) Expiration time is in minutes, everything else is
FREE

The script is based on the simulation of trade transactions using a random number generator. This allows you to get completely different results, even with the same input parameters. When you run the script, a dialog box opens in which you can set the desired values for external variables. In the Trading options block, the basic parameters that are necessary for trading modeling are defined. Start Balance - sets the initial size of the trade balance. Number Trade - sets the number of trade tr
FREE

ForexRiskMaster , MetaTrader 4 için özel olarak tasarlanmış güçlü bir yardımcı programdır . EA, emirleri yürütmek için göstergeden gerekli tüm parametreleri alır. "Dikkat: Gösterge olmadan Uzman Danışman işlevsizdir. Uzman Danışman, göstergenin iki çizgisine dayanarak emir açma görevini sessizce arka planda gerçekleştirir. Gösterge, Uzman Danışman olmadan çalışabilir ve lot büyüklüğünü belirleyebilir, ancak Uzman Danışman gösterge olmadan işe yaramaz." Önemli Özellikler: Parametrelerin Alınması:
FREE

"All in One" panel. You can simultaneously control: up to 3 symbols; up to 6 periods; up to 31 popular signals. You can see the sum for all signals taking into account the weight of the signal Version for MetaTrader 4: https://www.mql5.com/ru/market/product/27880 Version for MetaTrader 5: https://www.mql5.com/ru/market/product/27830
Parameters NUM_BAR - number of the bar to analyze (set a value greater than 0 to work on closed bars). timeframe_1....timeframe_6 - working timeframes (if set to "c
FREE

The indicator marks bars with a simple trend definition“ each subsequent high above/below the previous one and each subsequent low above/below the previous one ”. Charles Dow
Formula:
Max – The current maximum Min – The current minimum MaxK – Maximum per period MinK – Minimum per period Min>MinK & Max>=MaxK – Symbol on top Max<MaxK & Min<=MinK – The symbol on the bottom
Input parameter:
Number of bars in the calculated history Period for current timeframe The distance to the symbol Se
FREE

Tired of manually adjusting stops? This powerful EA automatically secures your profits with dynamic trailing stops, protecting gains while letting winners run. No trade openings – just effortless risk management for your existing positions. Why Traders Love This EA Never Miss Profits Again Auto-locks gains as price moves in your favor. Eliminates emotional decisions – sticks to your predefined rules. Three Smart Trailing Modes Choose the method that fits your strategy: F
FREE
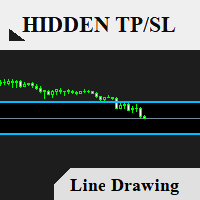
This's free demo version for testing on CADCHF currency. Full version can be found here : https://www.mql5.com/en/market/product/38022
Smart Tools for control stop-loss and take profit level. Drawing horizontal line to control stop-loss and take profit level. Can be setting stop-loss and take-profit level as low as possible! even 1 pip. Can be drag and drop lines on real-time. Useful for scalping trading method.
How to use ? Just place this EA to any currency that you want to take control ord
FREE
The Change Chart Timeframe EA is a powerful tool that provides users with the ability to effortlessly modify and customize chart timeframes according to their trading strategies and personal preferences. You can select individual charts to modify or apply changes to all charts simultaneously, saving valuable time and effort. This EA is just a tool to help with your auto trading. It doesn't open any trades, so nothing happens if you backtest it. Any setting marked with "(pro)" will use its
FREE
Template Toggle Indicator General Description The Template Toggle indicator is a custom tool for the MetaTrader 4 platform, designed to streamline the process of switching between predefined chart templates. It displays interactive buttons on either the main chart or a sub-window, allowing traders to quickly apply different templates without manually accessing the template menu. Ideal for traders who frequently switch between chart setups for various currency pairs or trading strategies. Key Fea
FREE

AR Canada Lite is a fully automated Expert Advisor optimized for trading USDCAD H1. The Expert Advisor DOES NOT use hedging, martingale, grid strategies, arbitrage, etc. It uses a trading algorithm based on the intersection of two moving averages for analyzing the market conditions. The Take Profit and Stop Loss values are fixed and have a ratio of 1 to 4. The EA closes positions when Take Profit or Stop Loss are reached.
Parameters Lots - lot size; MagicNumber = 3 - unique magic number of the
FREE
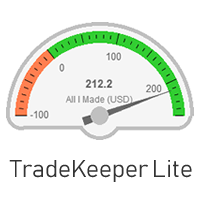
The utility TradeKeeper Lite can show your profits for different periods and bip a sound when you reach a profit target value. Click the tachometer to quickly switch to the next profit period. There are 5 of them: This Day, This Week, This Month, Last 90 Days and All I Made. With the utility TradeKeeper Pro , available at this link , you can also open trades with a magic number and volume of your choice, trail any orders with a simple trail or iSAR-based trail, as well as close any open trades a
FREE
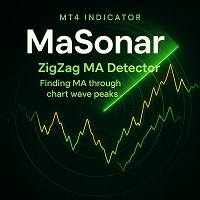
MaSonar is a powerful indicator designed to automatically detect and display the relevant Moving Averages (MA) that align with the peaks of a ZigZag. It quickly searches for the most suitable MA at each ZigZag peak, helping you analyze the market trend and its momentum with ease. Key Features: ZigZag Peak Matching: Automatically identifies and displays the MAs that match the ZigZag peaks. Quick Button Search: Simply press a button to search for the matching MA from the most recent peaks. Adjusta
FREE
This utility will help you avoid losing money on your trades when your terminal loses connection to the broker or your VPS / computer goes into an update and doesn't open your MetaTrader client automatically after the update. How is this product different from the other disconnect alerts? This one will email you and/or an SMS even when your MetaTrader client gets disconnected from the Internet or doesn't respond! Your client is monitored externally and doesn't rely on its own Internet conn
FREE

This tool automatically sets stop loss and take profit when opening orders.
The information is displayed in the lower right corner of the terminal and displays the lot size, stop loss and take profit levels, as well as the current profit/loss in points for each open order.
It is possible to close orders. to do this, double-click the desired order in the lower right corner and simply move it to the left.
It also displays recommendations for the current instrument in the form of OPEN BUY, KEEP
FREE

Demo version of the paid product - Copy MT4 copier , limited to lot size of 0.01 Universal copier of deals from MetaTrader 4 to MetaTrader 4 ( MT5<->MT5 version is available ; with both versions, you can copy MetaTrader 5<->MetaTrader 4, MetaTrader 4<->MetaTrader 5, MetaTrader 5<->MetaTrader 5, MetaTrader 4<->MetaTrader 4). Spread filter. Select the best price (start copying positions with a profit or loss). Configure the lot size, fixed or ratio-based (provider signals can be copied with an inc
FREE
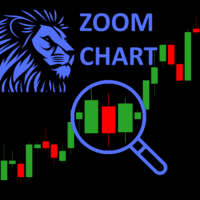
The ZoomChart indicator displays data from other timeframes on the current chart in the subwindow, acting as a magnifying glass or, conversely, shrinking the chart to display larger timeframes.
The ZoomChar indicator automatically tracks the current outermost bar on the chart and moves with the chart as it shifts.
The indicator can display data from another financial instrument, not limited to the main chart instrument.
The robot carries the function of “mirroring” - The ability to convert c
FREE

Shows on the chart a two moving averages histogram. It allows to send alerts to MetaTrader platform when the crossovers occurs. You can use it on any timeframe, moving averages settings can be adapted as well as the appearance and colors.
The parameters for the indicator are Fast moving average period Slow moving average period Moving Average Mode Moving Average Price Alert on crossovers Histogram Bar Width Bullish Color Bearish Color
FREE

### Program Overview
**RemoteBatchClose EA** is an automated closing tool designed for forex traders, aimed at assisting users in managing open positions when they are away from their computers. By automatically monitoring specified pending order prices and currency pairs, this program can execute closing operations when conditions are met, thereby reducing the user's operational burden and ensuring effective implementation of trading strategies. Its primary purpose is to address the inconveni
FREE

This indicator can display the remaining time of the current K-line closing in real time
Supports any time period Automatically and dynamically follow the current K-line position Automatically calculate days, hours, minutes, and seconds
I have added a quick control panel in the bottom left corner for it. When multiple different Bank series indicators are enabled at the same time, the control panel can quickly switch between displaying/hiding each indicator, so that the chart does not display m
FREE
This Expert Advisor is used to send messages from the PCT Multi indicator to Telegram.
The EA has 5 settings: - Channel name: The name of the Telegram channel. - Token: Your bot's Token. - Entries: Entry messages will be sent. - Results: Entry results will be sent. - Alerts: Alerts will be sent.
How to set up: In the Tools -> Options menu, in the "Expert Advisors" tab: - Check the "Allow WebRequest for listed URLs:" option. - Click "add new URL" and add " https://api.telegram.org " (without th
FREE
MetaTrader mağazasının neden alım-satım stratejileri ve teknik göstergeler satmak için en iyi platform olduğunu biliyor musunuz? Reklam veya yazılım korumasına gerek yok, ödeme sorunları yok. Her şey MetaTrader mağazasında sağlanmaktadır.
Alım-satım fırsatlarını kaçırıyorsunuz:
- Ücretsiz alım-satım uygulamaları
- İşlem kopyalama için 8.000'den fazla sinyal
- Finansal piyasaları keşfetmek için ekonomik haberler
Kayıt
Giriş yap
Gizlilik ve Veri Koruma Politikasını ve MQL5.com Kullanım Şartlarını kabul edersiniz
Hesabınız yoksa, lütfen kaydolun
MQL5.com web sitesine giriş yapmak için çerezlerin kullanımına izin vermelisiniz.
Lütfen tarayıcınızda gerekli ayarı etkinleştirin, aksi takdirde giriş yapamazsınız.