Alım-satım robotlarını ücretsiz olarak nasıl indirebileceğinizi izleyin
Bizi Facebook üzerinde bulun!
Fan sayfamıza katılın
Fan sayfamıza katılın
Komut dosyasını ilginç mi buldunuz?
Öyleyse bir link gönderin -
başkalarının da faydalanmasını sağlayın
Öyleyse bir link gönderin -
başkalarının da faydalanmasını sağlayın
Komut dosyasını beğendiniz mi? MetaTrader 5 terminalinde deneyin
- Görüntülemeler:
- 45028
- Derecelendirme:
- Yayınlandı:
- Güncellendi:
-
Bu koda dayalı bir robota veya göstergeye mi ihtiyacınız var? Freelance üzerinden sipariş edin Freelance'e git
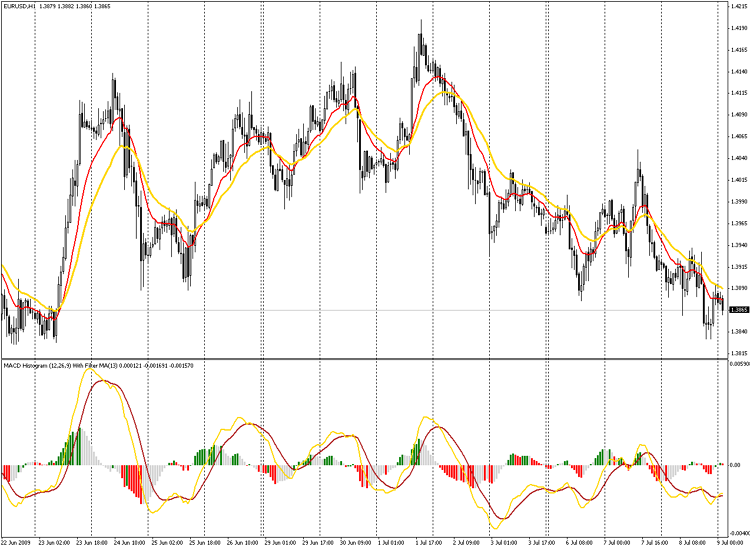
MACD lines and histogram for the Impulse trading system.
The idea:- Histogram down (current value less than previous) and line (specified by Line input) does down, the histogram is red - long trades are prohibited;
- Histogram up (curerent value greater than previous) and line up, the histogram is green - short trades are prohibited;
- Histogram down and line up (or reverse case) histogram is grey -no restrictions;
The Inertia is defined by Line input parameter:
- 0 - MA(MAPeriod);
- 1 - MACD line;
- 2 - Signal signal line.
Other input parameters:
- FastMA - Period of Fast Moving Average;
- SlowMA - Period of Slow Moving Average;
- SignalMA - Period of the Signal Line;
- MAPeriod - Period of Moving Average if Line = 0;
- MAMethod - Averaging Method (MODE_EMA by default);
- MAAppliedPrice - Applied Price (PRICE_CLOSE by default);
- Line - described above;
- DigitsInc - Precision format Digits + DigitsInc

 VisualOpenOrderWithMM
Drag & Drop the script at chart on point where StopLoss should stay. Script will compare desired StopLoss with the current price and determine the type of the order - Buy or Sell. The next step is calculating the volume according Free Margin and the Risk
 Spectr
Spectr