Fan sayfamıza katılın
Öyleyse bir link gönderin -
başkalarının da faydalanmasını sağlayın
- Görüntülemeler:
- 27665
- Derecelendirme:
- Yayınlandı:
- Güncellendi:
-
Bu koda dayalı bir robota veya göstergeye mi ihtiyacınız var? Freelance üzerinden sipariş edin Freelance'e git
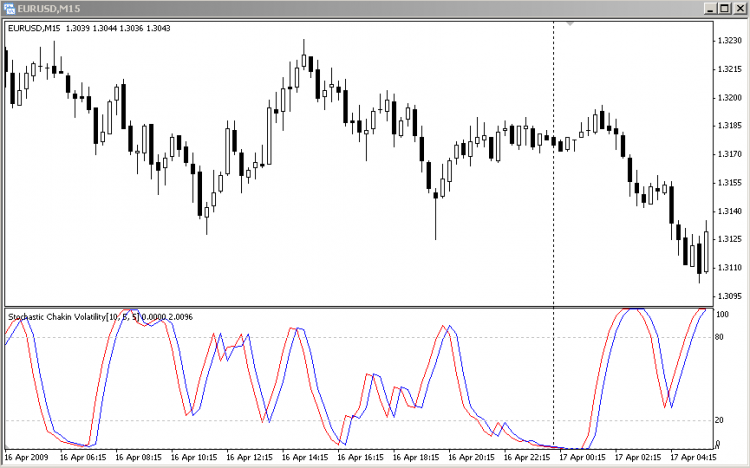
Analyzing the behavior of Chaikin's Volatility index I was wondering how it should behave in a modified version, following J.Ehlers suggestions, applying a stochasticization process to it, so this is the result.
Sure now it does not have much to do with the original one but it seems interesting and I would like to share it.

Stochastic Chaikin's Volatility
 ytg_ObjectsDeleteAll
Scripts deletes all objects from the diagram.
 Squeeze Break Indicator
This indicator uses a combination of Bollinger Bands and Keltner Channels to capture moves from low to high volatility.
 wajdyss_T3_indicator_v3
This indicator for draw an Arrows for buy & sell , it's Depends on T3 Indicator http://forum.m-e-c.biz/t29283.html
 Fractal Graph Dimension Indicator (FGDI)
A rework of a script by iliko, with the addition of the standard deviation of the estimator of the box-counting dimension