 MetaTrader 5
 Uzmanlar
 Göstergeler
 Komut dosyaları
 Kütüphaneler
 Depo
Depo
Fan sayfamıza katılın

Channel Breakout Dashboard - MetaTrader 5 için gösterge

https://www.mql5.com/en/market/product/183575
ZigZag Maturity — Multi-Timeframe Swing Maturity & Reversal Probability Dashboard
- Görüntülemeler:
- 1474
- Yayınlandı:
- Güncellendi:
-
 Alım-satım fırsatlarını kaçırıyorsunuz:
- Ücretsiz alım-satım uygulamaları
- İşlem kopyalama için 8.000'den fazla sinyal
- Finansal piyasaları keşfetmek için ekonomik haberler
Kayıt Giriş yapWeb sitesi politikasını ve kullanım şartlarını kabul edersiniz
Hesabınız yoksa, lütfen kaydolun -
 Bu koda dayalı bir robota veya göstergeye mi ihtiyacınız var? Freelance üzerinden sipariş edin
Freelance'e git
Bu koda dayalı bir robota veya göstergeye mi ihtiyacınız var? Freelance üzerinden sipariş edin
Freelance'e git
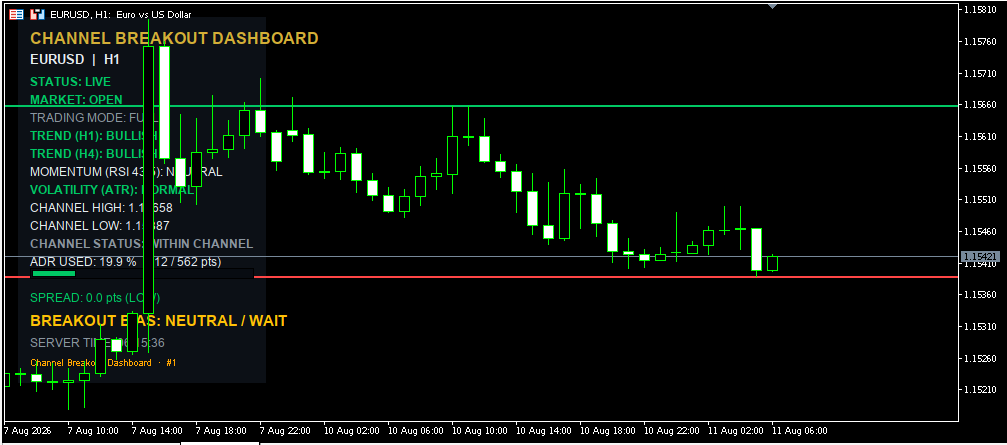
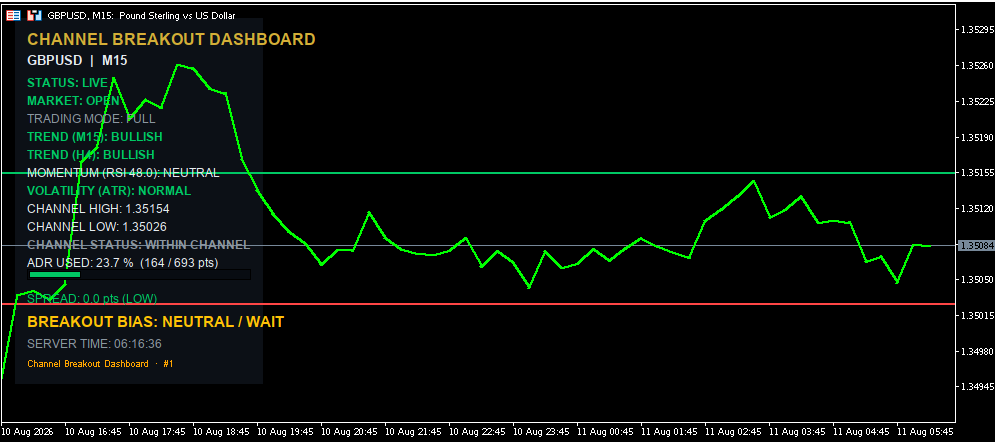
Channel Breakout Dashboard is an informational panel (not an automated trading robot) that runs on the MetaTrader 5 chart and centralizes, in one place, several market conditions that would otherwise require 4-5 separate indicators open at the same time:
- Trend on the current timeframe and on a higher timeframe (multi-timeframe bias)
- Momentum (RSI) with overbought/oversold zones
- Volatility (current ATR vs. average ATR)
- Price channel (highest high / lowest low over N bars) and breakout status
- ADR (Average Daily Range) — how much of the typical daily move has already been "used up"
- Current spread classified by thresholds (low/normal/wide)
- A combined bias score ("BUY SETUP" / "SELL SETUP" / "WAIT")
All of this information updates automatically at a configurable interval, without you needing to reload or reconfigure anything.
How it helps in real trading
- Reduces analysis time — you no longer switch between charts/timeframes to check HTF trend, RSI, and ATR separately; it's all in one panel.
- Filters false signals — a channel breakout without HTF trend confirmation, or with RSI at an extreme, is often a trap; the bias score combines several factors before it says "BUY/SELL SETUP."
- Manages spread risk — on brokers with variable spread (especially during news events or overnight), showing the live spread directly helps you avoid entries when the transaction cost is too high.
- Volatility/ADR context — helps you avoid opening a trend-following position when the day has already "consumed" 90% of the ADR (high probability of reversal/consolidation), and helps set realistic TP/SL levels.
- Works on any symbol and multiple instances — you can run a separate copy on each pair you follow, each with its own ID, without conflicts between chart objects.
- Robust on incomplete data — if the daily or bar history is temporarily insufficient (newly listed symbol, weekend, broker data gap), the panel keeps working with what's available, explicitly flagging "limited history" instead of freezing or throwing errors.
Explanation of every input
===== INSTANCE =====
- InpInstanceID — a unique number for each copy of the indicator you run (e.g. 1 on EURUSD, 2 on GBPUSD). Used to build unique object names so multiple instances never collide.
===== PANEL DISPLAY =====
- InpShowPanel — turns the dashboard panel on/off (if you only want the channel lines on the chart, without the dashboard).
- InpPanelCorner — which chart corner the panel is anchored to (top-left, top-right, etc.).
- InpPanelX / InpPanelY — pixel offset from the chosen corner (fine positioning).
- InpFontSize — base text size (7-24); all other sizes (title, footer) scale proportionally to this.
- InpAutoWidth — when on, the panel automatically recalculates its width based on the longest displayed text; when off, it uses the fixed width below.
- InpFixedWidth — the fixed panel width (used only when AutoWidth = false).
===== BLOOMBERG COLOR THEME =====
- InpBackgroundTheme — one of the predefined background themes (Bloomberg Classic, Deep Black, Navy, Charcoal, etc.) or "Custom."
- InpCustomBackgroundColor — the background color used only if the selected theme is "Custom."
- InpAccentTheme — the accent color for the border/title (Amber, Cyan, Gold, etc.) or "Custom."
- InpCustomAccentColor — the accent color used only if the selected theme is "Custom."
===== BLOOMBERG TEXT & UI COLORS =====
- InpTextPrimary — main text color (values, titles).
- InpTextSecondary — secondary/gray text color (less important labels).
- InpColorBullish — color used for bullish conditions (uptrend, bullish breakout, green ADR bar, etc.).
- InpColorBearish — color for bearish conditions.
- InpColorWarning — warning color (RSI overbought/oversold, wide spread, ADR nearly exhausted).
- InpColorNeutral — color for neutral/unknown states.
- InpBarBackground — background color of the ADR bar (the bar's track).
- InpBorderColor — color of inner borders / the ADR bar's edge.
===== TREND SETTINGS =====
- InpFastMAPeriod — period of the fast moving average.
- InpSlowMAPeriod — period of the slow moving average (must be greater than the fast one).
- InpMAMethod — MA calculation method (SMA, EMA, SMMA, LWMA).
- InpMAPrice — the applied price used for the MA calculation (close, open, high/low, median, etc.).
- InpHigherTimeframe — the higher timeframe used for the "macro" (context) trend, compared against the trend on the chart's current timeframe.
===== MOMENTUM SETTINGS =====
- InpRSIPeriod — RSI period.
- InpRSIOverbought — the level above which RSI is considered "overbought."
- InpRSIOversold — the level below which RSI is considered "oversold."
===== VOLATILITY SETTINGS =====
- InpATRPeriod — ATR period used for current volatility and the reference average.
- InpVolLowRatio — if current ATR / average ATR is below this ratio → volatility is "LOW."
- InpVolHighRatio — if the ratio is above this level → volatility is "HIGH."
===== CHANNEL / SWING RANGE SETTINGS =====
- InpSwingLookback — number of historical bars used to calculate the channel's highest high / lowest low.
- InpBreakoutBufferPoints — a buffer (in points) above/below the channel edges, to avoid false breakout signals from a minor wick.
- InpDrawChannelLines — turns drawing of the channel's horizontal lines on the chart on/off.
- InpChannelLineStyle — the line style (solid, dashed, etc.).
- InpChannelLineWidth — line thickness (1-5).
- InpChannelHighColor — color of the line marking the top of the channel.
- InpChannelLowColor — color of the line marking the bottom of the channel.
===== DAILY RANGE SETTINGS =====
- InpADRPeriod — number of days used to calculate the ADR (Average Daily Range) average.
===== SPREAD THRESHOLDS (POINTS) =====
- InpSpreadLowMax — maximum spread (in points) below which the spread is classified "LOW" (green).
- InpSpreadNormalMax — maximum spread below which it's classified "NORMAL" (white); above this it becomes "WIDE" (orange, warning).
===== REFRESH =====
- InpTimerSeconds — the interval (in seconds) at which the panel recalculates and refreshes its data.
A few real-trading methods using this dashboard
- HTF trend + channel breakout confluence
Enter long only when: TREND (HTF) = BULLISH, breakout status = "BULLISH BREAKOUT," and RSI is not already OVERBOUGHT. Mirror the logic for short. This filters out breakouts that go against the bigger trend. - Volatility filter for breakouts
Ignore a "BULLISH/BEARISH BREAKOUT" if VOLATILITY = LOW (the move is likely weak/false). Act on breakouts only when volatility is NORMAL or HIGH — confirming there's real energy behind the move. - Risk management with ADR
If ADR USED is already above ~80-90%, avoid taking a new trend-following trade in the same direction as today's move (high probability of exhaustion/reversal); you could instead look for reversal or range-trading setups. Also use the remaining ADR percentage to set realistic take-profit levels (don't ask the market for more than the typical daily move allows). - Spread-based execution filter
Don't open positions (especially scalping) when SPREAD = WIDE — this usually happens during major news or outside liquid hours; the transaction cost can wipe out the statistical edge of the setup. - Trading on the combined bias score
Use the BREAKOUT BIAS label (BUY SETUP / SELL SETUP / WAIT) directly as a "first-level" entry filter: only manually trade when the bias is clear (BUY/SELL SETUP), and stay out of new positions when the state is WAIT or MARKET CLOSED — this reduces low-quality, impulse-driven trades. - RSI vs. trend divergence for mean-reversion
When the trend (current + HTF) is BULLISH but RSI shows OVERSOLD, this can indicate a pullback/correction within the trend — a "buy the dip" opportunity rather than a short. The dashboard shows you this combination instantly, without watching every bar on the chart.
Note: these are technical-analysis methods, not personalized investment advice — any strategy should be tested on a demo account/backtest before being used with real capital, and risk decisions (position size, SL/TP) remain the trader's responsibility.
 MT5 Cash Risk Probe - Read-Only Sizing
Read-only MT5 script that estimates stop-distance cash loss in account currency, reserves explicit cash costs and floors volume to the broker grid. It never sends or modifies an order.
XAUUSD MTF Liquidity OB Reversal Breakout
XAUUSD MTF Liquidity & Order Block Reversal Strategy A professional Smart Money Concepts (SMC) based MT5 indicator designed primarily for **XAUUSD (Gold)**. The strategy combines multi-timeframe liquidity, order blocks, liquidity sweeps, breakout/reversal confirmation, and M1 swing-based risk management to identify high-probability BUY and SELL opportunities. Strategy Features Multi-Timeframe Liquidity Detection The indicator identifies important liquidity and order-block levels from: * Best Day-wise Liquidity * H4 Liquidity & Order Blocks * M30 Liquidity & Order Blocks * M15 Liquidity & Order Blocks * M5 Liquidity & Order Blocks The strongest day-wise liquidity replaces simple Previous Day High/Low logic and searches historical daily candles for significant liquidity concentrations.
News Trading Dashboard
News Trading Dashboard is an informational on-chart panel (it does not trade automatically) that monitors market volatility in real time to detect "news spike" moments — the sudden price moves that occur when economic data is released (NFP, CPI, interest rate decisions, etc.).
Day Trader Dashboard
The Day Trader Dashboard is a Bloomberg-style visual panel for MetaTrader 5 that tracks an intraday price range and flags when price is inside it (fade zone) or has broken out of it. It doesn't place trades — it's a decision-support overlay that computes the range High/Low from recent bars, draws those levels directly on the chart, and shows a live status readout (scanning / within range / breakout) in a themed, auto-scaling panel. It supports multiple independent instances on the same chart, several color themes, and cleans up 100% of its objects when removed.