 MetaTrader 5
 Uzmanlar
 Göstergeler
 Komut dosyaları
 Kütüphaneler
 Depo
Depo
Fan sayfamıza katılın

Day Trader Dashboard - MetaTrader 5 için gösterge

- Görüntülemeler:
- 13
- Yayınlandı:
- Güncellendi:
-
 Alım-satım fırsatlarını kaçırıyorsunuz:
- Ücretsiz alım-satım uygulamaları
- İşlem kopyalama için 8.000'den fazla sinyal
- Finansal piyasaları keşfetmek için ekonomik haberler
Kayıt Giriş yapWeb sitesi politikasını ve kullanım şartlarını kabul edersiniz
Hesabınız yoksa, lütfen kaydolun -
 Bu koda dayalı bir robota veya göstergeye mi ihtiyacınız var? Freelance üzerinden sipariş edin
Freelance'e git
Bu koda dayalı bir robota veya göstergeye mi ihtiyacınız var? Freelance üzerinden sipariş edin
Freelance'e git
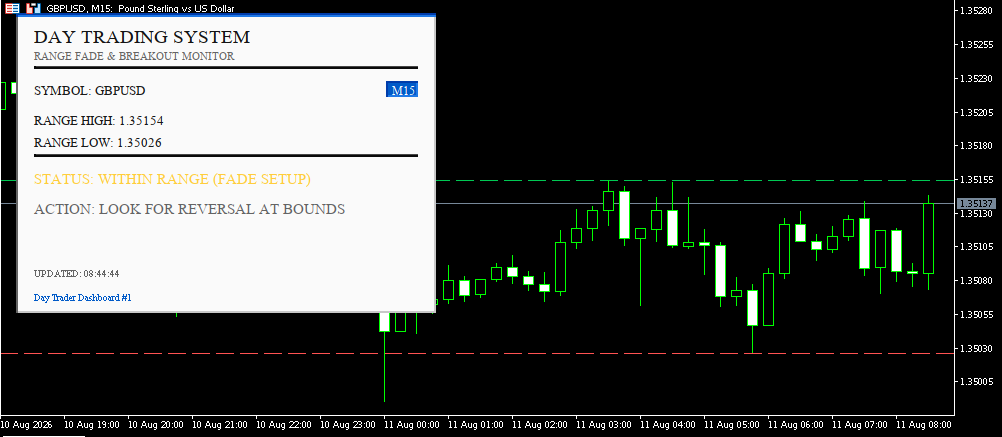
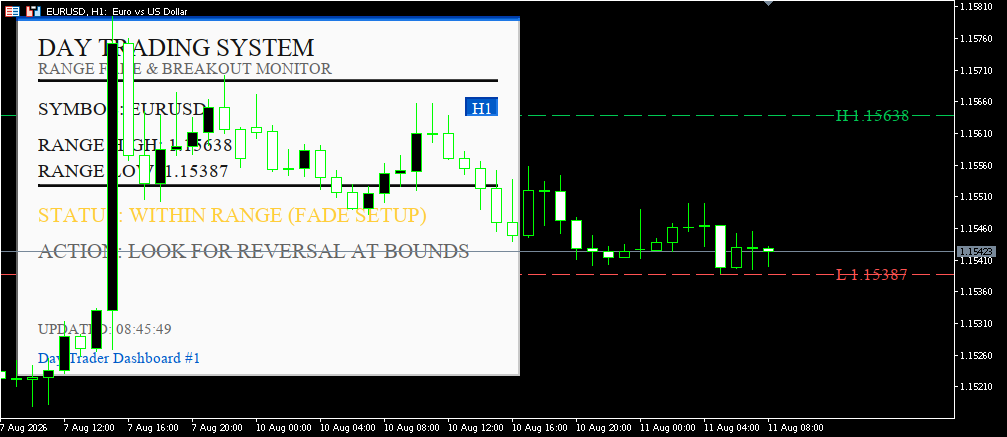
Gerçek zamanlı işlemlerde nasıl yardımcı olur?
Manuel aralık çizme ihtiyacını ortadan kaldırır: Her seansta gözle tahmin etmek veya Yüksek/Düşük çizgilerini manuel olarak çizmek yerine, panel bunları yapılandırılabilir bir geriye dönük dönemden otomatik olarak hesaplar ve grafiğe işler.
Anında piyasa durumu okuma: Bir bakışta fiyatın aralık içinde konsolide olup olmadığını (fade fırsatı) veya aralığı kırıp kırmadığını (momentum fırsatı) anlarsınız — ham mum çubuklarını yorumlamanıza gerek kalmaz.
Grafikte görsel teyit: Yüksek/Düşük çizgileri ve isteğe bağlı fiyat etiketleri sayesinde panel metnine sürekli bakmanıza gerek kalmaz — seviyeler, fiyat hareketinin gerçekleştiği yerde görünür.
Çoklu zaman dilimi bağlamı: farklı geriye dönük dönemlere/zaman dilimlerine sahip birkaç örneği aynı anda çalıştırabileceğinizden, grafikler arasında geçiş yapmadan farklı zaman dilimlerinde kurulumları doğrulayabilirsiniz.
Hafif ve kararlı: Güncellemeler, ağır yeniden hesaplama yapılmadan bir zamanlayıcıyla (her tikte değil) çalışır; bu sayede bir seans boyunca sürekli çalışsa bile terminali yavaşlatmaz.
Giriş açıklamaları
Giriş Ne işe yarar
Örnek Kimliği Panelin her bir kopyasını tanımlar; istenen kimlik grafikte zaten kullanılıyorsa, gösterge otomatik olarak bir sonraki boş kimliği atar
Aralık geriye dönük aralık (çubuklar) Aralığın En Yüksek ve En Düşük değerlerini hesaplamak için kullanılan geçmiş çubuk sayısı
Kırılma onayı tamponu (puan) Gerçek bir kırılma olarak sayılabilmesi için fiyatın aralığı kaç puan aşması gerektiği (gürültüyü/yanlış kırılmaları filtreler)
Panel yenileme aralığı Panel verilerinin ne sıklıkta (saniye cinsinden) güncellendiği
Renk teması Açılır menüden seçilen görsel tema (6 ön ayar)
Temel metin boyutu Panel için temel yazı tipi boyutu
Paneli otomatik olarak ölçekle Paneli, en uzun metin dizesine sığacak şekilde otomatik olarak yeniden boyutlandırır
Ek ölçek çarpanı Otomatik ölçeklendirmeye ek olarak manuel ölçeklendirme faktörü
Paneli göster Paneli gösterir/gizler
Panel köşesi Bağlantı köşesi: Sol Üst, Sağ Üst, Sol Alt, Sağ Alt
Yatay/Dikey kaydırma Seçilen köşeden piksel cinsinden uzaklık
Grafiğe aralık çizgileri çiz Fiyat grafiğindeki Yüksek/Düşük yatay çizgilerini açar/kapatır
Aralık çizgisi stili Düz / Noktalı / Nokta / Nokta-Çizgi
Aralık çizgisi genişliği Aralık çizgilerinin kalınlığı
Yüzen fiyat etiketlerini göster Her aralık çizgisinin yanına fiyat değerini gösterir
Birkaç gerçek işlem yöntemi
Aralığı aşma — durum "ARALIK İÇİNDE" olarak gösterildiğinde: fiyatın grafikteki Yüksek veya Düşük çizgisine ulaşmasını bekleyin, bir reddedilme sinyali (pin bar, uzun fitil) arayın, ardından çizginin hemen ötesine bir stop yerleştirerek aralığın ortasına doğru işlem yapın.
Kırılma ile işlem yapın — durum "BULLISH/BEARISH BREAKOUT"a döndüğünde: onaydan hemen sonra kırılma yönünde pozisyona girin (tampon, küçük yanlış kırılmaları filtreler), stop emrinizi kırılan aralık seviyesinin içine yerleştirin.
Açılış Aralığı Kırılması (ORB) — açılış aralığını tanımlamak için seansın açılışında küçük bir geriye dönük aralık (10–15 çubuk) ayarlayın; bu aralıktan ilk teyit edilen kırılma, genellikle günün yönü için güçlü bir sinyaldir.
Çoklu zaman dilimi kesişimi — farklı kimlik numaralarına sahip iki örnek çalıştırın: biri günlük aralık için H1'de, diğeri kısa vadeli aralıklar için M15'te; yalnızca her ikisi de aynı yönde bir kırılma gösterdiğinde pozisyona girin.
MetaQuotes Ltd tarafından İngilizceden çevrilmiştir.
Orijinal kod: https://www.mql5.com/en/code/75993
FX Dashboard
Bu, MT5 grafiği üzerinde yer alan bir FX Dashboard tarzı terminal paneli ve grafiğe çizilmiş çizgilerdir (EMA, Bollinger, Donchian).
 GDS Renko Momentum Demo EA
This educational Expert Advisor demonstrates one simple way to trade momentum on Renko bricks in MetaTrader 5. Momentum is the difference between the latest completed Renko close and the close N bricks earlier, divided by the brick size. A crossing above the positive threshold produces a BUY signal; a crossing below the negative threshold produces a SELL signal. Staying beyond a threshold does not generate repeated signals. The EA builds classic fixed-size Renko internally from Bid ticks, with a two-brick reversal. Orders use the available market Bid/Ask rather than synthetic brick prices. If several bricks form on one tick, only a crossing on the final brick can trigger entry. There is one position at a time, with virtual take profit, virtual stop loss, a maximum holding time, a cooldown and a spread filter. No external indicator, DLL, custom symbol or offline chart is required.
EA AurumNeuro Vanguard
AurumNeuro Vanguard is an intelligent Expert Advisor (EA) specifically designed for XAUUSD / Gold trading, combining a hybrid Neural Risk Architecture with the Unified Market Dynamics Engine (UMDE).
ZetaBurst Scalper EA
Tick-driven scalper that only trades genuine statistical outlier price moves, sized and protected to survive real broker execution delay. Backtest results included below.