Fan sayfamıza katılın

3TF_RSI_Average - MetaTrader 5 için gösterge
- Görüntülemeler:
- 7638
- Derecelendirme:
- Yayınlandı:
-
 Alım-satım fırsatlarını kaçırıyorsunuz:
- Ücretsiz alım-satım uygulamaları
- İşlem kopyalama için 8.000'den fazla sinyal
- Finansal piyasaları keşfetmek için ekonomik haberler
Kayıt Giriş yapWeb sitesi politikasını ve kullanım şartlarını kabul edersiniz
Hesabınız yoksa, lütfen kaydolun -
 Bu koda dayalı bir robota veya göstergeye mi ihtiyacınız var? Freelance üzerinden sipariş edin
Freelance'e git
Bu koda dayalı bir robota veya göstergeye mi ihtiyacınız var? Freelance üzerinden sipariş edin
Freelance'e git
'Three timeframes RSI Average' displays in a separate window three Relative Strength Index indicator of the specified timeframes, as well as their average value.
It has ten input parameters:
- RSI period - RSI calculation period
- Overbought - overbought level
- Oversold - oversold level
- Drawing mode - indicator drawing type
- Steps - as a ladder
- Slope - sloping lines
- First RSI timeframe - the timeframe of the first RSI
- Second RSI timeframe - the timeframe of the second RSI
- Third RSI timeframe - the timeframe of the third RSI
- Show first RSI - show the first RSI indicator
- Show second RSI - show the second RSI indicator
- Show third RSI - show the third RSI indicator
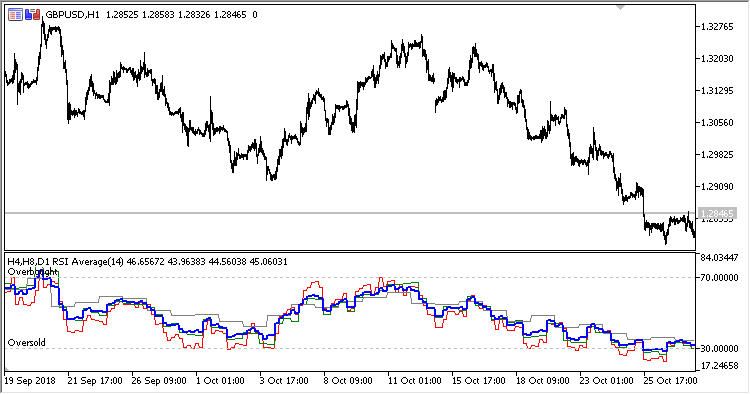
Fig.1. Three timeframes RSI Average, H4, H8 and D1 data on the H1 chart, Drawing mode = Steps
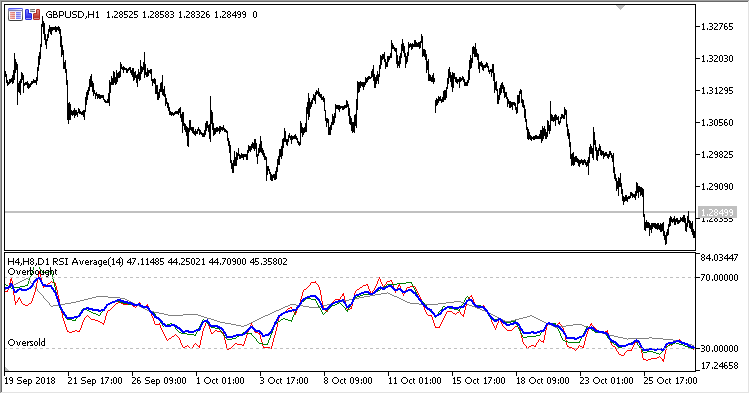
Fig. 2. Three timeframes RSI Average, H4, H8 and D1 data on the H1 chart, Drawing mode = Slope
MetaQuotes Ltd tarafından Rusçadan çevrilmiştir.
Orijinal kod: https://www.mql5.com/ru/code/23317
3TF_Stochastic_Average
The Three timeframes Stochastic Average indicator
Tymen_STARC_Bands
The Tymen STARC Bands indicator
 Dynamic averaging
The EA implements averaging of positions. The average iStdDev is calculated in a sliding window.
ColorRSI_X20_Cloud_HTF
The ColorRSI_X20_Cloud indicator with the possibility to change the indicator timeframe using input parameters