Fan sayfamıza katılın

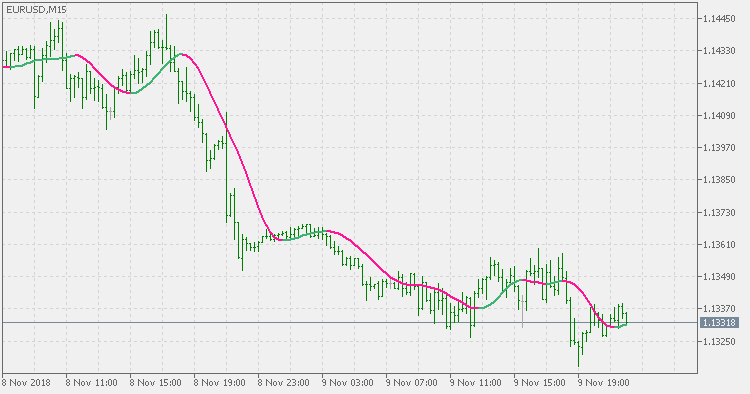
Triangular moving average - MetaTrader 5 için gösterge

- Görüntülemeler:
- 17275
- Derecelendirme:
- Yayınlandı:
- Güncellendi:
-
 Alım-satım fırsatlarını kaçırıyorsunuz:
- Ücretsiz alım-satım uygulamaları
- İşlem kopyalama için 8.000'den fazla sinyal
- Finansal piyasaları keşfetmek için ekonomik haberler
Kayıt Giriş yapWeb sitesi politikasını ve kullanım şartlarını kabul edersiniz
Hesabınız yoksa, lütfen kaydolun -
 Bu koda dayalı bir robota veya göstergeye mi ihtiyacınız var? Freelance üzerinden sipariş edin
Freelance'e git
Bu koda dayalı bir robota veya göstergeye mi ihtiyacınız var? Freelance üzerinden sipariş edin
Freelance'e git
Theory:
Triangular moving average is a sort of a weighted moving average that is known for very smooth results. The weights in the triangular moving average are adding more weight to central values of the averaged data. Hence the coefficients are specifically distributed. Some of the examples that can give a clear picture of the coefficients progression:
period 1 : 1
period 2 : 1 1
period 3 : 1 2 1
period 4 : 1 2 2 1
period 5 : 1 2 3 2 1
period 6 : 1 2 3 3 2 1
period 7 : 1 2 3 4 3 2 1
period 8 : 1 2 3 4 4 3 2 1
period 9 : 1 2 3 4 5 4 3 2 1
and so on and on ...
There are several implementations and definitions of the triangular moving average. Some are accurate and some are not (the "not accurate" never realized that you can not have same average value for odd and even period). Some are actually a funny interpretation of what has been talked about triangular moving average over and over. The accurate methods mainly lack only one thing : they are looped over and over and for longer periods the execution speed becomes critical.
This version:
Solves the execution speed while producing accurate results (there are no same average values for odd and even periods :))
Usage:
You can use the color change as signal. Be advised that, unlike the many that are mixing centered TMA with the TMA, this is not the centered TMA and it does not recalculate / repaint.
Ehlers Fisher transform (original)
Ehlers Fisher transform (as originally described in the book)
Channel design indicator
A channel is a trading range between support and resistance levels that a stock price oscillates in for a period of time. This indicator draws the resistance and support lines based on the peaks and valleys that are found within a defined period of time.
Filtered price
Filtered price using self adjusting deviation for price filtering
Filtered averages
Filtered averages