Fan sayfamıza katılın

RSX range expansion index - with floating levels - MetaTrader 5 için gösterge

- Görüntülemeler:
- 4994
- Derecelendirme:
- Yayınlandı:
-
 Alım-satım fırsatlarını kaçırıyorsunuz:
- Ücretsiz alım-satım uygulamaları
- İşlem kopyalama için 8.000'den fazla sinyal
- Finansal piyasaları keşfetmek için ekonomik haberler
Kayıt Giriş yapWeb sitesi politikasını ve kullanım şartlarını kabul edersiniz
Hesabınız yoksa, lütfen kaydolun -
 Bu koda dayalı bir robota veya göstergeye mi ihtiyacınız var? Freelance üzerinden sipariş edin
Freelance'e git
Bu koda dayalı bir robota veya göstergeye mi ihtiyacınız var? Freelance üzerinden sipariş edin
Freelance'e git
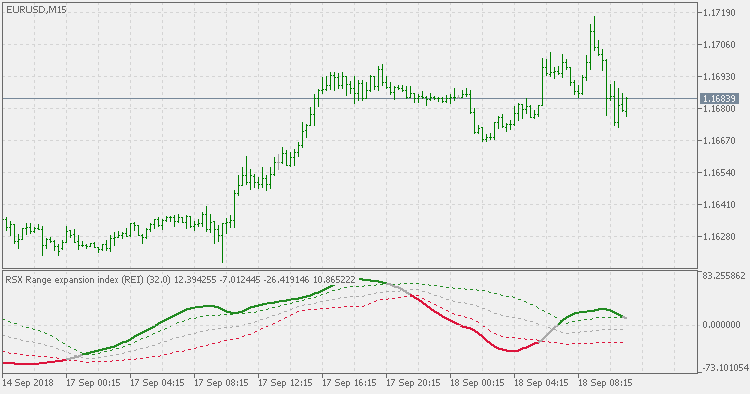
Range Expansion Index (REI) definition :
Range Expansion Index (REI) is an
oscillator that measures price changing rate and signals about
overbought/oversold areas, in case a price shows weakness or strength.
It was developed by Thomas DeMark and described in his book "The New Science of Technical Analysis".
The indicator values change from -100 up to +100. REI is an enhanced oscillator, as it stays neutral during a flat and shows trends only when considerable top or bottom have been reached.
This version :
This version is made according to Mark Jurik's idea : according to him, REI can be made as rsx(high) + rsx(low) - and the result should be much smoother. So, this version is doing exactly that. Also, this version is adding floating levels in order to make the trend changes spotting easier. You have an option to chose between two color changing modes :
- color change when outer levels are crossed
- color change when middle level (a sort of a "zero line") is crossed
Usage :
In this version use color changes change as potential trend start and end signals
RSX range expansion index - with confidence bands
RSX range expansion index - with confidence bands
Volatility Indicator
Great indicator for Time series analysis as shows stationary properties. Indicator calculates the difference between a 14 period Double exponential moving average and price closes. Great to help identify unusual price activity.