Fan sayfamıza katılın

Step chart of RSI - MetaTrader 5 için gösterge

- Görüntülemeler:
- 5643
- Derecelendirme:
- Yayınlandı:
- Güncellendi:
-
 Alım-satım fırsatlarını kaçırıyorsunuz:
- Ücretsiz alım-satım uygulamaları
- İşlem kopyalama için 8.000'den fazla sinyal
- Finansal piyasaları keşfetmek için ekonomik haberler
Kayıt Giriş yapWeb sitesi politikasını ve kullanım şartlarını kabul edersiniz
Hesabınız yoksa, lütfen kaydolun -
 Bu koda dayalı bir robota veya göstergeye mi ihtiyacınız var? Freelance üzerinden sipariş edin
Freelance'e git
Bu koda dayalı bir robota veya göstergeye mi ihtiyacınız var? Freelance üzerinden sipariş edin
Freelance'e git
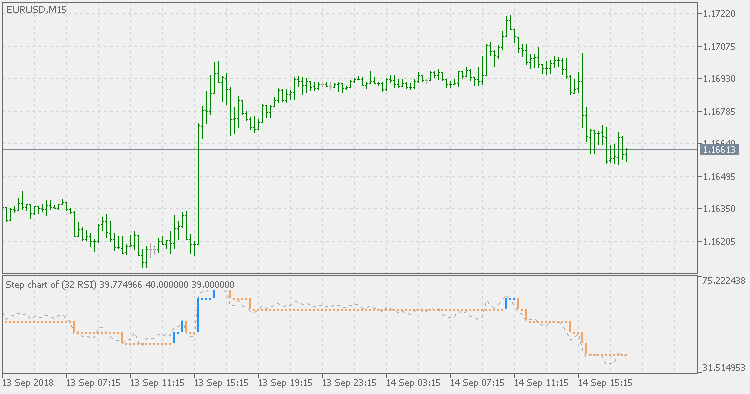
Basics :
RSI (Relative Strength Index) is well known and is widely used. Sometimes it is used in a combination of some filtering method in order to avoid some of the false signals that RSI might produce in some market conditions. This is one more version that will attempt to address the issue by using a filter on RSI
This version :
This version is using step chart as a filter to lessen the number of signals produced by RSI and (if possible) to make it easier and safer to use. The step size is to be entered in % of RSI that you wish to be used as a filter for minimal RSI change that should be considered as a significant change
Usage :
Use color change of the step bar as signals
Step chart of averages
Step chart of averages
 Support and Resistance Trader
Expert adviser scans past 500 closing bars and looks for common closing regions as entries.