Fan sayfamıza katılın

RSI adaptive EMA ribbon - MetaTrader 5 için gösterge

- Görüntülemeler:
- 7346
- Derecelendirme:
- Yayınlandı:
- Güncellendi:
-
 Alım-satım fırsatlarını kaçırıyorsunuz:
- Ücretsiz alım-satım uygulamaları
- İşlem kopyalama için 8.000'den fazla sinyal
- Finansal piyasaları keşfetmek için ekonomik haberler
Kayıt Giriş yapWeb sitesi politikasını ve kullanım şartlarını kabul edersiniz
Hesabınız yoksa, lütfen kaydolun -
 Bu koda dayalı bir robota veya göstergeye mi ihtiyacınız var? Freelance üzerinden sipariş edin
Freelance'e git
Bu koda dayalı bir robota veya göstergeye mi ihtiyacınız var? Freelance üzerinden sipariş edin
Freelance'e git
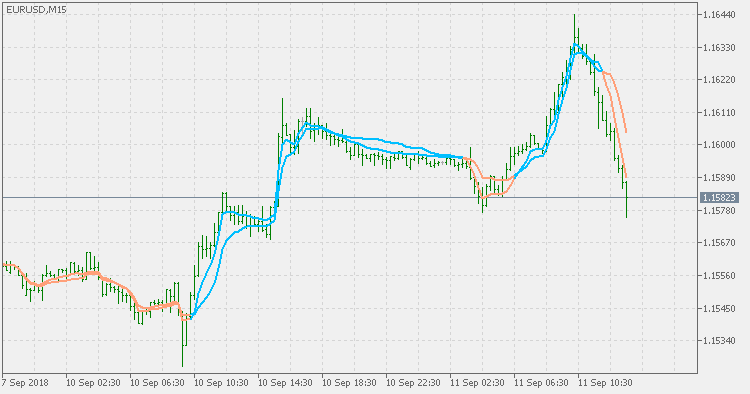
The background :
This indicator is using the RSI adaptive EMA (originally published here : RSI adaptive EMA) to assess the market condition. Even though it can be translated (and was done so) to a MACD, the on-chart representation of what is used for MACD calculation can help in easier spotting of possible trend changes
Of parameters :
Just the usual parameters : fast rsi period , slow rsi period and the price used. Take care that the fast is faster than the slow period - since then the results can be unpredictable (I did not add a code to check that - the assumption is that the user can do whatever she/he can do as a part of experimenting)
Usage :
Simple color change of the two values indicates a possible start of a new trend and can be used as a signal
RSI adaptive EMA - floating levels
RSI adaptive EMA - floating levels
Range Action Verification Index - extended
Range Action Verification Index - extended