Fan sayfamıza katılın

Gann high/low activator JMA - MetaTrader 5 için gösterge

- Görüntülemeler:
- 11322
- Derecelendirme:
- Yayınlandı:
-
 Alım-satım fırsatlarını kaçırıyorsunuz:
- Ücretsiz alım-satım uygulamaları
- İşlem kopyalama için 8.000'den fazla sinyal
- Finansal piyasaları keşfetmek için ekonomik haberler
Kayıt Giriş yapWeb sitesi politikasını ve kullanım şartlarını kabul edersiniz
Hesabınız yoksa, lütfen kaydolun -
 Bu koda dayalı bir robota veya göstergeye mi ihtiyacınız var? Freelance üzerinden sipariş edin
Freelance'e git
Bu koda dayalı bir robota veya göstergeye mi ihtiyacınız var? Freelance üzerinden sipariş edin
Freelance'e git
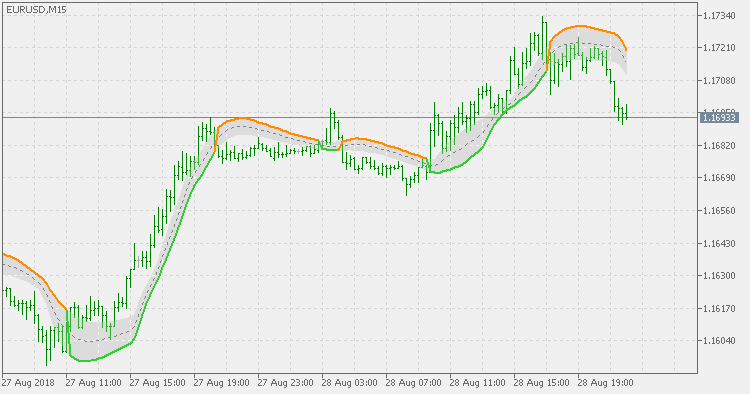
The Gann High Low Activator Indicator was described by Robert Krausz
in a 1998 issue of Stocks & Commodities Magazine. It is a simple
moving average SMA of the previous n period's highs or lows.
The indicator tracks both curves (of the highs and the lows). The close of the bar defines which of the two gets plotted.
This version is showing the channel that needs to be broken if the trend is going to be changed, and it uses the JMA for calculation (by definition, Gann High Low Activator simple moving average, but some other averages, like the well known JMA can give you results that are probably more acceptable for trading in some conditions).
DSL Balance of market power JMA
DSL Balance of market power JMA
 Trendlines and Horizontal lines crossing notification EA
Draw your horizontal and trendlines and be notified when price crosses them