Fan sayfamıza katılın
Öyleyse bir link gönderin -
başkalarının da faydalanmasını sağlayın
- Görüntülemeler:
- 6135
- Derecelendirme:
- Yayınlandı:
-
Bu koda dayalı bir robota veya göstergeye mi ihtiyacınız var? Freelance üzerinden sipariş edin Freelance'e git
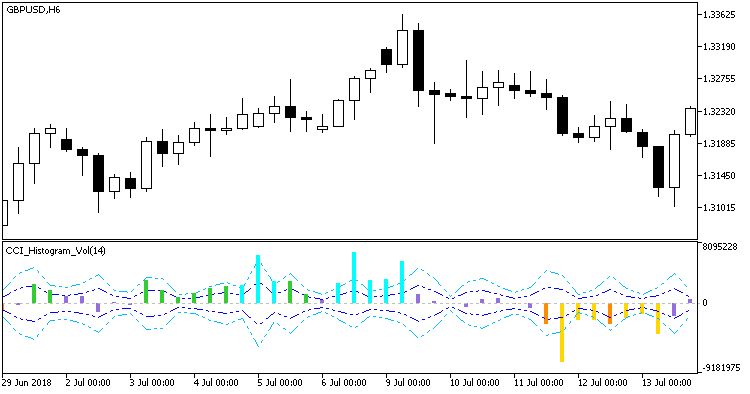
The Commodity Channel Index oscillator displayed as a color histogram, using volumes.
Calculation formula:
CCI Histogram Vol = CCI * Volume
For quite understandable reasons, the recalculation of overbought and oversold levels in such a modified oscillator should be performed using the same formula. This was implemented. In the final version, these levels are no longer permanent. Two levels with the appropriate breakout indication were used.
input int                 HighLevel2=+100;          // Overbought level 2
input int                 HighLevel1=+80;           // Overbought level 1
input int                 LowLevel1=-80;            // Oversold level 1
input int                 LowLevel2=-100;           // Oversold level 2
In the indicator input parameters, these levels are presented as the levels of the source CCI, and then multiplied by volumes at each indicator tick.

Fig. 1. The CCI_Histogram_Vol indicator
MetaQuotes Ltd tarafından Rusçadan çevrilmiştir.
Orijinal kod: https://www.mql5.com/ru/code/21833
 GD
GD
The Generalized DEMA moving average
 RSI_Histogram_Vol
The Relative Strength Index oscillator displayed as a color histogram, using volumes.