Fan sayfamıza katılın

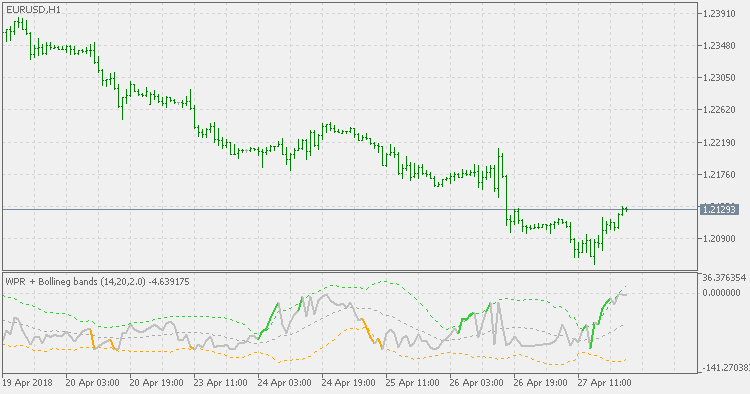
WPR with Bollinger bands - MetaTrader 5 için gösterge

- Görüntülemeler:
- 7795
- Derecelendirme:
- Yayınlandı:
-
 Alım-satım fırsatlarını kaçırıyorsunuz:
- Ücretsiz alım-satım uygulamaları
- İşlem kopyalama için 8.000'den fazla sinyal
- Finansal piyasaları keşfetmek için ekonomik haberler
Kayıt Giriş yapWeb sitesi politikasını ve kullanım şartlarını kabul edersiniz
Hesabınız yoksa, lütfen kaydolun -
 Bu koda dayalı bir robota veya göstergeye mi ihtiyacınız var? Freelance üzerinden sipariş edin
Freelance'e git
Bu koda dayalı bir robota veya göstergeye mi ihtiyacınız var? Freelance üzerinden sipariş edin
Freelance'e git
Williams %R, WPR, or just %R, is a technical analysis oscillator showing the current closing price in relation to the high and low of the past N days (for a given N). It was developed by a publisher and promoter of trading materials, Larry Williams. Its purpose is to tell whether a stock or commodity market is trading near the high or the low, or somewhere in between, of its recent trading range.
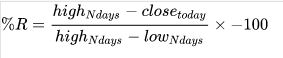
The oscillator is on a negative scale, from −100 (lowest) up to 0 (highest), obverse of the more common 0 to 100 scale found in many Technical Analysis oscillators. A value of −100 means the close today was the lowest low of the past N days, and 0 means today's close was the highest high of the past N days. (Although sometimes the %R is adjusted by adding 100.)
This version of Williams Percent Range has an addition of Bollinger bands to help identify possible overbought and oversold levels breaks.
Count Back Lines
Indicator based on the Daryl Guppy's original strategy.
Volatility Bands Percent
This is the version that David Rooke proposes as a solution to Bollinger Bands issues in a percent representation.
Dynamic Pivots
Based on the Austin Passamonte's idea, this indicator calculates intra-day pivots.
Vortex - smoothed
Vortex indicator (based on the article that was published in the January 2010 issue of TASC) with a smoothing option.