Turtle Breakout System MT4

Short description

Turtle trading system: 20/10 and 55/20 Donchian breakouts, N = ATR(20), 2N stop, skip rule, pyramiding and unit size from your account risk.

Description

Turtle Breakout System shows the classic Turtle trading rules on your chart and keeps track of them for you: the breakout levels for the next entry, the open position with its stop and exit level, the size of one unit for your account, and how the rules have done on this chart so far.

The rules follow the Turtle trading rules as they were later published by members of the original Turtle program. This indicator is an independent implementation and is not affiliated with or endorsed by the original traders or their publishers.

The rules
- System 1 (default): entry when price breaks the high or low of the last 20 bars, exit when it breaks the 10-bar low (long) or high (short). A breakout is skipped when the last breakout was a winner; the skipped breakout is still followed on paper, so the next one is taken if it would have lost.
- System 2: entry on a 55-bar breakout, exit on a 20-bar breakout, no skip rule.
- N is the 20-bar average true range (Wilder). The stop is 2N from the entry.
- Pyramiding (optional): one more unit every 1/2 N in the trade direction, up to 4 units; the stop of the whole position moves to 2N behind the last unit.
- Unit size: the number of lots for which one N equals 1 % of your equity (adjustable).
- Exit option: a fixed target in R instead of the exit channel.

On the chart
- The entry channel (20 or 55 bars) and, while a position is open, the exit channel.
- BUY / SELL labels on the breakout bar with the reason, WAIT labels on skipped breakouts, and an exit mark with the result in R.
- Entry and initial stop lines for every trade, the current stop of the open position, and the next BUY STOP / SELL STOP levels while flat.
- Added units marked +2, +3, +4 when pyramiding is on.

The panel
- The current state in large text: LONG, SHORT or WAIT.
- System, N and the 2N stop distance, the unit size in lots for your account.
- While in a trade: entry, stop now, exit level, units and the next add level.
- While flat: the next buy and sell levels and what the skip rule will do with the next breakout.
- The forming bar: whether it is breaking the channel or the exit level right now (marked as not final).
- Statistics of the past trades on this chart: number of trades, how many reached 1R before the exit, the average result in R (first unit).
- A row with the position on up to four other timeframes (default M15, H1, H4, D1).
- Any corner, size 50-300 %, dark or light.

On-chart buttons
- System 1 / System 2, skip rule, pyramiding, channels, labels, levels, alerts and the panel can be switched with buttons below the panel. Your choices are kept for each chart, also after a timeframe change or a restart of the terminal.

Alerts
- Pop-up alert and push notification on a new BUY / SELL (with the stop and the unit size), and optionally on exits and added units. Alerts come once per bar, at bar close.

About repainting
- All entry, exit and add levels come from bars that have already closed, so they are known one bar ahead. An entry or exit on a bar is final when that bar closes; once set, it does not change or move.
- In the Strategy Tester every value was recorded when its bar closed and compared with the history afterwards: no value changed and no entry appeared later.

About the statistics
- They count the trades on the bars loaded on your chart, in R of the first unit (R = the 2N stop distance at entry). Entry at the breakout level (or the open if the bar gapped through it), exit at the exit level or the stop, whichever price meets first. Spread, commission and slippage are not included.
- They describe how the rules behaved on this symbol and timeframe in the past. They are not a forecast and not a promise of any result.
- In our own tests on five markets (EURUSD, GBPUSD, USDJPY, AUDUSD, XAUUSD; H1 and H4; five years; spread included) the results were close to zero after costs: System 1 with the skip rule was around 0 R per trade, slightly positive on H4 and on gold, slightly negative on some currency pairs. Pyramiding made the results more volatile and did not improve them, so it is off by default. Use the system as a structured, rule-based reading of the chart, together with your own risk management.

Values for Expert Advisors
- Buffers 0-10 (iCustom): entry channel high and low, exit channel (short / long), BUY entry, SELL entry, exit price, entry price, initial stop, N, position (1 long, -1 short, 0 flat).

Inputs
- System, entry and exit breakout lengths of both systems, skip rule.
- Exit type (channel or fixed target), target in R, N period, stop in N.
- Pyramiding, add distance in N, maximum units, risk % of equity per N for the unit size, bars to calculate.
- Channels, colours, labels, reasons, WAIT labels, levels, label size and number.
- Panel on / off, corner, size, dark / light, timeframes, buttons.
- Alerts, push notifications, alerts on exits and added units.

The indicator does not trade. It works on any symbol and timeframe. No DLL.

Рекомендуем также
Renko, Point & Figure, Kagi and Line Break in one window, switched with a button, mirrored on the price chart with signals. ## Description Four chart types that ignore time and show only price movement, in one indicator. Switch between them with the buttons in the indicator window; the same columns are drawn on the normal price chart as boxes (or a Kagi line), with their signals as arrows, so you can see both views at once. Chart types - Renko: a brick for every box of movement, a reversal
La strategia implementata in questo indicatore è un sistema Trend Following Multi-Timeframe (H1/M15) ad alta precisione , progettato specificamente per il trading intraday . Combina l'analisi della struttura macro del mercato (su grafico a 1 ora) con l'efficacia dei pattern candlestick di inversione nel micro-trend (su grafico a 15 minuti). Ecco la scomposizione dettagliata delle regole operative utilizzate dal codice: 1. Filtro Temporale (Intraday) La strategia opera esclusivamente all'interno
FREE
Position Sizing Indicator is a chart calculator for MetaTrader 5. It tells you how many lots to trade so that a stop loss costs exactly the amount you want to risk, and it shows the reward to risk ratio of the setup. It does not open, modify or close trades. How it works - Three lines appear on the chart: Entry, Stop and Target. Press and drag any of them with the mouse, no double-click needed. - Dragging Entry moves the whole setup. Dragging Stop changes the stop distance. Dragging Target cha
Fractal Pivot Lines — Indicator Overview  Fractal Pivot Lines is a custom trend-structure indicator for MetaTrader 4 . It automatically connects key fractal highs and lows with dynamic lines so you can see how price is respecting local structure, building channels, and preparing for potential reversals. Instead of staring at dozens of candles and guessing where the real pivots are, the indicator turns fractals into clear support/resistance paths and trend channels . What the Indicator Does C
Индикатор Crypto_Forex "Auto FIBO Pro" - отличный вспомогательный инструмент в торговле! - Индикатор автоматически рассчитывает и размещает на графике уровни Фибоначчи и локальные линии тренда (красного цвета). - Уровни Фибоначчи указывают ключевые области, где цена может развернуться. - Наиболее важными уровнями являются 23,6%, 38,2%, 50% и 61,8%. - Вы можете использовать его для скальпинга на разворот или для торговли по зональной сетке. - Существует множество возможностей улучшить вашу текущ
Rainbow Price Visualizer v1.21 See where the market really breathes. Turns your MT4 chart into an ultra-precise heatmap that highlights price zones favored by big players. Why it matters 300 price levels at 0.2‑pip resolution — microscopic detail. 8 visual themes (Rainbow, Fire, Ocean…) for instant readibility. Smart opacity: low noise fades, real zones pop. Lightweight rendering with automatic cleanup. Fully customizable: saturation, opacity, resolution, history depth. Bands project into the f
The   Trendlines Oscillator   helps traders identify trends and momentum based on the normalized distances between the current price and the most recently detected bullish and bearish trend lines. The indicator features bullish and bearish momentum, a signal line with crossings, and multiple smoothing options. USAGE The   Trendlines Oscillator   works by systematically: Identifying pivot highs and lows. Connecting pivots to form bullish (support) and bearish (resistance) trendlines. Measuring
The MTF Trend Dashboard indicator is a visual technical analysis tool designed for MetaTrader 4 that centralizes the trend status of all timeframes into a single separate window below the main chart. Instead of forcing you to constantly switch charts (from M5 to H4, D1, etc.) to check the macro trend, the indicator calculates real-time crossovers and maps the situation as a graphical matrix of colored bars. Here is a detailed description of its operation and structure: Visual Structure and O
FREE
This    Nice Trade Point     indicator is designed for signal trading. This indicator generates trend signals. It uses many algorithms and indicators to generate this signal. It tries to generate a signal from the points with the highest trend potential. This indicator is a complete trading product. This indicator does not need any additional indicators. The indicator certainly does not repaint. The point at which the signal is given does not change.     Features and Suggestions Time Frame
Great Indicator
Ruben David Santana Rodriguez
Les presento un indicador que funciona como estrategia por si solo , trabaja muy bien en periodos de 4 horas pero puedes aplicarlo a cualquier timeframe , las señales son muy faciles de interpretar , en momento en que la linea naranja pasa hacia arriba las media azul y roja , se entra en largos , la operativa se mantiene abierta hasta que la linea naranja cruce la media mas cercana ya sea la azul o la roja , si la operacion era long y la linea azul cruza hacia arriba la linea roja y la naranja c
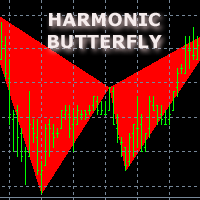
Индикатор определяет и отображает на графике паттерн М. Гартли "Бабочка". Выделение паттерна производится по вершинам индикатора ZigZag (включен в ресурсы, не требует дополнительной установки). В момент распознавания паттерна выводится сообщение во всплывающем окне, отправляются оповещения на мобильное устройство и электронный почтовый ящик. Схема паттерна и параметры волн приведены на скриншоте. Параметры, заданные в индикаторе по умолчанию, являются демонстрационными для увеличения количества
The MTF MA Trend indicator is an advanced model of the moving average indicator. With this indicator, you can follow the moving averge inductor in the multi time frame from a single graphical display. This indicator shows 7 different time zones on a single graphical display. This display is designed in oscillator style. It is also a new generation trend indicator. Features It can work in 7 different time zones. different color settings can be made for each time zone. each time zone has a level
Price Magnet — Индикатор зон плотности цены и уровней притяжения Price Magnet — это профессиональный аналитический инструмент, который определяет ключевые уровни поддержки и сопротивления на основе статистической плотности распределения цены (Price Density). Индикатор анализирует заданный исторический период и находит ценовые значения, на которых рынок находился дольше всего. Эти зоны выступают в роли «магнитов» — они притягивают цену или служат фундаментом для разворота. В отличие от стандартны
Trend PA
Mikhail Nazarenko
5 (3)
Индикатор Trend PA для определения тренда использует  Price Action  и собственный алгоритм фильтрации. Такой подход помогает точно определять точки входа и текущий тренд на любом таймфрейме. Индикатор использует собственный алгоритм анализа изменения цены и Price Action. Что дает Вам преимущество без задержек распознать новый зарождающийся тренд с меньшим количеством ложных срабатываний. Условия фильтрации тренда можно подобрать в настройках индивидуально под Ваш стиль торговли. Индикатор отмеча
HTF Filtered Momentum Band is a trend indicator with three layers that each answer one question. The background says which way the H4 trend points. The band says whether momentum on your own chart agrees. The arrows say when a short-term trend has just turned. And out of the box, the arrows stay quiet whenever they disagree with H4. That last part is why it exists. Most multi-timeframe tools paint the higher timeframe's colour on your chart and then print arrows that ignore it completely. So you
отлично работает по тренде идеально подойдет для трейдеров которые торгуют по системе скальпинга . это стрелочный индикатор. как заключать сделки. когда появилась синяя точны нужно открывать сделку на повышение на 1 свечу если таймфрейм м1 то на 1 минунуту и т.д.. если появилась красная точка стоит заключить сделку на понижение на 1 свечу. сигналы индикатора появляются вместе новой свечей рабочая свеча та на которой располагаетса сигнал.
Short description Planetary cycle composite from the real positions of the Moon, Sun and planets, projected into the future with its next peaks and troughs. Description Astro Composite turns the positions of the Moon, the Sun and the planets into one cycle line in a separate window. The positions are calculated in the indicator itself from orbital elements, so the line follows the real sky: the Moon line peaks at the real new Moon, Mercury at its real conjunction with the Sun, and so on. Beca
Данный индикатор является бесспорным лидером среди индикаторов. И для этого утверждения есть веская причина. Индикатор строит очень качественный канал в котором формирует сигналы на вход! Что является идеальной стратегией для трейдера, поскольку трейдер всегда колеблется при выборе стратегии для работы. То есть данный индикатор позволит вам решить дилемму выбора работы по тренду или в канал, поскольку совмещает эти две основные концепции. Работа с индикатором очень проста - вы просто реагируете
Суть данного индикатора - анализ и предсказание котировок с помощью преобразования Фурье. Индикатор раскладывает ряд цен на гармоники и вычисляет их продукт на следующих барах. Вы можете использовать индикатор как самостоятельный продукт, однако для улучшения качества предсказания создан другой, родственный индикатор -  FreqoMaster  - который вызывает FreqoMeterForecast в качестве движка и объединяет результаты работы нескольких экземпляров FreqoMeterForecast для различных частотных диапазонов.
Этот индикатор можно считать логическим продолжением широко известного индикатора равноудаленного канала: https://www.mql5.com/ru/market/product/8723 . Основное назначение индикатора — это визуализация уровней цены относительно параллельного канала с помощью уровней Фибоначчи Бобокус в отдельном окне с использованием истории цен. Это дает возможность во многих случаях спрогнозировать направление будущего движения цены с достаточно высокой степенью вероятности. Формула вычисления уровней Фибоначч
NQX Session Range Breakout MT4 — сигнальный индикатор для MetaTrader 4: пробой ночного диапазона на европейском открытии. Собственная логика NQX, которая определяет спокойный ночной диапазон и подаёт сигнал при первом уверенном закрытии за его пределами в европейское окно. Индикатор отображает предлагаемую точку входа, короткий стоп и дальние цели (3:1, 5:1, 10:1); решение принимаете вы. Что отображается на графике - Стрелка на закрытой сигнальной свече (закрытый сигнал никогда не перерисовывает
Индикатор показывает потенциальный направление тренда по циклично-волновой зависимости. Таким образом, все лучи пересечения будут оптимальными лучами, в направлении которых ожидается движение цены с учетом периода индикатора. Лучи можно использовать как направление потенциального движения рынка. Но не надо забывать, что подход должен быть комплексным, сигналы индикатора требуют дополнительной информации для входа в рынок.
Американские трейдеры говорят: «Trend is your friend», – что в переводе означает «Тренд – Ваш друг». И это действительно так! Торгуя по тренду, Вы уменьшаете свои риски и получаете преимущество, так как повышаете математическое ожидание от совершенных сделок и, следовательно, зарабатываете больше прибыли. Вместе с индикатором « Going straight » Вы будете торговать по тренду с легкостью! Это один из самых эффективных способов работы с рыночными трендами. Торговые стратегии, использующие индикат
Short description Polymarket prediction-market odds on the chart: the price range the market prices in for crypto, gold, S&P 500 and oil, and the next Fed decision. Description Polymarket Odds Overlay reads the public prices of the Polymarket prediction markets and draws them on your chart. A prediction-market price is a probability: when "Bitcoin above 62,000 on Friday" trades at 0.30, the market gives it 30 %. The utility collects these prices for the symbol on the chart and turns them int
One panel, 28 pairs, 6 timeframes, 12 indicators: a colour-coded heat map of trend and momentum states. Click a cell to open that chart. Description Multi Indicator Heat Map shows how one indicator reads across many symbols and timeframes at the same time. Each row is a symbol, each column a timeframe, and every cell is coloured on a five-step scale: strong up, weak up, neutral, weak down, strong down. A sum column adds the timeframes together for each symbol. You choose the indicator on the pan
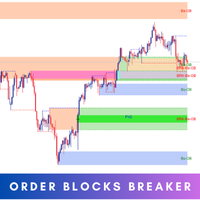
Introducing Order Blocks Breaker , a brand-new way to identify and leverage order blocks in your trading strategy. After developing multiple order block tools with unique concepts, I’m proud to present this tool that takes things to the next level. Unlike previous tools, Order Blocks Breaker not only identifies order blocks but also highlights Breaker Order Blocks —key areas where the price is likely to retest after a breakout. MT5 -  https://www.mql5.com/en/market/product/124102/ This tool inco
SnR Fresh Unfresh Level MT4 by RWBTradeLab A clean, non-repainting Support & Resistance level tracker for MetaTrader 4 that shows you the ONE thing most level indicators hide: which levels are still FRESH (untested) and which are already UNFRESH (rejected). Every level is tracked live, state by state, from CLOSED candles only. What This Indicator Does The indicator creates SnR levels from 2-candle sequences and then tracks each level's state continuously: Level Creation (Level = 1st candle
FREE
Индикатор определяет и отображает на графике гармоничный паттерн 3 Движения (3 Drives), согласно схеме, приведенной на скриншоте. Выделение паттерна производится по вершинам индикатора ZigZag (включен в ресурсы, не требует дополнительной установки). В момент распознавания паттерна выводится сообщение во всплывающем окне, отправляются оповещения на мобильное устройство и электронный почтовый ящик. Индикатор выделяет не только завершенную фигуру, но и момент ее формирования. На этапе формирования
Fractals of any size, set with a mouse slider: fractal trend, support and resistance cloud, trend-coloured candles and alerts. The classic fractal needs two bars on each side. Advanced Fractal lets you choose the size: with 2 bars per side you get the usual 5-bar fractals, with 5 or 10 bars per side only the swing points that matter on your timeframe remain. How it works - An up fractal is a bar whose high is not exceeded by the N bars before it and the N bars after it; a down fractal is the s
Индикатор отображает на графике данные стохастик-осцилятора более старшего временного интервала. Основная и сигнальная линии отображаются в дополнительном окне. Ступенчатая характеристика не сглажена. Индикатор удобен для отработки "ручных" стратегий форекс-торговли, использующих данные от нескольких экранов с различными временными интервалами одного инструмента. В индикаторе используются настройки, аналогичные стандартному и выпадающий список для выбора тайм-фрейма. Параметры индикатора TimeFr
С этим продуктом покупают
Currency Strength Wizard — очень мощный индикатор, предоставляющий вам комплексное решение для успешной торговли. Индикатор рассчитывает силу той или иной форекс-пары, используя данные всех валют на нескольких тайм фреймах. Эти данные представлены в виде простых в использовании индексов валют и линий силы валют, которые вы можете использовать, чтобы увидеть силу той или иной валюты. Все, что вам нужно, это прикрепить индикатор к графику, на котором вы хотите торговать, и индикатор покажет вам ре
Trend SniperX MT4
Sarvarbek Abduvoxobov
5 (6)
Trend Sniper X — это мультитаймфреймовый трендовый индикатор для MetaTrader 5, который помогает трейдерам точно и четко определять направление тренда и потенциальные точки разворота. Для MT5: https://www.mql5.com/en/market/product/181101 Информация о цене: Текущая цена является промо-ценой и может измениться по мере выхода новых обновлений и функций. Канал Code2Profit Освойте рынок с помощью мультитаймфреймового анализа! Как максимизировать процент побед с Trend Sniper X: ключевые правила и сове
M1 Sniper
Oleg Rodin
4.97 (30)
M1 SNIPER — это простая в использовании торговая система. Это стрелочный индикатор, разработанный для тайм фрейма M1. Индикатор можно использовать как отдельную систему для скальпинга на тайм фрейме M1, а также как часть вашей существующей торговой системы. Хотя эта торговая система была разработана специально для торговли на M1, ее можно использовать и с другими тайм фреймами. Первоначально я разработал этот метод для торговли XAUUSD и BTCUSD. Но я считаю этот метод полезным и для торговли на д
Smart Trend Trading System — индикатор для MetaTrader 4, который объединяет информацию о тренде, сигналы входа и выхода и ценовые уровни на одном графике. Система объединяет более 10 торговых инструментов в одном решении, включая определение тренда, зоны разворота, Smart Cloud, логику трейлинг-стопа, поддержку и сопротивление, окраску свечей, уведомления и мульти-таймфрейм анализ. Система создана, чтобы помочь вам торговать в разных рыночных условиях: Трендовые рынки: Определяйте главный тренд,
SIO Oscillator: самооптимизирующийся осциллятор дисбаланса семивариаций Купите индикатор и получите советник (EA) на его основе БЕСПЛАТНО. Большинство осцилляторов воспринимают любое движение цены одинаково. SIO разделяет давление покупателей и продавцов и измеряет дисбаланс между ними, показывая, какая сторона действительно контролирует рынок. Когда дисбаланс достигает экстремума, SIO выдаёт чёткий сигнал с уровнями входа, Stop Loss и Take Profit. Главное отличие SIO в том, что он не полагается
Liquidity Scalper System — торговая система на основе ликвидности в формате индикатора. Большинство индикаторов показывают только стрелку, а дальше трейдер сам решает, где поставить стоп, где цель и можно ли вообще доверять сигналу. Liquidity Scalper System закрывает весь цикл сделки: находит пулы ликвидности, даёт сигнал при их пробое, сразу рассчитывает Entry, Stop Loss и три цели, а на панели показывает статистику и результаты проверки на новых данных. Система сама подбирает настройки и обнов
Gann Made Easy - это профессиональная, но при этом очень простая в применении Форекс система, основанная на лучших принципах торговли по методам господина У.Д. Ганна. Индикатор дает точные BUY/SELL сигналы, включающие в себя уровни Stop Loss и Take Profit. ПОЖАЛУЙСТА, СВЯЖИТЕСЬ СО МНОЙ ПОСЛЕ ПОКУПКИ, ЧТОБЫ ПОЛУЧИТЬ ТОРГОВЫЕ ИНСТРУКЦИИ И ОТЛИЧНЫЕ ДОПОЛНИТЕЛЬНЫЕ ИНДИКАТОРЫ БЕСПЛАТНО! Вероятно вы уже не раз слышали о торговли по методам Ганна. Как правило теория Ганна отпугивает от себя не только н
Advanced Supply Demand
Bernhard Schweigert
4.91 (302)
Специальное предложение – скидка 30% Этот индикатор является уникальным, качественным и доступным инструментом для торговли, включающим в себя наши собственные разработки и новую формулу. В обновленной версии появилась возможность отображать зоны двух таймфреймов. Это означает, что вам будут доступны зоны не только на старшем ТФ, а сразу с двух таймфреймов - таймфрейма графика и старшего: отображение вложенных зон. Обновление обязательно понравится всем трейдерам, торгующим по зонам спроса и пре
Этот индикатор представляет собой индикатор автоматического волнового анализа, который идеально подходит для практической торговли! Случай... Примечание.   Я не привык использовать западные названия для классификации волн. Из-за влияния соглашения об именах Тан Лунь (Тан Чжун Шуо Дзен) я назвал основную волну   ручкой   , а вторичную полосу волн —   сегментом   Ат. в то же время сегмент имеет направление тренда. Именование   в основном является трендовым сегментом   (этот метод именования буде
В настоящее время скидка 30%! Лучшее решение для новичка или трейдера-эксперта! Эта приборная панель работает на 28 валютных парах. Он основан на 2 наших основных индикаторах (Advanced Currency Strength 28 и Advanced Currency Impulse). Он дает отличный обзор всего рынка Forex. Он показывает значения Advanced Currency Strength, скорость движения валюты и сигналы для 28 пар Forex на всех (9) таймфреймах. Представьте, как улучшится ваша торговля, когда вы сможете наблюдать за всем рынком с помощ
This is a professional chart indicator designed for traders focused on stability and clear price action. It helps filter market noise and provides clear visual entry and exit zones for your trading decisions. Price Information: The current price is promotional and is subject to change as upcoming updates and new features are released. MQL5 public channel:  CLICK HERE for MT5:  Non-repainting MT5 version Core Features: Strictly Non-Repainting: The system is built with strict non-repaint logic. W
Scalper Vault — это мощная, полноценная торговая система, созданная для трейдеров, которые стремятся к стабильным результатам в внутридневной торговле. Этот высокоточный индикатор представляет собой комплексное, самостоятельное торговое решение, обеспечивающее аналитику профессионального (институционального) уровня как для торговли на рынке Forex, так и для работы с бинарными опционами. Пожалуйста, свяжитесь со мной после покупки, чтобы получить мои торговые советы, а также отличный бонус! Исклю
Представляем ON Trade Waves Patterns Harmonic Elliot Wolfe, передовой индикатор, разработанный для обнаружения разнообразных рыночных паттернов с использованием как ручных, так и автоматизированных методов. Вот как это работает: Гармонические паттерны: Этот индикатор может определять гармонические паттерны, появляющиеся на вашем графике. Эти паттерны важны для трейдеров, практикующих теорию гармонической торговли, как это описано в книге Скотта Карни "Гармоническая Торговля том 1 и 2". Независи
RFI LEVELS PRO   определяет разворотные конструкции и ключевые зоны возврата цены, где может появляться активность крупных игроков. Индикатор помогает увидеть формирование нового тренда, определить потенциальную точку входа и заранее контролировать уровни риска и прибыли. VERSION MT5     —   Максимальный потенциал индикатора раскрывается при совместном использовании с   TREND LINES PRO . Что показывает индикатор: Разворотные конструкции и уровни, которые активируются в начале нового тренда. Поте
Zoryk Gold mt4
Reda El Koutbane
5 (4)
Скидка заканчивается через 24 часа — следующая цена $ 69 ограниченное количество копий по стартовой цене ZORYK — продвинутая сигнальная система для XAUUSD в MetaTrader 4 Вам знакомо это чувство. Вы анализируете золото, ждёте вход и наконец открываете сделку. Цена сразу начинает двигаться против вас. Вы закрываете позицию слишком рано, переносите Stop Loss или сомневаетесь несколько секунд. А затем рынок без вас достигает именно той цели, которую вы ожидали с самого начала. Проблема не всегд
ShapeRadar — индикатор классических графических паттернов ShapeRadar автоматически находит на графике классические фигуры технического анализа: двойные и тройные вершины и доньи, «голову и плечи» и её обратную версию, восходящие и нисходящие клинья, прямоугольники, треугольники, флаги и вымпелы. Когда цена закрывается за границей фигуры, индикатор рисует сам паттерн, точку входа, уровень стоп-лосса и цель, а на панели показывает сводку по всем найденным фигурам. Версия для MetaTrader 5:  https:/
PRO Renko System - это высокоточная система торговли на графиках RENKO. Система универсальна. Данная торговая система может применяться к различным торговым инструментам. Система эффективно нейтрализует так называемый рыночный шум, открывая доступ к точным разворотным сигналам. Индикатор прост в использовании и имеет лишь один параметр, отвечающий за генерацию сигналов. Вы легко можете адаптировать алгоритм к интересующему вас торговому инструменту и размеру ренко бара. Всем покупателям с удовол
SR Liquidity — это торговый индикатор, предназначенный для выявления скрытых зон, где концентрируется рыночная ликвидность и наблюдается наиболее сильная реакция цены. Эти особые зоны ликвидности выступают в качестве мощных уровней поддержки и сопротивления, предоставляя вам четкую картину того, где с наибольшей вероятностью произойдет разворот рынка. Вместо построения стандартных линий поддержки и сопротивления, индикатор SR Liquidity анализирует реальное поведение цены, выявляя зоны концентрац
Auto Optimized SpeedAngle — это система векторизации импульса институционального уровня, которая исключает подгонку под исторические данные (curve-fitting) за счет непрерывной форвард-оптимизации (Walk-Forward Optimization, WFO). Вместо того чтобы полагаться на статические входные параметры, которые теряют эффективность при смене рыночных режимов, индикатор динамически перекалибрует свои настройки, используя валидацию на вневыборочных данных (Out-of-Sample, OOS). Это гарантирует, что отображаемы
Professional Volume Profile Индикатор для MetaTrader 4, который строит горизонтальный профиль объема (Volume Profile) на графике цен. Показывает уровни с наибольшим количеством сделок, помогая находить зоны поддержки/сопротивления и оценивать баланс сил на рынке. Что показывает индикатор POC (Point of Control) — уровень с максимальным объемом торгов (красная линия). VAH / VAL (Value Area High / Low) — верхняя и нижняя границы зоны стоимости, где было совершено 70% объема (оранжевые пунктиры). Ги
Italo Volume Indicator
Italo Santana Gomes
4.92 (79)
BUY INDICATOR AND GET EA FOR FREE AS A BONUS + SOME OTHER GIFTS! ITALO VOLUME INDICATOR  is the best volume indicator ever created, and why is that? The Indicator works on all time-frames and assets, indicator built after 7 years of experience on forex and many other markets. You know many volume indicators around the internet are not complete, does not help, and it's difficult to trade, but the Italo Volume Indicator is different , the Italo Volume Indicator shows the wave volume, when market
Индикатор оценивает наиболее вероятное краткосрочное движение цены на основе сложных математических расчетов. Особенности Оценка ближайшего движения цены на таймфрейме графика и на всех старших таймфреймах; Расчет реального тренда рынка; Расчет наиболее важных уровней поддержки и сопротивления; Оповещения о зонах скопления уровней, пересечениях уровней и сменах тренда; Бережно расходует ресурсы системы: линии и панель обновляются только при изменении значения; Самонастройка: работает на любом с
Atomic Analyst — MetaTrader 4 По вопросам продукта, настройки или технической поддержки напишите мне напрямую здесь, на MQL5. Индикатор превращает сложные рыночные расчеты в простые визуальные сигналы, цветные свечи, показания тренда, уровни стоп-лосса и несколько зон тейк-профита, которые трейдеры могут быстро понять и использовать в реальных рыночных условиях. Основные варианты использования: Скальпинг и внутридневная торговля: Создан для быстрого принятия решений, четких стрелок, алертов, цв
Scalping Entry Points - ручная торговая система, которая может подстраиваться под движения цены и давать сигналы для открытия сделок без перерисовки. Направление тренда индикатор определяет центральным уровнем поддержки и сопротивления. Точечный индикатор предоставляет сигналы для входов и выходов. Подходит для ручной торговли внутри дня, скальпинга и бинарных опционов. Работает на всех тайм-фреймах и торговых инструментах. Индикатор дает несколько типов оповещений. Как использовать продукт Си
All in One package includes the  Oscillator Predictor ,  MACD Predictor ,  Thrust Scanner  and  Advanced Fibonacci  indicators which are mandatory for applying  Dinapoli  trade plans.  Please visit below links for detailed explanations of indicators. Advanced Fibonacci Indicator =>  https://www.mql5.com/en/market/product/52834 Thrust Scanner Indicator => https://www.mql5.com/en/market/product/52830 Overbought /Oversold Predictor indicator => https://www.mql5.com/en/market/product/52621 Macd P
Или (TDO), который представляет собой индекс, который измеряет скорость изменения цен, используя принцип « чистого импульса ». Когда цена ценной бумаги повышается с 10 до 15, скорость изменения цены составляет 150%, но когда она снижается с 15 до 10, скорость изменения цены составляет всего 33,3%. Вот почему индикаторы технического анализа, такие как «Скорость изменения цены» (ROC) или «Моментум», дают более высокие значения для восходящих движений цены, чем для нисходящих. TDO устраняет эту про
Quantum Imbalance Profiles   — индикатор фаз баланса и дисбаланса. Он показывает, на каких ценах рынок проторговывал объём, какая сторона доминировала внутри этой зоны и через какие уровни цена затем расширилась импульсом. Классический профиль объёма отвечает на один вопрос: где проходила торговля. Он не показывает, какая сторона доминировала на каждой цене, чем закончилась проторговка и в какую сторону рынок из неё вышел. Quantum Imbalance Profiles строит профиль в режиме Volume Bid/Ask — объём
Индикатор для ручной торговли и технического анализа для Forex. Состоит из трендового индикатора с уровнем открытия торгового дня и стрелочного индикатора для определения точек входа. Индикатор не перекрашивается, работает по закрытию свечи. Содержит несколько типов оповещений для сигнальных стрелок. Можно настроить для работы на любом графике, торговом инструменте или тайм-фрейме. Стратегия работы базируется на поиске движений цены по тренду. Для совершения сделок " Buy ": Трендовая линия д
Индикатор силы, который измеряет движение цены для подтверждения тренда и силы. Продвинутый мультивалютный и мультитаймфреймовый индикатор, который позволяет одним взглядом на график увидеть все валютные пары в тренде , а также самые сильные и слабые валюты, движущие этими трендами. Этот индикатор интеллектуально анализирует движения цен 28 валютных пар одновременно на всех таймфреймах в режиме реального времени , поэтому вы всегда будете знать о самых сильных и слабых валютах в составе пары . C
Dark Support Resistance  is an Indicator for intraday trading. This Indicator is programmed to identify  Support and Resistance Lines , providing a high level of accuracy and reliability. Key benefits Easily visible lines Only the most important levels will be displayed Automated adjustment for each timeframe and instrument Easy to use even for beginners Never repaints, never backpaints, Not Lag 100% compatible with Expert Advisor development All types of alerts available: Pop-up, Email, Push
Другие продукты этого автора
Shows on the price chart the price at which RSI would reach 70, 50 and 30 on the next bar: RSI levels as lines on the candles. Description: Reverse Engineered RSI turns RSI levels into prices. Instead of an oscillator in a separate window, it draws three lines on the price chart: the close at which the RSI of the next bar would be exactly 70, exactly 50 and exactly 30. How it works: The RSI is calculated from the average up moves and the average down moves of the last bars. Reverse Engineered
Short description Planetary cycle composite from the real positions of the Moon, Sun and planets, projected into the future with its next peaks and troughs. Description Astro Composite turns the positions of the Moon, the Sun and the planets into one cycle line in a separate window. The positions are calculated in the indicator itself from orbital elements, so the line follows the real sky: the Moon line peaks at the real new Moon, Mercury at its real conjunction with the Sun, and so on. Beca
Индикатор Trend Stop обнаруживает смену тренда за выбранный период времени. Дополнительная функция – отображение оптимальных стоп-уровней. Устанавливайте стоп-ордера ниже линии Trend Stop при бычьем тренде и выше данной линии – при медвежьем. Trend Stop отображает максимальное/минимальное значение за последние N периодов. Расчет В зависимости от текущего тренда, это может быть максимальное значение за последние N периодов для медвежьего тренда или минимальное значение за последние N периодов дл
Fractal Pivot Lines — Indicator Overview  Fractal Pivot Lines is a custom trend-structure indicator for MetaTrader 4 . It automatically connects key fractal highs and lows with dynamic lines so you can see how price is respecting local structure, building channels, and preparing for potential reversals. Instead of staring at dozens of candles and guessing where the real pivots are, the indicator turns fractals into clear support/resistance paths and trend channels . What the Indicator Does C
Shows on the price chart the price at which RSI would reach 70, 50 and 30 on the next bar: RSI levels as lines on the candles. Description: Reverse Engineered RSI turns RSI levels into prices. Instead of an oscillator in a separate window, it draws three lines on the price chart: the close at which the RSI of the next bar would be exactly 70, exactly 50 and exactly 30. How it works: The RSI is calculated from the average up moves and the average down moves of the last bars. Reverse Engineered
Reversing MACD — Indicator Overview Reversing MACD is a forward-looking analytical tool that calculates the exact price the next bar would need to reach for the MACD line and the signal line to cross on the upcoming candle . Instead of waiting for a crossover to occur after the fact, the indicator answers a more powerful question: “At what price will the MACD cross on the very next bar ?” Core Idea Behind the Indicator Traditional MACD reacts to price changes after they occur . A trader only see
Projected Moving Average  A clean and practical moving-average tool designed for traders who want a clearer view of short-term and medium-term trend direction. The Projected Moving Average shifts a standard SMA forward by half of its period, creating a smooth projection zone that updates dynamically with each new candle. This makes it easier to visually anticipate where the moving average is heading without repainting past values. Key Features Forward-shifted SMA (Length/2) for clearer trend pro
Weinstein Stage Analysis (MTF) – Professional Market Structure Indicator This indicator implements   Stan Weinstein’s Stage Analysis   in a clean, modern, and fully   MTF-correct   way for MetaTrader 5. It automatically identifies the four classical market stages: Stage 1 – Base / Accumulation Stage 2 – Advancing Trend Stage 3 – Distribution Stage 4 – Declining Trend Unlike many simplified versions, this indicator: Calculates the trend   on a higher timeframe moving average Projects the correct
Bollinger Trend Lines – MT4 & MT5 Bollinger Trend Lines   is a professional volatility-based trend indicator designed to clearly identify trend direction and dynamic stop levels using Bollinger Bands. Fuses on one core principle: follow the trend, ignore noise, and let volatility define the stop. How it works The indicator builds   trailing trend lines   using Bollinger Bands: In an   uptrend , the   lower band trails price and can only rise In a   downtrend , the   upper band trails pri
Position Sizing Indicator is a chart calculator for MetaTrader 5. It tells you how many lots to trade so that a stop loss costs exactly the amount you want to risk, and it shows the reward to risk ratio of the setup. It does not open, modify or close trades. How it works - Three lines appear on the chart: Entry, Stop and Target. Press and drag any of them with the mouse, no double-click needed. - Dragging Entry moves the whole setup. Dragging Stop changes the stop distance. Dragging Target cha
Draw Gann Fans, Gann Boxes and Gann Grids with one mouse drag, and adjust them with two handles. Gann Toolbox is a mouse-driven drawing tool for MetaTrader. A small panel on the chart lets you pick a Gann Fan, a Gann Box or a Gann Grid, then you press on the chart, drag to the second point and release. It does not open, modify or close trades. Tools - Gann Fan: the standard fan from the first point, scaled so that the 1x1 line runs through the second point. - Gann Box: a box between the two po
Fractals of any size, set with a mouse slider: fractal trend, support and resistance cloud, trend-coloured candles and alerts. The classic fractal needs two bars on each side. Advanced Fractal lets you choose the size: with 2 bars per side you get the usual 5-bar fractals, with 5 or 10 bars per side only the swing points that matter on your timeframe remain. How it works - An up fractal is a bar whose high is not exceeded by the N bars before it and the N bars after it; a down fractal is the s
Where should the pair be, judged by its two currencies in all their other pairs? A fair value line and a cloud built from every cross. Cross Pair Fair Value looks past the chart you are watching. A currency pair is the meeting point of two currencies, and both of them also trade against every other major currency. This indicator asks each of those other pairs where the two currencies stand, and turns the answers into a fair value for your chart. How it works (example: EURUSD) - For every other
Bill Williams zones, Alligator and fractal breaks on one chart: clear BUY / SELL / WAIT labels with entry and stop, final at bar close. BW Zone Signals puts the Bill Williams Profitunity tools together and reads them for you. Instead of five separate indicators, you see one chart with coloured zone candles, the Alligator, the fractals and a label on every bar where a fractal is broken, with the reason, the entry level and the stop. What it shows - Zone candles: green when AO and AC both rise,
One panel, 28 pairs, 6 timeframes, 12 indicators: a colour-coded heat map of trend and momentum states. Click a cell to open that chart. Description Multi Indicator Heat Map shows how one indicator reads across many symbols and timeframes at the same time. Each row is a symbol, each column a timeframe, and every cell is coloured on a five-step scale: strong up, weak up, neutral, weak down, strong down. A sum column adds the timeframes together for each symbol. You choose the indicator on the pan
TPO or volume profile per day, week or session: histogram, letter blocks or letters, with POC, value area, naked POCs and on-chart buttons. Description Market Profile Studio shows where the market spent its time, or where it traded its volume, inside each session. Every session gets its own profile next to the candles, with the point of control (POC), the value area and its high and low (VAH / VAL). The main settings are on a small button bar on the chart, so you can change the view with one
Short description Swing highs and lows (HH, HL, LH, LL), BOS and CHoCH on two structure sizes, trend state, order blocks and premium / discount zones. Description Market Structure marks the swing points of the chart and shows when the structure breaks. It labels every confirmed swing high and low, draws a line when price closes beyond the last swing, and tells you whether the break continues the trend (break of structure, BOS) or turns it (change of character, CHoCH). It does this on two siz
Short description Polymarket prediction-market odds on the chart: the price range the market prices in for crypto, gold, S&P 500 and oil, and the next Fed decision. Description Polymarket Odds Overlay reads the public prices of the Polymarket prediction markets and draws them on your chart. A prediction-market price is a probability: when "Bitcoin above 62,000 on Friday" trades at 0.30, the market gives it 30 %. The utility collects these prices for the symbol on the chart and turns them int
Harmonic patterns that keep their record: every pattern stays on the chart with its result, with statistics per pattern, BUY / SELL zones and a scanner. Description Most harmonic pattern indicators show you a chart full of perfect patterns. The failed ones were redrawn or removed, so the history looks better than any trader could have traded it. Harmonic Patterns Track Record works the other way round: every pattern is tested the way you would trade it, and every result stays on the chart. H
Places your Buy Stop or Sell Stop again, at the same price with the same SL, every time the trade is stopped out. Description Pending Order Repeater is a trade utility for traders who want to keep a level in play. You set the pending order once. Each time the trade it opens closes at the Stop Loss, the EA places the same order again: same symbol, type, price, lot size, Stop Loss and Take Profit. How it works - Place a Buy Stop or Sell Stop with a Stop Loss by hand, on any symbol. The EA, att
Rotation chart for any two indicators: several symbols rotate through four quadrants on up to four timeframes, with trails and a legend. ## Description Rotation Chart shows where a group of symbols stands and where it is moving, all in one window. You choose one indicator for the X axis and one for the Y axis. Every symbol is a point on that plane, with a trail of its last bars, so you see it rotate through the four quadrants: Leading, Weakening, Lagging and Improving. Up to four timeframes a
Seasonality of any symbol: monthly returns of every year, average and median per month, weekday returns and the seasonal projection on the chart. Description Seasonality Map shows how a symbol has behaved in each month of the past years, and draws the average seasonal path from today's price on the chart. Monthly returns table - One row per year (10 completed years by default, plus the current year), one column per month and the full year, coloured green and red by size. - Under the table,
Renko, Point & Figure, Kagi and Line Break in one window, switched with a button, mirrored on the price chart with signals. ## Description Four chart types that ignore time and show only price movement, in one indicator. Switch between them with the buttons in the indicator window; the same columns are drawn on the normal price chart as boxes (or a Kagi line), with their signals as arrows, so you can see both views at once. Chart types - Renko: a brick for every box of movement, a reversal
Sessions, countdowns, key levels and your own news list in one clean indicator: session boxes with overlaps, day / week / month levels. ## Description Sessions News Hub puts the market sessions, the countdowns, the key price levels and your news list into one indicator with one compact panel. Each group has its own button, so the chart shows only what you need at the moment. Market sessions - Sydney, Tokyo, London and New York as boxes from the session high to the low, or as full-height ban
Trend Stop  Introduction Trend Stop is a simple yet powerful trend-following and stop-placement tool for MetaTrader 5. It calculates the highest high or lowest low of the last N periods and plots a dynamic line that reacts instantly to trend changes. The result is a clean, reliable trend filter and a practical guide for placing optimal stop levels — without unnecessary noise or lag. Whether you’re a trend trader, swing trader, or scalper, Trend Stop helps you stay on the right side of the market
Fractal Pivot Lines — Indicator Overview   Fractal Pivot Lines is a custom trend-structure indicator for MetaTrader 5 . It automatically connects key fractal highs and lows with dynamic lines so you can see how price is respecting local structure, building channels, and preparing for potential reversals. Instead of staring at dozens of candles and guessing where the real pivots are, the indicator turns fractals into clear support/resistance paths and trend channels . What the Indicator Does
Reversing MACD — Indicator Overview Reversing MACD is a forward-looking analytical tool that calculates the exact price the next bar would need to reach for the MACD line and the signal line to cross on the upcoming candle . Instead of waiting for a crossover to occur after the fact, the indicator answers a more powerful question: “At what price will the MACD cross on the very next bar ?” Core Idea Behind the Indicator Traditional MACD reacts to price changes after they occur . A trader only see
Projected Moving Average  A clean and practical moving-average tool designed for traders who want a clearer view of short-term and medium-term trend direction. The   Projected Moving Average   shifts a standard SMA forward by half of its period, creating a smooth projection zone that updates dynamically with each new candle. This makes it easier to visually anticipate where the moving average is heading without repainting past values. Key Features Forward-shifted SMA (Length/2) for clearer trend
Weinstein Stage Analysis (MTF) – Professional Market Structure Indicator This indicator implements Stan Weinstein’s Stage Analysis in a clean, modern, and fully MTF-correct way for MetaTrader 5. It automatically identifies the four classical market stages: Stage 1 – Base / Accumulation Stage 2 – Advancing Trend Stage 3 – Distribution Stage 4 – Declining Trend Unlike many simplified versions, this indicator: Calculates the trend on a higher timeframe moving average Projects the correct stage onto
Фильтр:
Нет отзывов
Ответ на отзыв