Scalping Dandruff

Scalping Dandruff

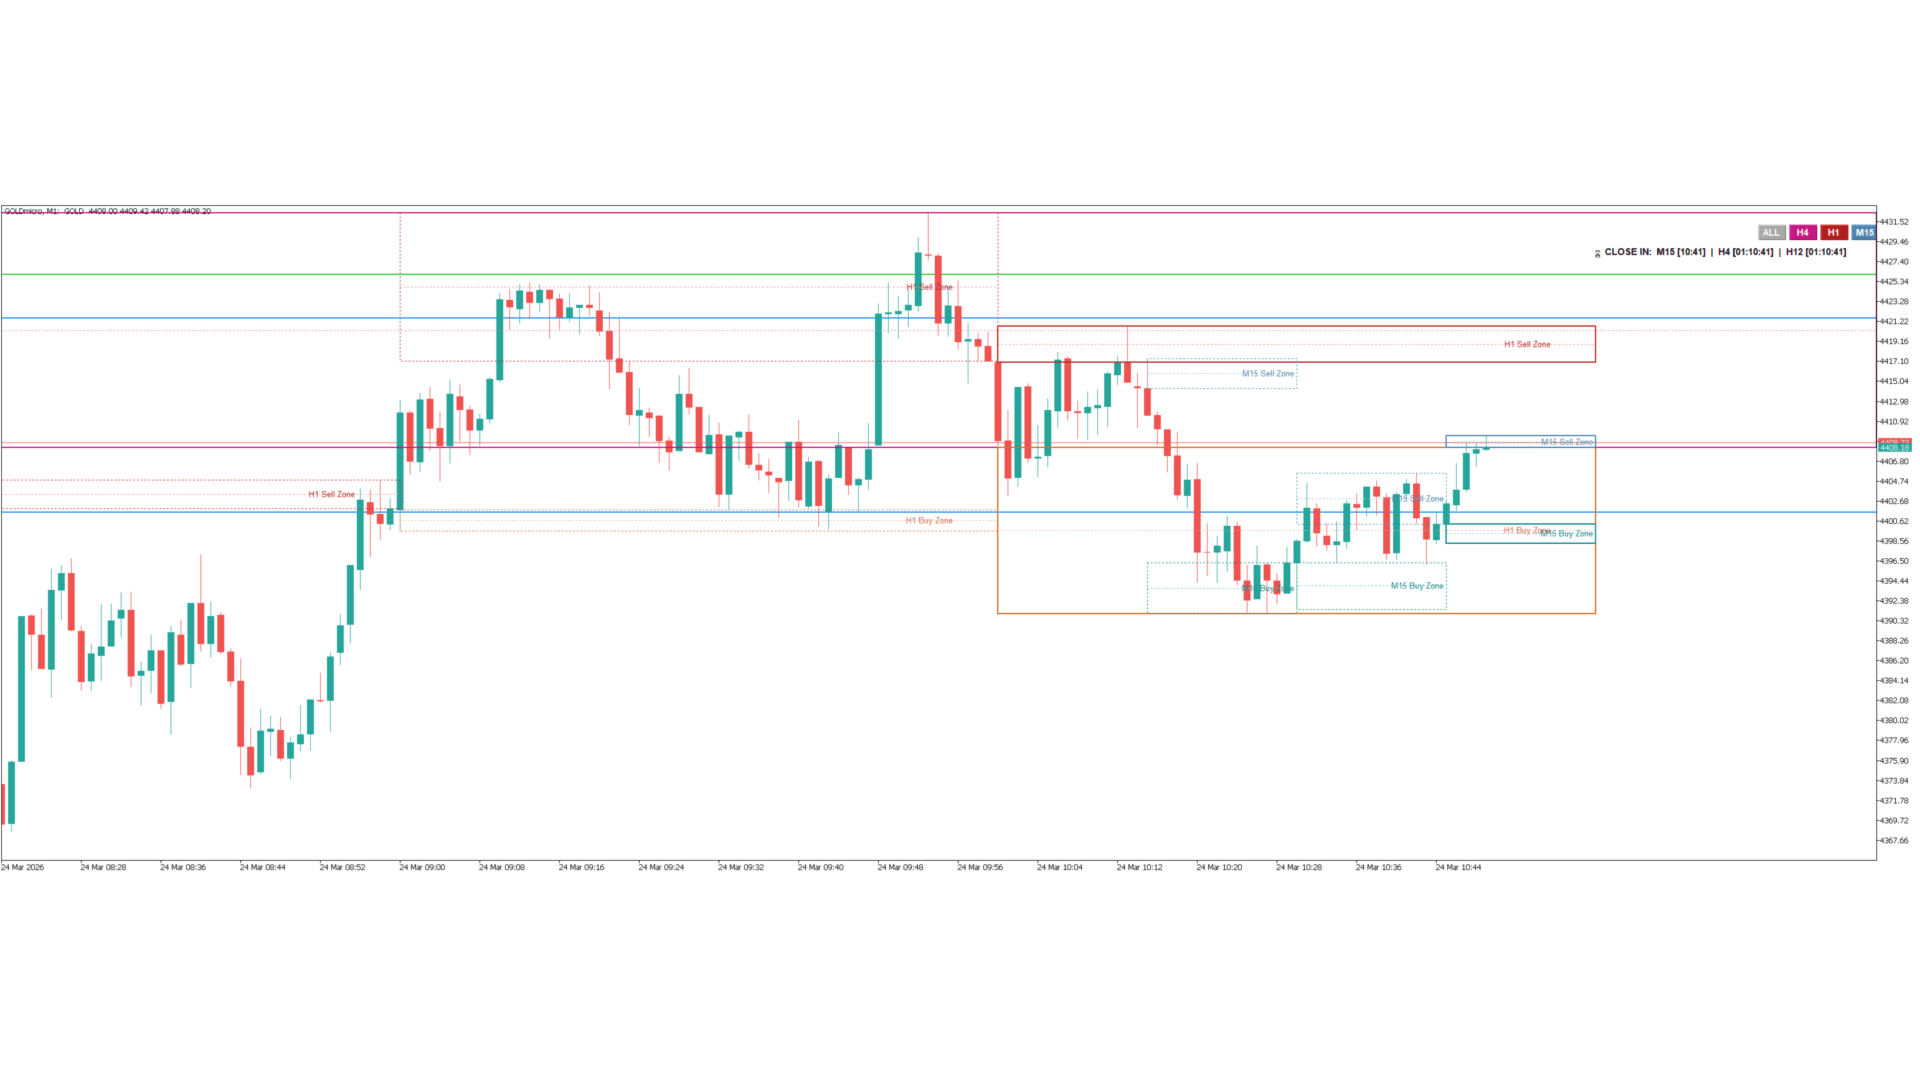
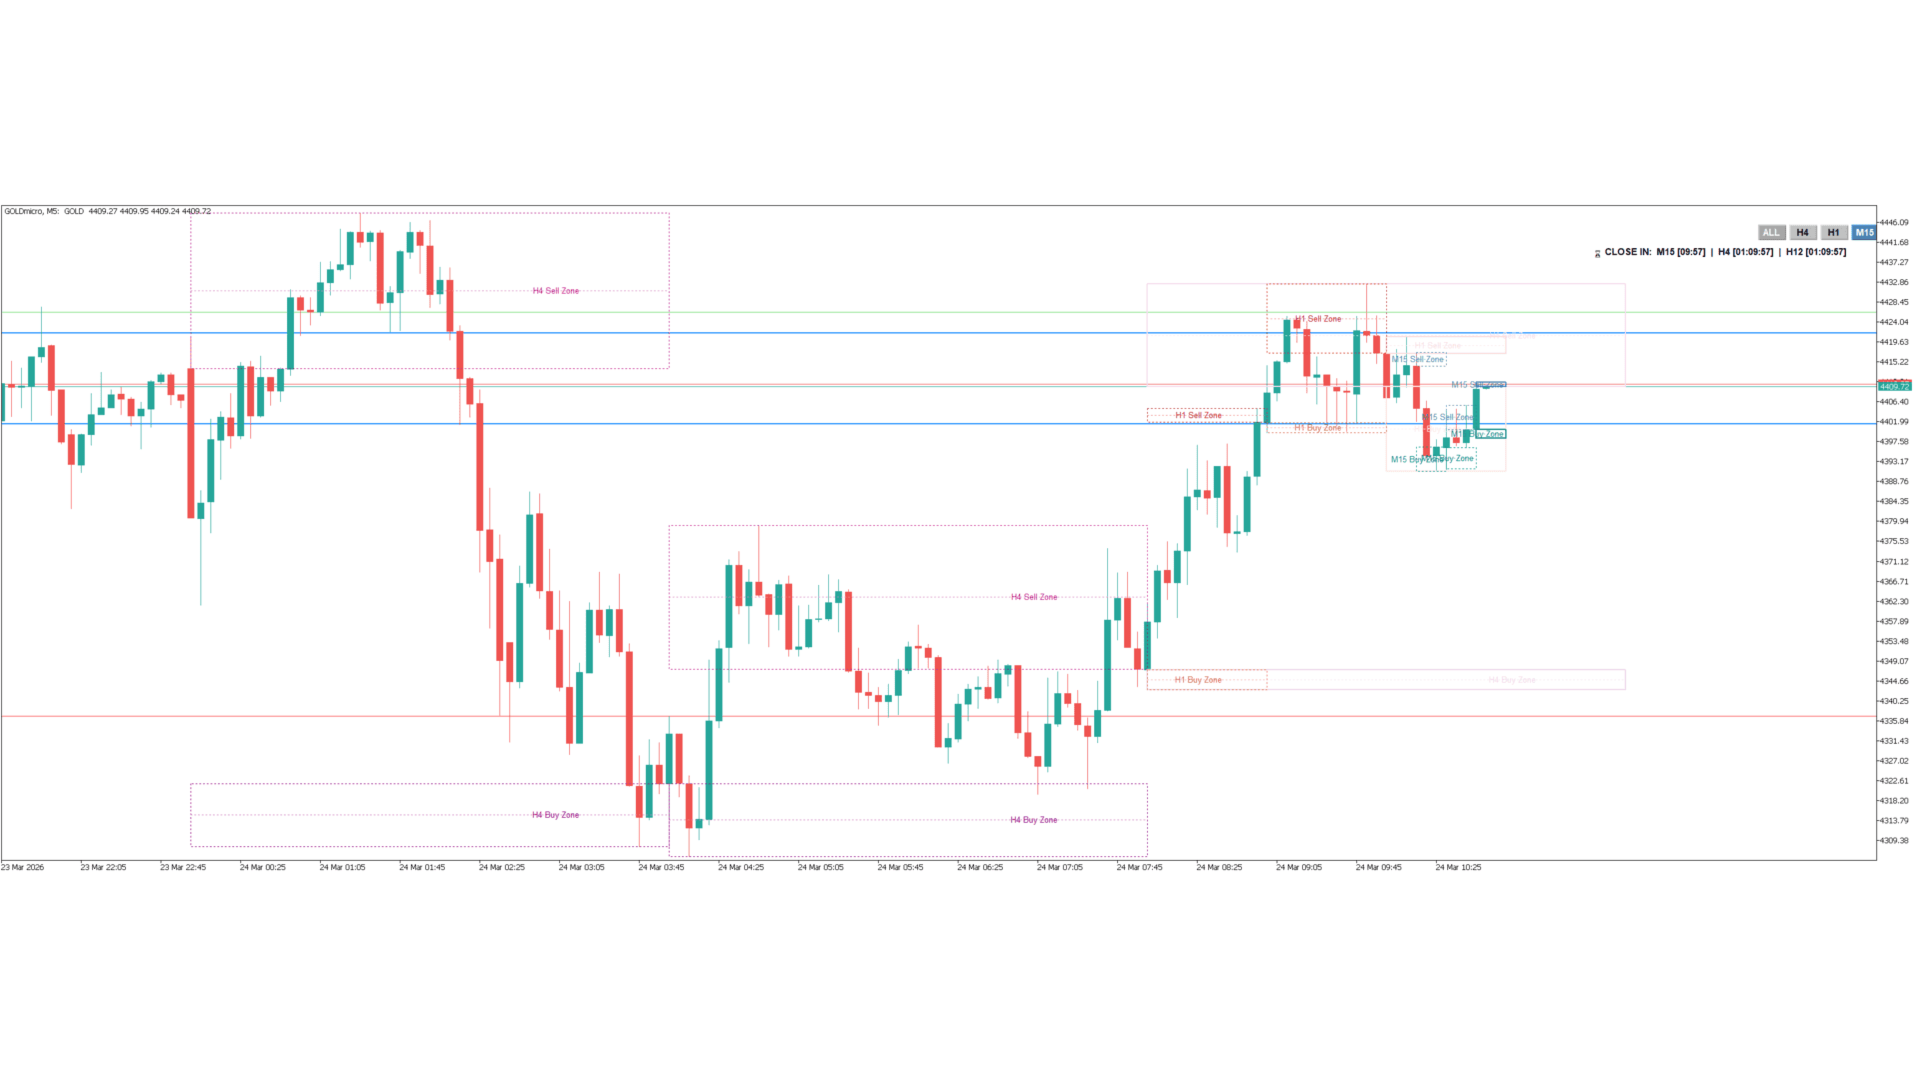
Scalping Dandruff — это мультитаймфреймовый индикатор для отображения структуры рынка, разработанный для MetaTrader 5. Он автоматически строит ключевые горизонтальные зоны поддержки и сопротивления на основе заданных временных алгоритмов (SOP). Определяя экстремальные максимумы и минимумы в конкретные внутридневные окна, индикатор проецирует эти уровни вперед, помогая трейдерам визуализировать макроструктуру рынка прямо на их рабочих таймфреймах.

Основные функции:

  • Точное выделение теней (Wick Isolation): Вместо отрисовки массивных блоков, которые загромождают график, индикатор строит зоны строго от тела свечи (уровня открытия/закрытия) до экстремума тени. Это сохраняет график чистым и выделяет исключительно области реакции цены.

  • Технология умного затухания (Smart Ghosting): При фокусировке на младших таймфреймах, таких как M15, перекрывающиеся макрозоны (H1 и H4) автоматически становятся полупрозрачными, чтобы не перекрывать активное движение цены. При этом исторические макрозоны слева от текущей цены остаются на 100% видимыми для анализа структуры.

  • Отслеживание эквилибриума (Equilibrium): Индикатор автоматически рассчитывает и строит пунктирную среднюю линию 50% (Equilibrium) внутри каждой зоны покупок и продаж для определения точных уровней реакции.

  • Интерактивное управление (GUI): Мгновенно переключайте видимость структур H4, H1 или M15 с помощью встроенных ненавязчивых кнопок на графике. Для обеспечения максимальной наглядности по умолчанию при запуске установлен фокус на таймфрейм M15.

  • Динамическое смещение меток: Текстовые метки зон динамически выравниваются по правому краю и смещаются по горизонтали. Это гарантирует, что текстовые ярлыки H4, H1 и M15 никогда не будут сливаться или перекрывать друг друга на краю вашего экрана.

  • Встроенные таймеры свечей: Индикатор включает минималистичный таймер обратного отсчета времени до закрытия свечей M15, H4, H12 и D1, закрепленный в углу экрана, для помощи во внутридневном тайминге.

Настройки и параметры:

  • Синхронизация времени брокера: Легко корректируйте часы алгоритма в настройках, чтобы точно синхронизировать серверное время вашего брокера с целевыми окнами торговой сессии Нью-Йорка.

  • Визуальные настройки: Полная свобода в выборе цветов для всех линий таймфреймов, блоков сопротивления и поддержки, чтобы индикатор идеально соответствовал вашему личному шаблону графика.

  • Лимиты зон: Контролируйте точное количество исторических зон, отображаемых на графике, для поддержания высокой скорости работы терминала и снижения визуальной нагрузки.

Поддержка: По любым вопросам, за помощью в настройке индикатора или технической поддержкой обращайтесь ко мне напрямую через встроенную систему личных сообщений MQL5.

Рекомендуем также
Signal Eskiya кроме линий канала отражает сигналы на вход в виде стрелок. Торговые стратегии, использующие индикатор канала относятся к классическим методам технического анализа, просты в исполнении, поэтому доступны даже новичкам. Ценовые диапазоны одинаково хорошо работают на любых торговых активах и таймфреймах, могут использоваться как самостоятельно, так и с дополнительным подтверждением от осцилляторов и рыночных объемов.  Американские трейдеры говорят: «Trend is your friend», – что в пе
Moving pivot Average Fibonacci The  indicator compares the selected period with its counterpart from the previous period. The indicator determines the moving Fibonacci levels for the day or any time interval to assess the price movement range from the time average. The indicator helps predict the expected high or low for the day based on historical time data. The pivot line can be considered an average trend line and use it in a variety of trading strategies. If you have any question about the
Этот индикатор на панели инструментов зоны спроса и предложения с несколькими временными рамками и несколькими символами отправляет предупреждения, когда цена достигает зоны спроса / предложения. Также можно использовать его для предупреждения об обычных двойных вершинах / основаниях вместо зон. Его можно использовать на всех таймфреймах от M1 до MN.       Одновременно на панели управления может отображаться не более 9 таймфреймов.   Можно использовать фильтры RSI, дивергенции (MACD, RSI или Awe
Projection of Phi   технический индикатор, рассчитывающий динамические уровни поддержки и сопротивления. Использует угловые геометрические проекции и математические соотношения для идентификации диапазонов расширения рынка. Особенности: Динамическое расширение Фибоначчи: Проекция уровней расширения Геометрические расчеты: Угловой анализ и математические соотношения Визуализация: Графические объекты с информативными метками Совместимость: Таймфреймы от M1 до H4 Применение: Идентификация зон для
Multichart V and H Line Sync Overview Multichart V and H Line Sync is the essential tool for multi-timeframe traders. It instantly synchronizes your Horizontal Support/Resistance Lines and Vertical Time Lines across all open charts of the same symbol. Stop drawing the same levels on M5, H1, and D1 charts manually. With this tool, draw a line once, and it automatically replicates on every other timeframe. Perfect for keeping your technical analysis consistent and your workspace clean. Key Feature
FREE
mql4 version:  https://www.mql5.com/en/market/product/44606   Simple indicator to calculate profit on fibonacci retracement levels with fixed lot size, or calculate lot size on fibonacci levels with fixed profit. Add to chart and move trend line to set the fibonacci retracement levels. Works similar as default fibonacci retracement line study in Metatrader. Inputs Fixed  - select what value will be fix, lot or profit Fixed value  - value that will be fix on all levels Levels  - levels for which
Adaptive SR Zones – Breakout Edition Adaptive SR Zones is a next-generation MetaTrader 5 indicator that automatically maps support and resistance zones and tracks breakout activity in real time. Designed for traders who rely on market structure and zone confluence, it combines multi-timeframe analysis , breakout confirmation logic , and customizable alerts into one powerful tool. No repainting. Core Features Dynamic Support & Resistance Mapping Detects zones from swing highs/lows and reaction po
Considering the main theories of Forex (Dow Theory, support lines, chart patterns, and Fibonacci retracements), It tells you the price range where whales (large investors) are likely to appear. You can trade at the price points that professionals also aim for. You no longer have to warry about where to aim next. We are live-streaming the actual operation of the system. Please check for yourself if it is usable. Please check it out for yourself. https://www.youtube.com/@ganesha_forex We do not
Liquidity Map  Overview The Liquidity Map indicator is an advanced visualization tool based on ICT Smart Money Concepts . It automatically identifies daily Buy Zones , Sell Zones , and Liquidity Levels , showing where price is likely to reverse or continue based on institutional order flow. It calculates key levels from the daily session — such as the previous day’s high, low, and midpoint — then derives a premium (sell bias) and discount (buy bias) structure. When price trades into these mapped
The indicator ‘Probability Range Bands’ gives a prediction of the amount, how much the asset is moving from its current price. The range bands give probabilities, that the candle close will not exceed this certain price level. It is also called the expected move for the current candle close.   This Indicator is based on statistical methods, probabilities and volatility. Asset price is assumed to follow a log-normal distribution. Therefore, log returns are used in this indicator to determine the
LR Pivots Combo Statistics That Show You Where the Market Stands! Key Features (updated V2.1) 1. Auto-Plotting Linear Regression Channel Trend Direction — Uses slope (normalized by ATR) to identify whether the market is in an uptrend, downtrend, or ranging sideways. Trend Quality (R-Squared) — Tells you if the trend is statistically consistent (Stable) or just noise (Volatile). Useful for filtering out unreliable setups. Standard Deviation Bands — Shows how far price has deviated from the regre
FREE
Индикатор поддержки и сопротивления Wamek (WSR) - удивительный инструмент, выделяющийся в мире технического анализа. Он выделяется тем, что умело объединяет действия цен и ведущие индикаторы для определения уровней поддержки и сопротивления с высокой степенью точности. Его уникальной особенностью является его адаптивность; пользователи могут настраивать параметры ввода индикатора, что позволяет им создавать настраиваемые уровни поддержки и сопротивления, соответствующие их торговым стратегиям.
PROB MULTI-TF INSTITUCIONAL Probabilidad Operativa Multitemporal con Confirmación Estructural PROB MULTI-TF INSTITUTIONAL es un indicador avanzado diseñado para traders que buscan operar con confirmación estructural real, sin señales aisladas. El sistema analiza simultáneamente múltiples temporalidades y calcula un Global Bias porcentual , mostrando de forma clara cuándo el mercado presenta mayor probabilidad de: Compra (BUY) Venta (SELL) Neutralidad (WAIT) ¿Cómo funciona? El indica
Индикатор Projection от BCB Elevate — это полнофункциональный профессиональный инструмент для анализа структуры рынка и следования за трендом. Создан для ручных трейдеров, он сочетает фильтрацию макротренда (EMA 100), динамические трейлинг-стопы на основе ATR и отслеживание Swing High/Low pivot для выдачи высокоточных сигналов на графике. Вместо перерисовки или загромождения графика Projection Indicator ожидает строгого совпадения условий перед отображением стрелок входа, уровней Stop Loss и Tak
Linha de Variacao de Preco
Renato Fabio Santos Vasconcelos
РУССКАЯ ВЕРСИЯ ЛИНИЯ ИЗМЕНЕНИЯ ЦЕНЫ — ВОЗЬМИ РЫНОК ПОД КОНТРОЛЬ! Преврати цену открытия в стратегическое оружие Видно, на сколько пунктов или % рынок ушёл Горизонтальные линии на уровнях, которые ЗАДАЁШЬ ТЫ Отмечай вход, выход, цели и взрывные зоны Чистый, точный и профессиональный интерфейс Просто, мощно и необходимо для любого серьёзного трейдера
On-Balance Volume (OBV) - это технический индикатор, который связывает объем и цену для определения ценовых движений. Основная идея OBV заключается в том, что изменения объема обычно предшествуют изменениям цены. Индикатор накапливает объемы за периоды, когда цена закрывается выше, и вычитает объемы за периоды, когда цена закрывается ниже. В результате получается значение, которое используется для определения направления тренда актива. Интерпретация OBV проста: растущий OBV говорит о том, что
+++++++++++++++++++++++++++++++++++++++++++++++++++++++++++++++++++++++++++++++++++++++++++++++++ +++ Link to EURUSD Only Free Version -->  https://www.mql5.com/en/market/product/156904?source=Unknown +++++++++++++++++++++++++++++++++++++++++++++++++++++++++++++++++++++++++++++++++++++++++++++++++ Hallo Trader, This is a traditional GANN & FIBONACCI strategy based on detection of an impulsive move in the opposite direction. This is called a Breakout. At the moment of Breakout, the indicator draw
Rtc ML Ai | Predictor CORE MACHINE LEARNING ENGINE Adaptive ML Market Predictor – Multi-Bar Trend & Candle Forecast What This Indicator Does This indicator is a  real-time market prediction engine  designed to analyze price behavior and estimate  future market tendencies . Unlike conventional indicators, this system  does not rely on static parameters or historical curve-fitting , but adapts its internal state dynamically during live market operation. Instead of using static rules, the indic
Adaptive Fibonacci Trend Zones is an MT5 indicator built for traders who want a clean structure-based Fibonacci workflow without constantly redrawing anchors by hand. The indicator automatically detects the dominant swing, builds the active Fibonacci map, projects trade-map zones and adapts its behavior across scalp, intraday and swing conditions. Instead of leaving outdated levels on the chart when structure changes, the indicator can disable the active trade map and wait for a new anchor. T
Frontier Pivots
Nestor Jose Mendez Boza
FRONTIER PIVOTS - Geometric Levels Indicator This indicator plots support and resistance levels/ranges on the chart using mathematical calculations. It helps traders identify potential price reaction zones based on geometric patterns. Main Features: Automatically calculates and displays key price levels Plots both support and resistance lines Uses daily price data for level calculation Clean visual presentation with different colors for different level types No repainting - levels remain static
Рыночные структуры - это те, которые при прорыве на более высоком таймфрейме могут помочь трейдеру очистить тренд. 1. Этот индикатор нарисует ZigZag только до 2 последних структур (предыдущий максимум и минимум ZigZag), а новый бар ZigZag будет сформирован только тогда, когда произойдет разрыв структуры. 2. Он дает Терминал и Push-уведомление о нарушении структуры 3. Увеличьте и уменьшите Extdepth зигзага с помощью клавиш [ и ] для регулировки колебания 4. Измените цвета линий AB BC и CD. 5
SmartTrendMA
Jhones Jorente Garcia
A SmartTrendMA foi projetada para identificar melhor zonas de alta, baixa e consolidação, azul alta, vermelho baixa e branco consolidação, vai te auxiliar a identificar melhor a tendência. Em parâmetro regule melhor conforme sua preferência em grau pois cada par de moeda se adequa diferentemente a cor,mude também o período e se quiser mude exponencial ou simples. 
O Alexxander Autotrader é seu robô especialista em trade em minidólar WDO na bolsa brasileira B3. Com estratégia única, o robô já está configurado para operar minidólar na abertura do pregão, operando em fechamentos de gaps principalmente. O robô também pode ser otimizado para operar além do horário de abertura. Alem disso, o robô pode ser configurado com trailling stop, horários de trades e tipo de stop, se fixo ou dinâmico. OBS: alterar o parâmetro BR1 para BR.
Kindly rate and comment about the product for upgradation & Support The 5 EMA is plotted in green color ( Lime ). The 14 EMA is plotted in red color ( Red ). The 20 EMA is plotted in blue color ( Blue ). The 200 EMA is plotted in yellow color ( Yellow ). The Quarter EMA that provided calculates and plots four Exponential Moving Averages (EMAs) on the chart using different periods: 5, 14, 20, and 200. Each EMA is represented by a different color on the chart. Here's a description of each EMA:
Kindly rate and comment about the product for upgradation & Support The   5 EMA   is plotted in   green   color ( Lime ). The  14 EMA  is plotted in  red  color ( Red ). The   20 EMA   is plotted in   blue   color ( Blue ). The  200 EMA  is plotted in  black  color ( Black ). The   200 EMA   is plotted in   yellow   color ( Yellow ). The Quarter EMA that provided calculates and plots four Exponential Moving Averages (EMAs) on the chart using different periods: 5, 14, 20, and 200. Each EMA is
Turpial Pullback
Arlos Elias Rivas Romero
Indicator Type Strategy (Pullback) for all Symbols and Periodicity, Preferably from 30M periodicity. Can be used for manual trading. Its workspace corresponds to channel of 3 bars of Bill Willians. Also relies on the indicator Rsi and Atr. BUY when: There is a Green Arrow STOPLOSS to buy, below the bottom line of the channel (red line)" SELL when: There is a Red Arrow. STOPLOSS to sell, above the upper line of the channel (blue line)
Modern Spike Indicator Features: 1. Support and Resistance Lines: Displays dynamic horizontal dashed lines on the chart representing current support and resistance levels calculated from recent price swings. 2. Spike Detection Arrows: Shows up arrows (green) for potential upward spikes and down arrows (red) for potential downward spikes, triggered when price breaks S/R levels with RSI confirmation. 3. Trend Analysis: Incorporates ADX (Average Directional Index) to determine market trend stre
IKAN MFX In the volatile world of financial markets, finding the best trading opportunities and minimizing risks is always a significant challenge for every investor. That’s why we developed IKAN (Intelligent Knowledge Automated Navigator) , an advanced automated trading system. IKAN is not just a tool but a perfect combination of artificial intelligence and years of trading experience. With the ability to analyze millions of data points per second, IKAN can identify market trends, predict price
Title: Dynamic SR Levels Pro Short Description: A next-generation, multi-timeframe Support & Resistance indicator that automatically detects, adapts, and invalidates key price zones based on real-time market volatility. Stop guessing, start seeing. Full Description: Tired of manually drawing support and resistance lines that quickly become outdated? Dynamic SR Levels Pro is the ultimate solution for traders who demand precision, adaptability, and a clean, clutter-free chart. This is not just ano
С этим продуктом покупают
ARIBot is a powerful trading companion designed to generate high-probability entry signals with dynamic TP/SL/DP levels based on volatility. Built-in performance tracking shows win/loss stats, PP1/PP2 hits, and success rates — all updated live. Key Features: Buy/Sell signals with adaptive volatility bands Real-time TP/SL/DP levels based on ATR Built-in MA Filter with optional ATR/StdDev volatility Performance stats panel (Success, Profit/Loss, PP1/PP2) Alerts via popup, sound, push, or email Cus
SignalTech MT5 is a fully rule based trading system for EURUSD, USDCHF, USDJPY, AUDUSD, NZDUSD, EURJPY, AUDJPY, NZDJPY, CADJPY.  All the winning trades with chart setups are published on the comments page. 2025-12 1174 Pips 2026-01 2624 Pips 2026-02 2937 Pips 2026-03 2165 Pips 2026-04 2243 Pips It can generate signals with Buy/Sell Arrows and Pop-Up/Sound Alerts. Each signal has clear Entry and Stop Loss levels, which should be automatically flagged on the chart, as well as potential Targets 1,
Azimuth Pro
Ottaviano De Cicco
5 (7)
Azimuth Pro V2: Синтетический фрактальный структурный анализ и подтверждённые входы для MT5 Обзор Azimuth Pro — многоуровневый индикатор свинговой структуры от Merkava Labs . Четыре вложенных уровня свингов, привязанный к свингам VWAP, определение ABC-паттернов, трёхтаймфреймная структурная фильтрация и подтверждённые входы на закрытой свече — один график, один рабочий процесс от микро-свингов до макро-циклов. Это не слепой сигнальный продукт. Это рабочий процесс, основанный на структуре, для т
RelicusRoad Pro: Квантовая Рыночная Операционная Система СКИДКА 70% ПОЖИЗНЕННЫЙ ДОСТУП (ОГРАНИЧЕНО) - ПРИСОЕДИНЯЙТЕСЬ К 2000+ ТРЕЙДЕРАМ Почему большинство трейдеров теряют деньги даже с «идеальными» индикаторами? Потому что они торгуют Единичными Концепциями в вакууме. Сигнал без контекста — это лотерея. Чтобы выигрывать стабильно, вам нужна КОНФЛЮЭНЦИЯ . RelicusRoad Pro — это не простой стрелочный индикатор. Это полная Количественная Рыночная Экосистема . Она отображает «Дорогу Справедливой Сто
Умный многослойный детектор пробоя и отката для MetaTrader 5 «Умно. Просто. Быстро!» Устали упускать точки входа с высокой вероятностью пробоя? Тратите часы на просмотр нескольких графиков, пытаясь совместить пробои с направлением тренда и динамикой валют — и всё равно упускаете движение? Break Pullback решает всё это с помощью одного индикатора. Что такое Break Pullback? Break Pullback — это профессиональный индикатор MetaTrader 5, созданный специально для трейдеров, торгующих по структуре ры
Прежде всего стоит подчеркнуть, что этот Торговый Инструмент является Неперерисовывающимся Нерепейнтинговым Индикатором, что делает его идеальным для профессиональной торговли. Онлайн-курс, руководство пользователя и демонстрация. Индикатор Концепций Умного Действия Цены - очень мощный инструмент как для новичков, так и для опытных трейдеров. Он объединяет более 20 полезных индикаторов в одном, комбинируя передовые торговые идеи, такие как анализ Inner Circle Trader и стратегии торговли концеп
Индикатор " Dynamic Scalper System MT5 " разработан для скальпингового метода торговли внутри трендовых волн. Тестировался на основных валютных парах и золоте, возможна совместимость с другими торговыми инструментами. Дает сигналы для кратковременного открытия позиций по тренду с дополнительным сопровождением движения цены. Принцип действия индикатора. Большие стрелки определяют направление тренда. Внутри трендовых волн действует алгоритм генерации сигналов для скальпинга в виде маленьких ст
OmniSync Projection
Antonio-alin Teculescu
5 (1)
Chronos Fractal Engine is an innovative price projection indicator for MetaTrader 5, designed to transform your technical analysis by intelligently identifying and projecting historical price patterns. Built upon an advanced correlation algorithm and the fractal principles of the market, this powerful tool visualizes potential future price movements, giving you a unique edge in your trading decisions. What is Chronos Fractal Engine? At its core, the Chronos Fractal Engine employs a sophisticat
The Zone Trading Indicator is a technical analysis tool for MetaTrader 5 that automatically identifies and displays tradable price zones across multiple timeframes to assist with structured market analysis. The indicator plots Monthly, Weekly, Daily, and H4 tradable zones , allowing traders to view higher- and lower-timeframe price areas simultaneously. These zones are designed to support one-candle–based entry approaches by highlighting predefined areas where price interaction may be monitored.
ARICoin is a powerful trading companion designed to generate high-probability entry signals with dynamic TP/SL/DP levels based on volatility. Built-in performance tracking shows win/loss stats, PP1/PP2 hits, and success rates all updated live. Key Features: Buy/Sell signals with adaptive volatility bands Real-time TP/SL/DP levels based on ATR Built-in MA Filter with optional ATR/StdDev volatility Performance stats panel (Success, Profit/Loss, PP1/PP2) Alerts via popup, sound, push, or email Cust
==================================================================== SMC Pro v6.1 APEX AI — XAUUSD Gold Empire MetaTrader 5 Indicator · Smart Money Concepts · Predictive Intelligence Engine ==================================================================== SMC Pro v6.1 APEX AI is a professional Smart Money Concepts indicator system built exclusively for XAUUSD (Gold) on MetaTrader 5. It combines the complete SMC framework — Order Blocks, Liquidity sweeps, Fair Value Gaps, Break of Structure,
Инструмент маркет-мейкеров. Meravith будет: Анализировать все таймфреймы и отображать текущий действующий тренд. Выделять зоны ликвидности (объёмное равновесие), где бычий и медвежий объём равны. Показывать все уровни ликвидности с разных таймфреймов прямо на вашем графике. Генерировать и отображать текстовый анализ рынка для вашего ориентирования. Рассчитывать цели, уровни поддержки и стоп-лосс в соответствии с текущим трендом. Вычислять соотношение риск/прибыль для ваших сделок. Определять раз
UZFX {SSS} Scalping Smart Signals MT5 — это высокоэффективный торговый индикатор без перерисовки, разработанный для скальперов, дейтрейдеров и свинг-трейдеров, которым требуются точные сигналы в режиме реального времени на быстро меняющихся рынках. Разработанный компанией (UZFX-LABS), этот индикатор сочетает в себе анализ ценового действия, подтверждение тренда и интеллектуальную фильтрацию для генерации сигналов на покупку и продажу с высокой вероятностью на всех валютных парах и таймфреймах.
Большинство стрелочных индикаторов дают сигнал и оставляют вас самостоятельно разбираться со всем остальным. KT Alpha Hunter Arrows дает вам полный торговый план. Каждая сигнальная стрелка появляется вместе с уже готовым планом: линия входа, стоп-лосс, четыре уровня тейк-профита и живой вердикт по преимуществу, который показывает, стоит ли сейчас торговать данный символ и таймфрейм. В комплект входит Trade Manager EA, который берет на себя сопровождение сделки после вашего входа, помогая сохраня
Ziva LSE System
Hassan Abdullah Hassan Al Balushi
ZIVA LSE System A Professional Liquidity & Structure Execution Framework Executive Overview ZIVA LSE System is a professionally engineered analytical framework designed to interpret market behavior through structural logic and liquidity dynamics. It is not positioned as a conventional indicator. Rather, it functions as a structured execution environment that organizes price action into a clear, disciplined decision-making model. The system is built to deliver consistency, clarity, and controlled
AriX
Temirlan Kdyrkhan
1 (4)
AriX Indicator for MT5 A powerful trend-following and signal-evaluation tool AriX is a custom MT5 indicator that combines Moving Averages and ATR-based risk/reward logic to generate clear buy/sell signals. It visualizes dynamic SL/TP levels, evaluates past trade outcomes, and displays win/loss statistics in a clean on-chart panel. Key features include: Buy/Sell signals based on MA crossovers ATR-based SL/TP1/TP2/TP3 levels with visual lines and labels Signal outcome tracking with real-time stat
MightyPips Sentiment Pro is an advanced market sentiment analysis indicator for MetaTrader 5, designed to help traders better understand who is in control of the market by analyzing buying and selling pressure. Instead of relying on price alone, this indicator focuses on sentiment dynamics , comparing institutional-style buying and selling behavior against retail market activity to highlight potential trend strength, exhaustion, and directional bias. What MightyPips Sentiment Pro Does MightyP
MATADOR GOLD — XAUUSD M5 ( TimeFrame M5 ) Scalp Signals for MT5 Strategy Tester Visualization Video https://youtu.be/_cWbbyg2RSs Not every move deserves a signal. MATADOR GOLD was built for traders who prefer selective, structured, high-quality decision support over noisy, hyperactive signal tools. Designed specifically for Gold (XAUUSD / GOLD) on M5 , MATADOR helps you read short-term momentum with more discipline by combining trend logic, market-condition filters, momentum timing, spread pro
Assembler
Darko Licardo
5 (1)
Introducing Assembler:  The best value for money,  Designed for advanced traders and professionals, yet accessible for ambitious beginners ready to elevate their trading game. Great for ICT, SMC, TREND and breakout traders . Combining advanced analytics, a sleek graphical interface, and highly customizable features, Assembler empowers you to trade with precision, clarity, and confidence. Key Features of Assembler 1. Dynamic Graphical User Interface (GUI): A fully draggable, customizable interf
Presenting one-of-a-kind Gann Indicator for XAUUSD IQ Gold Gann Levels is a non-repainting, precision tool designed exclusively for XAUUSD/Gold intraday trading. It uses W.D. Gann’s square root method to plot real-time support and resistance levels, helping traders spot high-probability entries with confidence and clarity. William Delbert Gann (W.D. Gann) was an exceptional market analyst whose trading technique was based on a complex blend of mathematics, geometry, astrology, and ancient calcul
The Propfolio Master Suite is the ultimate all-in-one analytical workstation for professional traders. Combining the power of the Beat The Market Maker (BTMM) methodology, Smart Money Concepts (SND/Liquidity), and Advanced Volume Profile, this suite replaces multiple different indicators with one optimized engine. Monitor up to 14 pairs simultaneously from a single chart, instantly identify market cycles, and seamlessly map institutional footprints with the click of a button. The Command Center
A tool for on-chart strategy backtesting and performance analysis. A utility for developing, debugging, and testing custom trading ideas and indicator functions. An indicator designed to quickly test trading concepts and visualize the effectiveness of different input parameters. An all-in-one sandbox for testing everything from simple crossovers to complex, multi-condition trading systems.
Niveaux mensuels + PinBar + Marubozu + ALERTES (MT5) Version : 2.0 FINAL Auteur : KOUAME N'DA LEMISSA Examen Cet indicateur pour MetaTrader 5 permet d'analyser la structure de votre propre environnement, de déterminer les modèles de données les plus récents et le système fonctionne dans des conditions réelles. Il est alors possible d'agir sur les zones sensibles et les réactions potentielles des signaux techniques obscurs. Fonctions gratuites Véhicules automatiques Автоматический расчет Mensue
При торговле по тренду основная сложность — не в том, чтобы найти уровень, а в том, чтобы понять, где вход действительно имеет смысл. Цена часто реагирует на уровни, но не даёт продолжения — из-за этого появляются ложные входы или пропущенные движения. Owl Smart Levels показывает не просто уровни , а зоны, сформированные с учётом структуры движения и отката. Это позволяет по-другому смотреть на точки входа и избегать части ложных сигналов. Что входит в систему Owl Smart Levels? Owl Smart Levels
Индикатор выделяет зоны, в которых проявляется интерес, а затем показывает зону накопления ордеров. Он работает как биржевой стакан, но в крупном масштабе. Это индикатор для самых крупных денег. Его эффективность исключительна. Какой бы интерес ни возник на рынке — вы его увидите. (Это полностью переписанная и автоматизированная версия — ручной анализ больше не требуется.) Скорость транзакций — это концептуально новый индикатор, который показывает, где и когда накапливаются крупные ордера и как
note: this indicator is for METATRADER4, if you want the version for METATRADER5 this is the link:  https://www.mql5.com/it/market/product/108106 TRENDMAESTRO ver 2.5 TRENDMAESTRO recognizes a new TREND from the start, he never makes mistakes. The certainty of identifying a new TREND is priceless. DESCRIPTION TRENDMAESTRO identifies a new TREND in the bud, this indicator examines the volatility, volumes and momentum to identify the moment in which there is an explosion of one or more of these da
Технический индикатор, использующий астрономический алгоритм Жана Меёса для отображения фаз луны на торговых графиках. Представляет собой непрерывную кривую линию, отображающую лунный цикл с научной точностью, эквивалентной профессиональным обсерваториям. Совместим с любым символом и таймфреймом в MT5, включая форекс, сырьевые товары, индексы и акции. Включает информационную панель, отображающую текущую фазу луны, процент освещённости и опорные уровни для технического анализа. Полностью настраи
TPA True Price Action indicator reveals the true price action of the market makers through 100% non-repainting signals strictly at the close of a candle! TPA shows entries and re-entries, every time the bulls are definitely stronger than the bears and vice versa. Not to confuse with red/green candles. The shift of power gets confirmed at the earliest stage and is ONE exit strategy of several. There are available now two free parts of the TPA User Guide for our customers. The first "The Basics"
IVISTscalp5
Vadym Zhukovskyi
5 (6)
iVISTscalp5 — система прогнозирования рынка по времени iVISTscalp5 — это не обычный индикатор.  Это система прогнозирования по времени (timing) для MetaTrader 5, которая показывает, когда рынок с наибольшей вероятностью будет двигаться. В чем отличие? Вместо анализа только цены, индикатор работает с:  • временными циклами  • рыночными ритмами  • повторяющимися временными закономерностями Возможности  • точные временные зоны (timing)  • прогноз BUY / SELL  • расчет среднего потенциал
Premium level - это уникальный индикатор с точностью правильных прогнозов  более 80%!  Данный индикатор тестировался более двух месяцев лучшими Специалистами в области Трейдинга!  Индикатор авторский такого вы больше не где не найдете!  По скриншотах можете сами увидеть точностью данного инструмента!  1 отлично подходит для торговли бинарными опционами со временем экспирации на 1 свечу. 2 работает на всех валютных парах, акциях, сырье, криптовалютах Инструкция: Как только появляется красная стре
Фильтр:
Нет отзывов
Ответ на отзыв