Scalping Dandruff

Scalping Dandruff

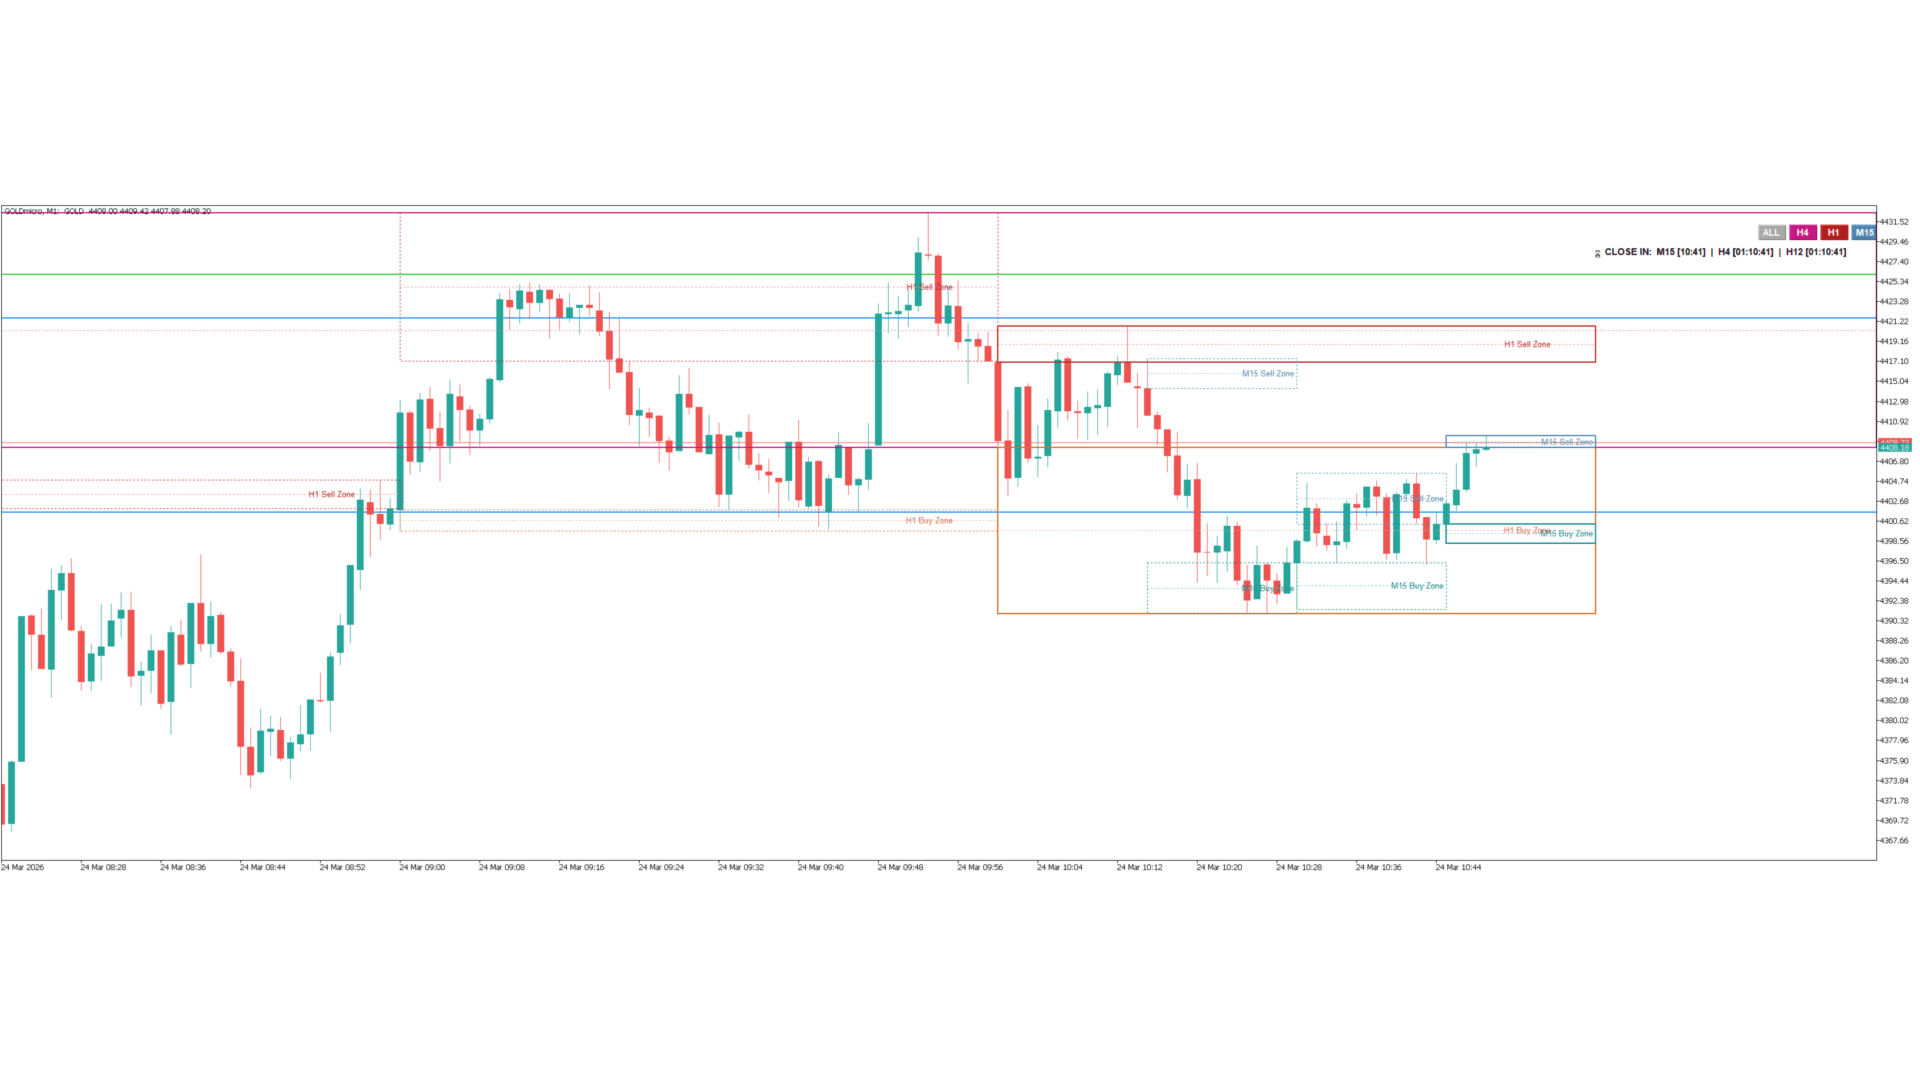
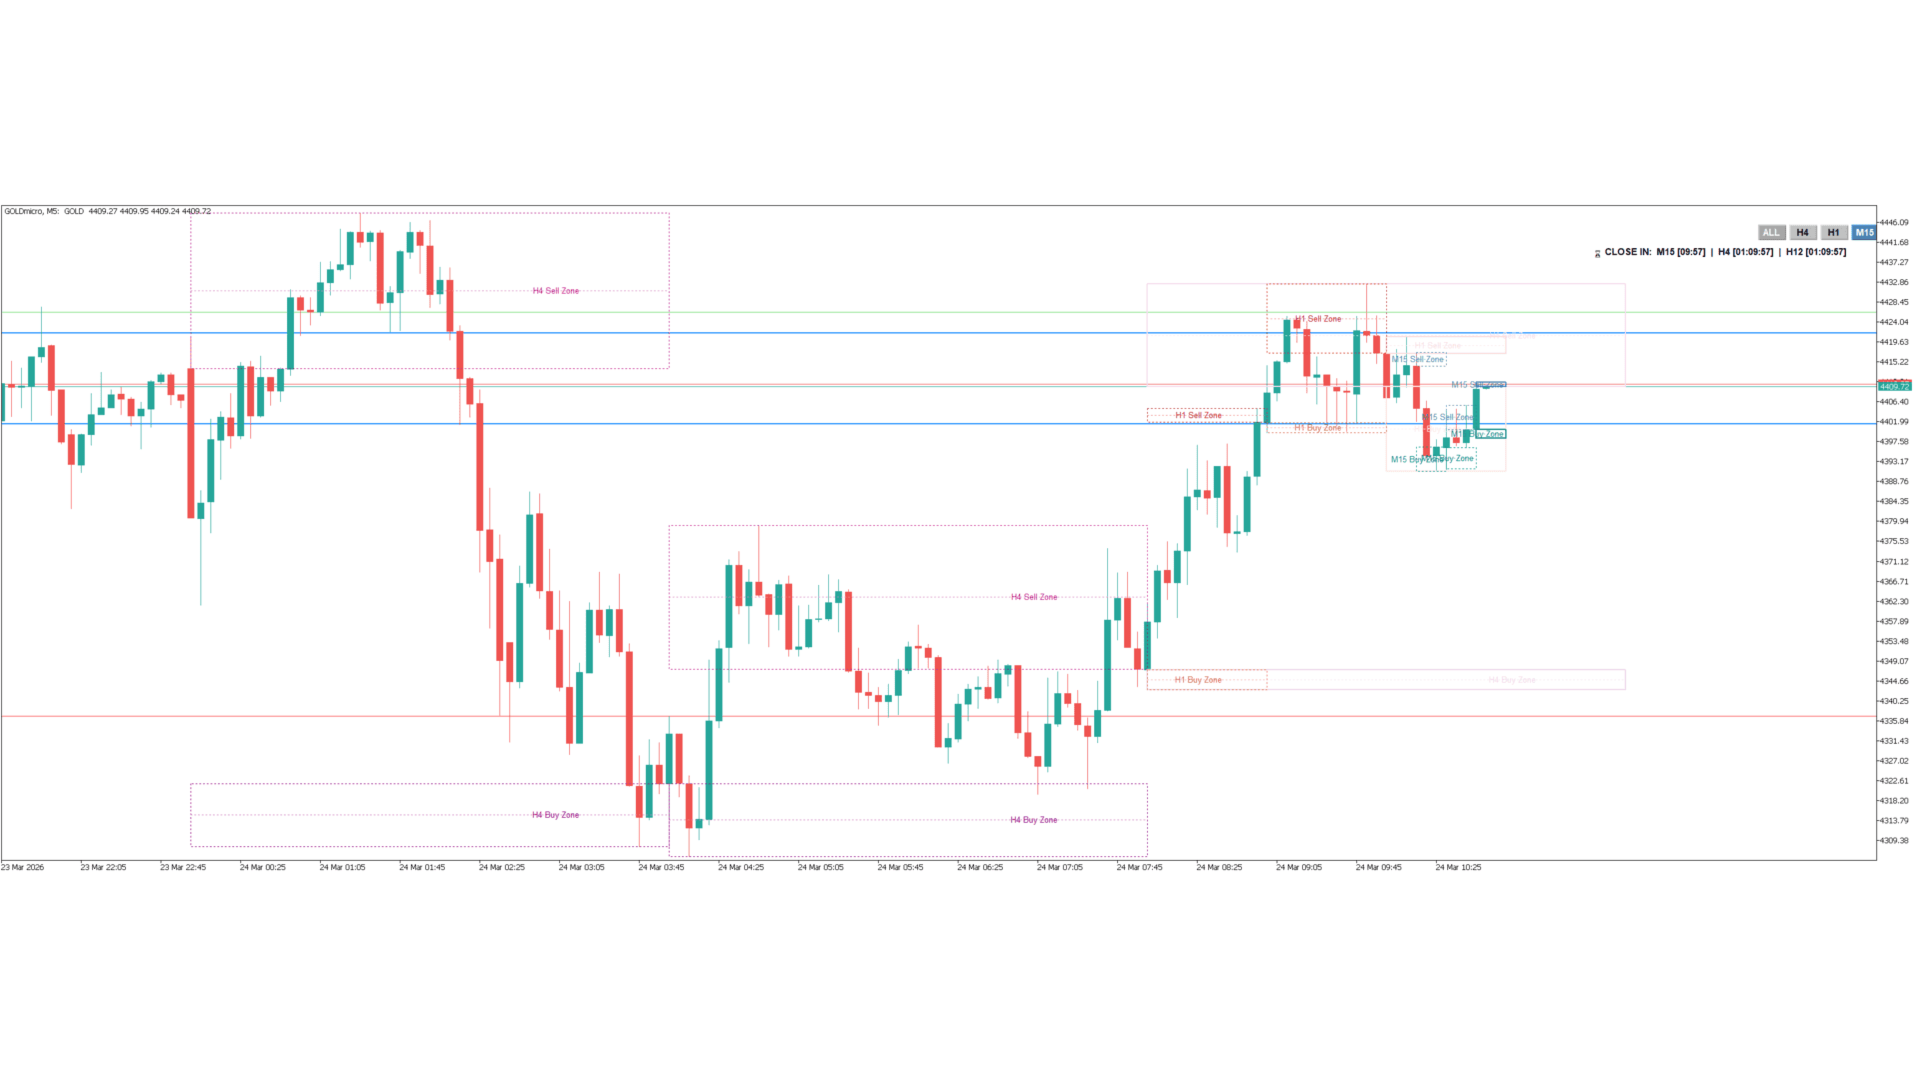
Scalping Dandruff est un indicateur de cartographie structurelle multi-trames temporelles conçu pour MetaTrader 5. Il trace automatiquement les zones clés de support et de résistance horizontales en fonction de Procédures Opérationnelles Standard (SOP) spécifiques basées sur le temps. En identifiant les plus hauts et les plus bas extrêmes pendant des fenêtres intraday spécifiques, l'indicateur projette ces niveaux vers l'avant pour aider les traders à visualiser la structure macro du marché directement sur leurs unités de temps d'exécution.

Fonctionnalités Principales :

  • Isolation Stricte des Mèches (Wick Isolation) : Au lieu de dessiner des blocs massifs qui encombrent le graphique, l'indicateur dessine des zones avec précision depuis le corps de la bougie (ouverture/clôture) jusqu'à l'extrême de la mèche (haut ou bas). Cela maintient votre graphique propre et met strictement en évidence les zones de rejet.

  • Technologie de Masquage Intelligent (Smart Ghosting) : Lorsque vous vous concentrez sur des trames temporelles inférieures comme le M15, les macro-zones superposées (H1 et H4) s'estompent automatiquement pour ne pas bloquer l'action des prix active. Les macro-zones historiques à gauche de l'action des prix restent entièrement visibles pour référence structurelle.

  • Suivi d'Équilibre (Equilibrium) : L'indicateur calcule et trace automatiquement une ligne médiane en pointillés (Équilibre à 50 %) à l'intérieur de chaque zone d'Achat et de Vente pour aider à identifier les niveaux de réaction précis.

  • Contrôles GUI Interactifs : Basculez instantanément la visibilité des structures H4, H1 ou M15 à l'aide de boutons intégrés et non intrusifs sur le graphique. Le M15 est défini comme focus par défaut au démarrage pour une clarté immédiate.

  • Étiquettes Décalées Dynamiques : Les étiquettes textuelles des zones sont dynamiquement alignées à droite et décalées. Cela garantit que les étiquettes H4, H1 et M15 ne se chevauchent jamais et ne se heurtent pas sur le bord droit de votre écran.

  • Minuteurs de Bougies Intégrés : Comprend un compte à rebours minimaliste ancré dans le coin pour les clôtures de bougies M15, H4, H12 et D1 afin de vous assister dans le timing intraday.

Personnalisation et Paramètres :

  • Synchronisation de l'Heure du Courtier : Ajustez facilement les heures des SOP dans les paramètres pour aligner l'heure du serveur de votre courtier avec les fenêtres cibles de la session de New York.

  • Paramètres Visuels : Personnalisez entièrement les couleurs de tous les rayons de trames temporelles, des boîtes de résistance et des boîtes de support pour qu'ils correspondent parfaitement à votre modèle de graphique personnel.

  • Limites de Zones : Contrôlez exactement combien de zones historiques sont dessinées sur le graphique pour maintenir des performances élevées du terminal et réduire la fatigue visuelle.

Support : Pour toute question, aide à la configuration ou assistance technique, veuillez me contacter directement via le système de messagerie privée intégré de MQL5.

Produits recommandés
Signal Eskiya, in addition to channel lines, reflects entry signals in the form of arrows. Trading strategies using the channel indicator belong to the classic methods of technical analysis, are easy to execute, and therefore available even to beginners. Price ranges work equally well on any trading assets and timeframes, they can be used both independently and with additional confirmation from oscillators and market volumes. American traders say: “Trend is your friend”, which means “Trend is
Moving pivot Average Fibonacci The  indicator compares the selected period with its counterpart from the previous period. The indicator determines the moving Fibonacci levels for the day or any time interval to assess the price movement range from the time average. The indicator helps predict the expected high or low for the day based on historical time data. The pivot line can be considered an average trend line and use it in a variety of trading strategies. If you have any question about the
Cet indicateur de tableau de bord d'offre et de demande à plusieurs périodes et à plusieurs symboles envoie des alertes lorsque le prix a atteint une zone d'offre/demande. Il est également possible de l'utiliser pour être alerté des doubles hauts/bas réguliers au lieu des zones. Il peut être utilisé avec toutes les plages horaires de M1 à MN.       Un maximum de 9 périodes peuvent être affichées dans le tableau de bord en même temps.   Il est possible d'utiliser des filtres RSI, divergence (MACD
Projection of Phi
Nestor Jose Mendez Boza
Projection of Phi   Is a technical indicator that calculates dynamic support and resistance levels. It uses angular geometric projections and mathematical ratios to identify market expansion ranges. Features: Dynamic Fibonacci Expansion: Extension level projection Geometric Calculation: Angular analysis and mathematical ratios Visualization: Graphical objects with informative labels Compatibility: M1 to H4 timeframes Applications: Identification of zones for trade management Analysis of volatil
Multichart V and H Line Sync Overview Multichart V and H Line Sync is the essential tool for multi-timeframe traders. It instantly synchronizes your Horizontal Support/Resistance Lines and Vertical Time Lines across all open charts of the same symbol. Stop drawing the same levels on M5, H1, and D1 charts manually. With this tool, draw a line once, and it automatically replicates on every other timeframe. Perfect for keeping your technical analysis consistent and your workspace clean. Key Feature
FREE
mql4 version:  https://www.mql5.com/en/market/product/44606   Simple indicator to calculate profit on fibonacci retracement levels with fixed lot size, or calculate lot size on fibonacci levels with fixed profit. Add to chart and move trend line to set the fibonacci retracement levels. Works similar as default fibonacci retracement line study in Metatrader. Inputs Fixed  - select what value will be fix, lot or profit Fixed value  - value that will be fix on all levels Levels  - levels for which
Adaptive SR Zones – Breakout Edition Adaptive SR Zones is a next-generation MetaTrader 5 indicator that automatically maps support and resistance zones and tracks breakout activity in real time. Designed for traders who rely on market structure and zone confluence, it combines multi-timeframe analysis , breakout confirmation logic , and customizable alerts into one powerful tool. No repainting. Core Features Dynamic Support & Resistance Mapping Detects zones from swing highs/lows and reaction po
Considering the main theories of Forex (Dow Theory, support lines, chart patterns, and Fibonacci retracements), It tells you the price range where whales (large investors) are likely to appear. You can trade at the price points that professionals also aim for. You no longer have to warry about where to aim next. We are live-streaming the actual operation of the system. Please check for yourself if it is usable. Please check it out for yourself. https://www.youtube.com/@ganesha_forex We do not
Liquidity Map
Alex Amuyunzu Raymond
Liquidity Map  Overview The Liquidity Map indicator is an advanced visualization tool based on ICT Smart Money Concepts . It automatically identifies daily Buy Zones , Sell Zones , and Liquidity Levels , showing where price is likely to reverse or continue based on institutional order flow. It calculates key levels from the daily session — such as the previous day’s high, low, and midpoint — then derives a premium (sell bias) and discount (buy bias) structure. When price trades into these mapped
Probability Range Bands
Florian Nuebling
5 (1)
The indicator ‘Probability Range Bands’ gives a prediction of the amount, how much the asset is moving from its current price. The range bands give probabilities, that the candle close will not exceed this certain price level. It is also called the expected move for the current candle close.   This Indicator is based on statistical methods, probabilities and volatility. Asset price is assumed to follow a log-normal distribution. Therefore, log returns are used in this indicator to determine the
LR Pivots Combo Statistics That Show You Where the Market Stands! Key Features (updated V2.1) 1. Auto-Plotting Linear Regression Channel Trend Direction — Uses slope (normalized by ATR) to identify whether the market is in an uptrend, downtrend, or ranging sideways. Trend Quality (R-Squared) — Tells you if the trend is statistically consistent (Stable) or just noise (Volatile). Useful for filtering out unreliable setups. Standard Deviation Bands — Shows how far price has deviated from the regre
FREE
ReSu mt5
Daniel Opoku
The Wamek Support and Resistant (WSR) Indicator is a remarkable tool that stands out in the world of technical analysis. It sets itself apart by cleverly combining price action and leading indicators to delineate support and resistance levels with a high degree of accuracy. Its unique feature is its adaptability; users can fine-tune the indicator by adjusting input parameters, enabling them to create customized support and resistance levels that suit their trading strategies. Notably, one of WSR
PROB MULTI-TF INSTITUCIONAL Probabilidad Operativa Multitemporal con Confirmación Estructural PROB MULTI-TF INSTITUTIONAL es un indicador avanzado diseñado para traders que buscan operar con confirmación estructural real, sin señales aisladas. El sistema analiza simultáneamente múltiples temporalidades y calcula un Global Bias porcentual , mostrando de forma clara cuándo el mercado presenta mayor probabilidad de: Compra (BUY) Venta (SELL) Neutralidad (WAIT) ¿Cómo funciona? El indica
L'indicateur Projection par BCB Elevate est un outil complet et professionnel d'analyse de la structure du marché et de suivi de tendance. Conçu pour les traders manuels, il combine un filtrage de la macro-tendance (EMA 100), des trailing stops dynamiques basés sur l'ATR et le suivi des pivots Swing High/Low pour fournir des signaux de graphique très précis. Plutôt que de repaint ou d'encombrer votre graphique, l'indicateur Projection attend l'alignement strict des conditions avant de tracer les
Linha de Variacao de Preco
Renato Fabio Santos Vasconcelos
ENGLISH VERSION PRICE VARIATION LINE – TAKE CONTROL OF THE MARKET! Turn the opening price into your strategic weapon Clearly see how many points or % the market moved Auto horizontal lines at the levels YOU define Mark entry, exit, target zones and explosive regions Clean, sharp, and professional layout Simple, powerful, and essential for any serious trader
On-Balance Volume (OBV) is a technical indicator that relates volume and price to identify price movements. The basic idea behind OBV is that changes in volume generally precede price changes. The indicator accumulates volumes for periods when the price closes higher and subtracts volumes for periods when the price closes lower. This results in a value used to identify the direction of the asset's trend. The interpretation of the OBV is simple: a rising OBV suggests that buyers are willing to
+++++++++++++++++++++++++++++++++++++++++++++++++++++++++++++++++++++++++++++++++++++++++++++++++ +++ Link to EURUSD Only Free Version -->  https://www.mql5.com/en/market/product/156904?source=Unknown +++++++++++++++++++++++++++++++++++++++++++++++++++++++++++++++++++++++++++++++++++++++++++++++++ Hallo Trader, This is a traditional GANN & FIBONACCI strategy based on detection of an impulsive move in the opposite direction. This is called a Breakout. At the moment of Breakout, the indicator draw
Rtc ML Ai Predictor
Muhammad Faisal Sagala
Rtc ML Ai | Predictor CORE MACHINE LEARNING ENGINE Adaptive ML Market Predictor – Multi-Bar Trend & Candle Forecast What This Indicator Does This indicator is a  real-time market prediction engine  designed to analyze price behavior and estimate  future market tendencies . Unlike conventional indicators, this system  does not rely on static parameters or historical curve-fitting , but adapts its internal state dynamically during live market operation. Instead of using static rules, the indic
Adaptive Fibonacci Trend Zones is an MT5 indicator built for traders who want a clean structure-based Fibonacci workflow without constantly redrawing anchors by hand. The indicator automatically detects the dominant swing, builds the active Fibonacci map, projects trade-map zones and adapts its behavior across scalp, intraday and swing conditions. Instead of leaving outdated levels on the chart when structure changes, the indicator can disable the active trade map and wait for a new anchor. T
Frontier Pivots
Nestor Jose Mendez Boza
FRONTIER PIVOTS - Geometric Levels Indicator This indicator plots support and resistance levels/ranges on the chart using mathematical calculations. It helps traders identify potential price reaction zones based on geometric patterns. Main Features: Automatically calculates and displays key price levels Plots both support and resistance lines Uses daily price data for level calculation Clean visual presentation with different colors for different level types No repainting - levels remain static
Les structures de marché sont celles qui, lorsqu'elles éclatent dans un délai plus long, peuvent aider à dégager une tendance pour un commerçant. 1. Cet indicateur attirera ZigZag sur les 2 dernières structures (haut et bas précédents de ZigZag) et une nouvelle barre de ZigZag ne sera formée que lorsque la rupture de la structure se produira 2. Il donne une notification Terminal et Push en cas de rupture de structure 3. Augmentez et diminuez la profondeur de ZigZag à partir des touches [ et ]
SmartTrendMA
Jhones Jorente Garcia
A SmartTrendMA foi projetada para identificar melhor zonas de alta, baixa e consolidação, azul alta, vermelho baixa e branco consolidação, vai te auxiliar a identificar melhor a tendência. Em parâmetro regule melhor conforme sua preferência em grau pois cada par de moeda se adequa diferentemente a cor,mude também o período e se quiser mude exponencial ou simples. 
O Alexxander Autotrader é seu robô especialista em trade em minidólar WDO na bolsa brasileira B3. Com estratégia única, o robô já está configurado para operar minidólar na abertura do pregão, operando em fechamentos de gaps principalmente. O robô também pode ser otimizado para operar além do horário de abertura. Alem disso, o robô pode ser configurado com trailling stop, horários de trades e tipo de stop, se fixo ou dinâmico. OBS: alterar o parâmetro BR1 para BR.
Quarter EMA
Jithin Sajan Sajan
Kindly rate and comment about the product for upgradation & Support The 5 EMA is plotted in green color ( Lime ). The 14 EMA is plotted in red color ( Red ). The 20 EMA is plotted in blue color ( Blue ). The 200 EMA is plotted in yellow color ( Yellow ). The Quarter EMA that provided calculates and plots four Exponential Moving Averages (EMAs) on the chart using different periods: 5, 14, 20, and 200. Each EMA is represented by a different color on the chart. Here's a description of each EMA:
Quintet EMA
Jithin Sajan Sajan
Kindly rate and comment about the product for upgradation & Support The   5 EMA   is plotted in   green   color ( Lime ). The  14 EMA  is plotted in  red  color ( Red ). The   20 EMA   is plotted in   blue   color ( Blue ). The  200 EMA  is plotted in  black  color ( Black ). The   200 EMA   is plotted in   yellow   color ( Yellow ). The Quarter EMA that provided calculates and plots four Exponential Moving Averages (EMAs) on the chart using different periods: 5, 14, 20, and 200. Each EMA is
Turpial Pullback
Arlos Elias Rivas Romero
Indicator Type Strategy (Pullback) for all Symbols and Periodicity, Preferably from 30M periodicity. Can be used for manual trading. Its workspace corresponds to channel of 3 bars of Bill Willians. Also relies on the indicator Rsi and Atr. BUY when: There is a Green Arrow STOPLOSS to buy, below the bottom line of the channel (red line)" SELL when: There is a Red Arrow. STOPLOSS to sell, above the upper line of the channel (blue line)
BCSpikes
Shamsul Arfeen
Modern Spike Indicator Features: 1. Support and Resistance Lines: Displays dynamic horizontal dashed lines on the chart representing current support and resistance levels calculated from recent price swings. 2. Spike Detection Arrows: Shows up arrows (green) for potential upward spikes and down arrows (red) for potential downward spikes, triggered when price breaks S/R levels with RSI confirmation. 3. Trend Analysis: Incorporates ADX (Average Directional Index) to determine market trend stre
IKAN MFX In the volatile world of financial markets, finding the best trading opportunities and minimizing risks is always a significant challenge for every investor. That’s why we developed IKAN (Intelligent Knowledge Automated Navigator) , an advanced automated trading system. IKAN is not just a tool but a perfect combination of artificial intelligence and years of trading experience. With the ability to analyze millions of data points per second, IKAN can identify market trends, predict price
Title: Dynamic SR Levels Pro Short Description: A next-generation, multi-timeframe Support & Resistance indicator that automatically detects, adapts, and invalidates key price zones based on real-time market volatility. Stop guessing, start seeing. Full Description: Tired of manually drawing support and resistance lines that quickly become outdated? Dynamic SR Levels Pro is the ultimate solution for traders who demand precision, adaptability, and a clean, clutter-free chart. This is not just ano
Les acheteurs de ce produit ont également acheté
ARIPoint
Temirlan Kdyrkhan
ARIPoint is a powerful trading companion designed to generate high-probability entry signals with dynamic TP/SL/DP levels based on volatility. Built-in performance tracking shows win/loss stats, PP1/PP2 hits, and success rates all updated live. Key Features: Buy/Sell signals with adaptive volatility bands Real-time TP/SL/DP levels based on ATR Built-in MA Filter with optional ATR/StdDev volatility Performance stats panel (Success, Profit/Loss, PP1/PP2) Alerts via popup, sound, push, or email Cu
SignalTech MT5 is a fully rule based trading system for EURUSD, USDCHF, USDJPY, AUDUSD, NZDUSD, EURJPY, AUDJPY, NZDJPY, CADJPY.  All the winning trades with chart setups are published on the comments page. 2025-12 1174 Pips 2026-01 2624 Pips 2026-02 2937 Pips 2026-03 2165 Pips 2026-04 2243 Pips It can generate signals with Buy/Sell Arrows and Pop-Up/Sound Alerts. Each signal has clear Entry and Stop Loss levels, which should be automatically flagged on the chart, as well as potential Targets 1,
RelicusRoad Pro MT5
Relicus LLC
4.96 (24)
RelicusRoad Pro : Système d'Exploitation Quantitatif du Marché 70% DE RÉDUCTION ACCÈS À VIE (DURÉE LIMITÉE) - REJOIGNEZ 2 000+ TRADERS Pourquoi la plupart des traders échouent-ils même avec des indicateurs "parfaits" ? Parce qu'ils tradent des concepts isolés dans le vide. Un signal sans contexte est un pari. Pour gagner, il faut de la CONFLUENCE . RelicusRoad Pro est un Écosystème Quantitatif complet . Il cartographie la "Fair Value Road", distinguant le bruit des cassures structurelles. Arrête
Détecteur intelligent multicouche de cassure et de retracement pour MetaTrader 5 « Intelligent. Simple. Rapide ! » Vous en avez assez de rater des entrées sur cassure à haute probabilité ? Passez-vous des heures à analyser de nombreux graphiques pour aligner les cassures avec la direction de la tendance et le momentum des devises — pour finalement manquer le mouvement ? Break Pullback résout tout cela en un seul indicateur. Qu'est-ce que Break Pullback ? Break Pullback est un indicateur MetaTr
Azimuth Pro
Ottaviano De Cicco
5 (7)
Azimuth Pro V2: Synthetic Fractal Structure and Confirmed Entries for MT5 Overview Azimuth Pro is a multi-level swing structure indicator by Merkava Labs . Four nested swing layers, swing-anchored VWAP, ABC pattern detection, three-timeframe structural filtering, and closed-bar confirmed entries — one chart, one workflow from micro-swings to macro-cycles. This is not a blind signal product. It is a structure-first workflow for traders who care about location, context, and timing. V2 Launch Offe
Tout d'abord, il convient de souligner que cet outil de trading est un indicateur non repeint, non redessiné et non retardé, ce qui le rend idéal pour le trading professionnel. Cours en ligne, manuel utilisateur et démonstration. L'indicateur Smart Price Action Concepts est un outil très puissant à la fois pour les nouveaux et les traders expérimentés. Il regroupe plus de 20 indicateurs utiles en un seul, combinant des idées de trading avancées telles que l'analyse du trader Inner Circle et le
OmniSync Projection
Antonio-alin Teculescu
5 (1)
Chronos Fractal Engine is an innovative price projection indicator for MetaTrader 5, designed to transform your technical analysis by intelligently identifying and projecting historical price patterns. Built upon an advanced correlation algorithm and the fractal principles of the market, this powerful tool visualizes potential future price movements, giving you a unique edge in your trading decisions. What is Chronos Fractal Engine? At its core, the Chronos Fractal Engine employs a sophisticat
KT Alpha Hunter Arrows MT5
KEENBASE SOFTWARE SOLUTIONS
La plupart des indicateurs à flèches vous donnent un signal, puis vous laissent gérer tout le reste seul. KT Alpha Hunter Arrows vous fournit un plan de trading complet. Chaque flèche de signal apparaît avec un plan complet déjà tracé : ligne d’entrée, stop loss, quatre niveaux de take profit et un verdict d’edge en temps réel qui vous indique si ce symbole et cette unité de temps valent la peine d’être tradés maintenant. Le Trade Manager EA inclus prend en charge l’exécution après votre entrée,
The Zone Trading Indicator is a technical analysis tool for MetaTrader 5 that automatically identifies and displays tradable price zones across multiple timeframes to assist with structured market analysis. The indicator plots Monthly, Weekly, Daily, and H4 tradable zones , allowing traders to view higher- and lower-timeframe price areas simultaneously. These zones are designed to support one-candle–based entry approaches by highlighting predefined areas where price interaction may be monitored.
ARICoins
Temirlan Kdyrkhan
ARICoin is a powerful trading companion designed to generate high-probability entry signals with dynamic TP/SL/DP levels based on volatility. Built-in performance tracking shows win/loss stats, PP1/PP2 hits, and success rates all updated live. Key Features: Buy/Sell signals with adaptive volatility bands Real-time TP/SL/DP levels based on ATR Built-in MA Filter with optional ATR/StdDev volatility Performance stats panel (Success, Profit/Loss, PP1/PP2) Alerts via popup, sound, push, or email Cust
==================================================================== SMC Pro v6.1 APEX AI — XAUUSD Gold Empire MetaTrader 5 Indicator · Smart Money Concepts · Predictive Intelligence Engine ==================================================================== SMC Pro v6.1 APEX AI is a professional Smart Money Concepts indicator system built exclusively for XAUUSD (Gold) on MetaTrader 5. It combines the complete SMC framework — Order Blocks, Liquidity sweeps, Fair Value Gaps, Break of Structure,
Meravith MT5
Ivan Stefanov
5 (1)
Outil des market makers. Meravith va : Analyser toutes les unités de temps et afficher la tendance actuellement en vigueur. Mettre en évidence les zones de liquidité (équilibre des volumes) où le volume haussier et baissier est égal. Afficher tous les niveaux de liquidité provenant de différentes unités de temps directement sur votre graphique. Générer et présenter une analyse de marché sous forme de texte pour votre référence. Calculer les objectifs, les niveaux de support et les points de stop
L'indicateur « Dynamic Scalper System MT5 » est conçu pour la méthode de scalping, permettant de trader au sein des vagues de tendance. Testé sur les principales paires de devises et l'or, il est compatible avec d'autres instruments de trading. Fournit des signaux pour l'ouverture de positions à court terme le long de la tendance, avec un support supplémentaire pour les fluctuations de prix. Principe de l'indicateur : De grandes flèches déterminent la direction de la tendance. Un algorithme de
L'indicateur UZFX {SSS} Scalping Smart Signals MT5 est un indicateur de trading haute performance sans redessin, conçu pour les scalpers, les day traders et les swing traders qui recherchent des signaux précis et en temps réel sur des marchés très volatils. Développé par (UZFX-LABS), cet indicateur combine l'analyse de l'action des prix, la confirmation de tendance et un filtrage intelligent pour générer des signaux d'achat et de vente à forte probabilité sur toutes les paires de devises et tous
Assembler
Darko Licardo
5 (1)
Introducing Assembler:  The best value for money,  Designed for advanced traders and professionals, yet accessible for ambitious beginners ready to elevate their trading game. Great for ICT, SMC, TREND and breakout traders . Combining advanced analytics, a sleek graphical interface, and highly customizable features, Assembler empowers you to trade with precision, clarity, and confidence. Key Features of Assembler 1. Dynamic Graphical User Interface (GUI): A fully draggable, customizable interf
AriX
Temirlan Kdyrkhan
1 (4)
AriX Indicator for MT5 A powerful trend-following and signal-evaluation tool AriX is a custom MT5 indicator that combines Moving Averages and ATR-based risk/reward logic to generate clear buy/sell signals. It visualizes dynamic SL/TP levels, evaluates past trade outcomes, and displays win/loss statistics in a clean on-chart panel. Key features include: Buy/Sell signals based on MA crossovers ATR-based SL/TP1/TP2/TP3 levels with visual lines and labels Signal outcome tracking with real-time stat
MightyPips Sentiment Pro is an advanced market sentiment analysis indicator for MetaTrader 5, designed to help traders better understand who is in control of the market by analyzing buying and selling pressure. Instead of relying on price alone, this indicator focuses on sentiment dynamics , comparing institutional-style buying and selling behavior against retail market activity to highlight potential trend strength, exhaustion, and directional bias. What MightyPips Sentiment Pro Does MightyP
Ziva LSE System
Hassan Abdullah Hassan Al Balushi
ZIVA LSE System A Professional Liquidity & Structure Execution Framework Executive Overview ZIVA LSE System is a professionally engineered analytical framework designed to interpret market behavior through structural logic and liquidity dynamics. It is not positioned as a conventional indicator. Rather, it functions as a structured execution environment that organizes price action into a clear, disciplined decision-making model. The system is built to deliver consistency, clarity, and controlled
Scalping Winning Signals Pro SWS
Muhammad Usman Siddique
5 (1)
UZFX SWS {Scalping Winning Signals} Pro v1.0 est un indicateur puissant et sans repeinture développé par Usman Zabir (UZFX LABS) spécialement pour les scalpers, les day traders et les swing traders à la recherche de signaux d'entrée précis sur des marchés en évolution rapide. Idéal pour les traders qui exigent des signaux fiables en temps réel, sans décalage ni fausses repeintures. MES MEILLEURS DÉLAIS RECOMMANDÉS* : 30 MINUTES ET PLUS. {1H} EST MON PRÉFÉRÉ. ET LES RÉSULTATS SONT ÉPOUSTOUFLANTS
MATADOR GOLD — XAUUSD M5 ( TimeFrame M5 ) Scalp Signals for MT5 Strategy Tester Visualization Video https://youtu.be/_cWbbyg2RSs Not every move deserves a signal. MATADOR GOLD was built for traders who prefer selective, structured, high-quality decision support over noisy, hyperactive signal tools. Designed specifically for Gold (XAUUSD / GOLD) on M5 , MATADOR helps you read short-term momentum with more discipline by combining trend logic, market-condition filters, momentum timing, spread pro
Presenting one-of-a-kind Gann Indicator for XAUUSD IQ Gold Gann Levels is a non-repainting, precision tool designed exclusively for XAUUSD/Gold intraday trading. It uses W.D. Gann’s square root method to plot real-time support and resistance levels, helping traders spot high-probability entries with confidence and clarity. William Delbert Gann (W.D. Gann) was an exceptional market analyst whose trading technique was based on a complex blend of mathematics, geometry, astrology, and ancient calcul
The Propfolio Master Suite is the ultimate all-in-one analytical workstation for professional traders. Combining the power of the Beat The Market Maker (BTMM) methodology, Smart Money Concepts (SND/Liquidity), and Advanced Volume Profile, this suite replaces multiple different indicators with one optimized engine. Monitor up to 14 pairs simultaneously from a single chart, instantly identify market cycles, and seamlessly map institutional footprints with the click of a button. The Command Center
Pantera Indicator
Temirlan Kdyrkhan
5 (1)
A tool for on-chart strategy backtesting and performance analysis. A utility for developing, debugging, and testing custom trading ideas and indicator functions. An indicator designed to quickly test trading concepts and visualize the effectiveness of different input parameters. An all-in-one sandbox for testing everything from simple crossovers to complex, multi-condition trading systems.
Niveaux mensuels + PinBar + Marubozu + ALERTES (MT5) Version : 2.0 FINAL Auteur : KOUAME N'DA LEMISSA Aperçu Cet indicateur pour MetaTrader 5 propose une analyse structurée du marché basée sur les niveaux mensuels, la détection des chiffres de chandeliers japonais, ainsi qu'un système d'alertes en temps réel. Il aide le trader à identifier les zones clés du marché et les réactions potentielles du prix à partir de signaux techniques objectifs. Fonctionnalités principales Niveaux mensuels automa
Owl Smart Levels MT5
Sergey Ermolov
4.03 (32)
Lors du trading dans le sens de la tendance, la principale difficulté n’est pas de trouver un niveau, mais de comprendre où une entrée est réellement valide. Le prix réagit souvent aux niveaux, mais ne parvient pas à poursuivre le mouvement — ce qui entraîne des entrées erronées ou des opportunités manquées. Owl Smart Levels ne se contente pas d’afficher des niveaux , mais des zones formées à partir de la structure du marché et des retracements. Cela permet d’évaluer les points d’entrée différem
L’indicateur met en évidence les zones où un intérêt est déclaré sur le marché , puis montre la zone d’accumulation des ordres . Il fonctionne comme un carnet d’ordres à grande échelle . C’est l’indicateur destiné aux grands capitaux . Ses performances sont exceptionnelles. Quel que soit l’intérêt présent sur le marché, vous le verrez clairement . (Il s’agit d’une version entièrement réécrite et automatisée – l’analyse manuelle n’est plus nécessaire.) La vitesse de transaction est un indicateur
TrendMaestro5
Stefano Frisetti
note: this indicator is for METATRADER4, if you want the version for METATRADER5 this is the link:  https://www.mql5.com/it/market/product/108106 TRENDMAESTRO ver 2.5 TRENDMAESTRO recognizes a new TREND from the start, he never makes mistakes. The certainty of identifying a new TREND is priceless. DESCRIPTION TRENDMAESTRO identifies a new TREND in the bud, this indicator examines the volatility, volumes and momentum to identify the moment in which there is an explosion of one or more of these da
Moon Cycle
Navdeep Singh Kaur
Indicateur technique utilisant l'algorithme astronomique de Jean Meeus pour afficher les phases lunaires sur les graphiques de trading. Il présente une ligne courbe continue représentant le cycle lunaire avec une précision scientifique équivalente à celle des observatoires professionnels. Compatible avec tout symbole et toute unité de temps sur MT5, y compris le forex, les matières premières, les indices et les actions. Inclut un panneau d'information affichant la phase lunaire actuelle, le pou
TPA True Price Action indicator reveals the true price action of the market makers through 100% non-repainting signals strictly at the close of a candle! TPA shows entries and re-entries, every time the bulls are definitely stronger than the bears and vice versa. Not to confuse with red/green candles. The shift of power gets confirmed at the earliest stage and is ONE exit strategy of several. There are available now two free parts of the TPA User Guide for our customers. The first "The Basics"
IVISTscalp5
Vadym Zhukovskyi
5 (6)
iVISTscalp5 — Système de prévision du marché basé sur le temps iVISTscalp5 n’est pas un indicateur classique. C’est un système basé sur le timing pour MetaTrader 5, qui identifie quand le marché est le plus susceptible de bouger. ⸻ Fonctionnalités  • Timing précis  • Signaux BUY / SELL  • Potentiel de profit moyen  • Prévisions hebdomadaires  • 120+ instruments ⸻ Idée clé Le marché est influencé par le temps, pas seulement par le prix ⸻ iVISTscalp5 — Votre avantage temporel Nous vous
Filtrer:
Aucun avis
Répondre à l'avis