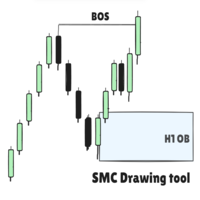
SMC Drawing tool
- Утилиты
- Версия: 2.6
- Обновлено: 12 ноября 2026
- Активации: 5

SMC Drawing Tool is a professional technical analysis indicator for MetaTrader 5, designed to enhance the Smart Money Concepts (SMC) trading methodology. It deeply integrates a comprehensive suite of drawing tools with an intelligent labeling system, and includes advanced features such as a floating toolbar, color panel, text templates, multi-timeframe display and chart synchronization. This tool is dedicated to streamlining a trader's markup process, enabling the quick and precise identification of key market structures and liquidity zones.
Due to limitations in MetaTrader 5, this indicator does not work in the Strategy Tester. To see it in action, you can download the demo version.
Product Features
The indicator provides a set of hotkey-driven core drawing tools, including the Trendline (Q key) for plotting trends and the Rectangle (A key), which is ideal for marking Order Blocks (OB) and Fair Value Gaps (FVG). It also integrates Fibonacci Retracement (Y key), the Fibonacci Channel (H key) and the Risk/Reward Tool (T key) to aid in identifying potential reversal zones and risk-to-reward ratios.
To complement the drawings, the tool features a smart labeling system, also triggered by hotkeys. You can easily mark critical market structure points such as Market Structure Shift (MSS), Break of Structure (BOS) and Inducement (IDM). It also clearly identifies Buy Side and Sell Side Liquidity (BSL/SSL), significant swing highs and lows, Order Blocks (OB) and Fair Value Gaps (FVG).
The preset texts for each label type can be edited in the indicator inputs. Multiple texts are separated by commas, and pressing the label hotkey cycles through the texts you have defined.
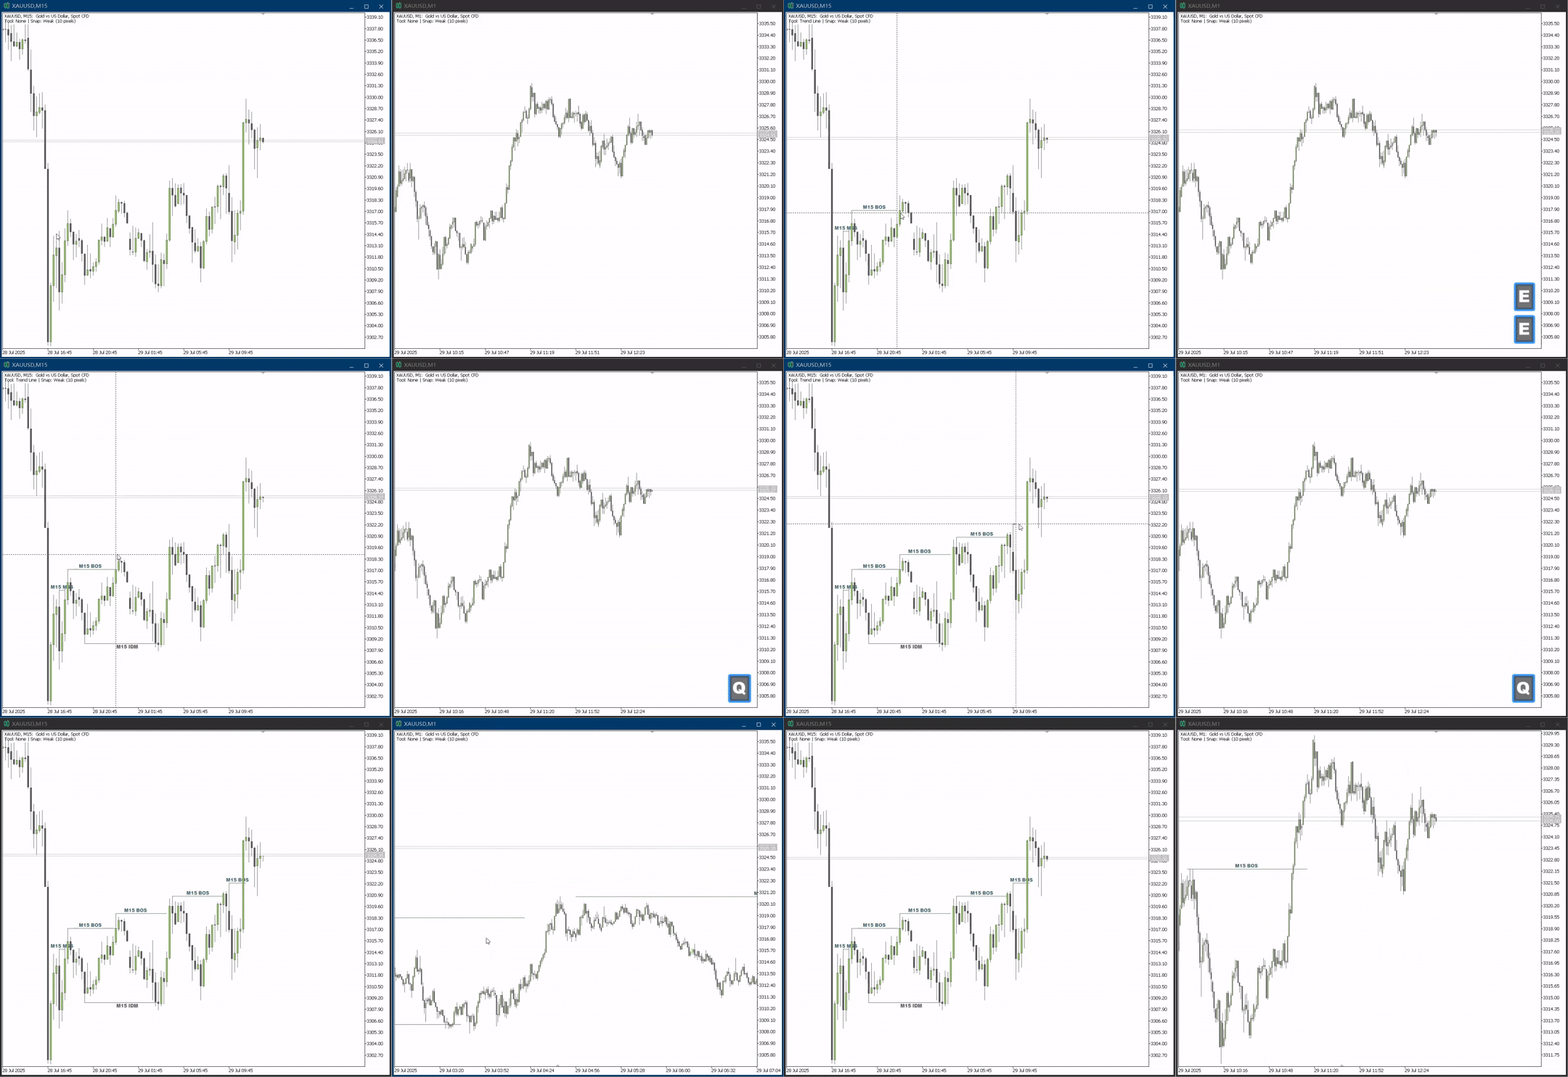
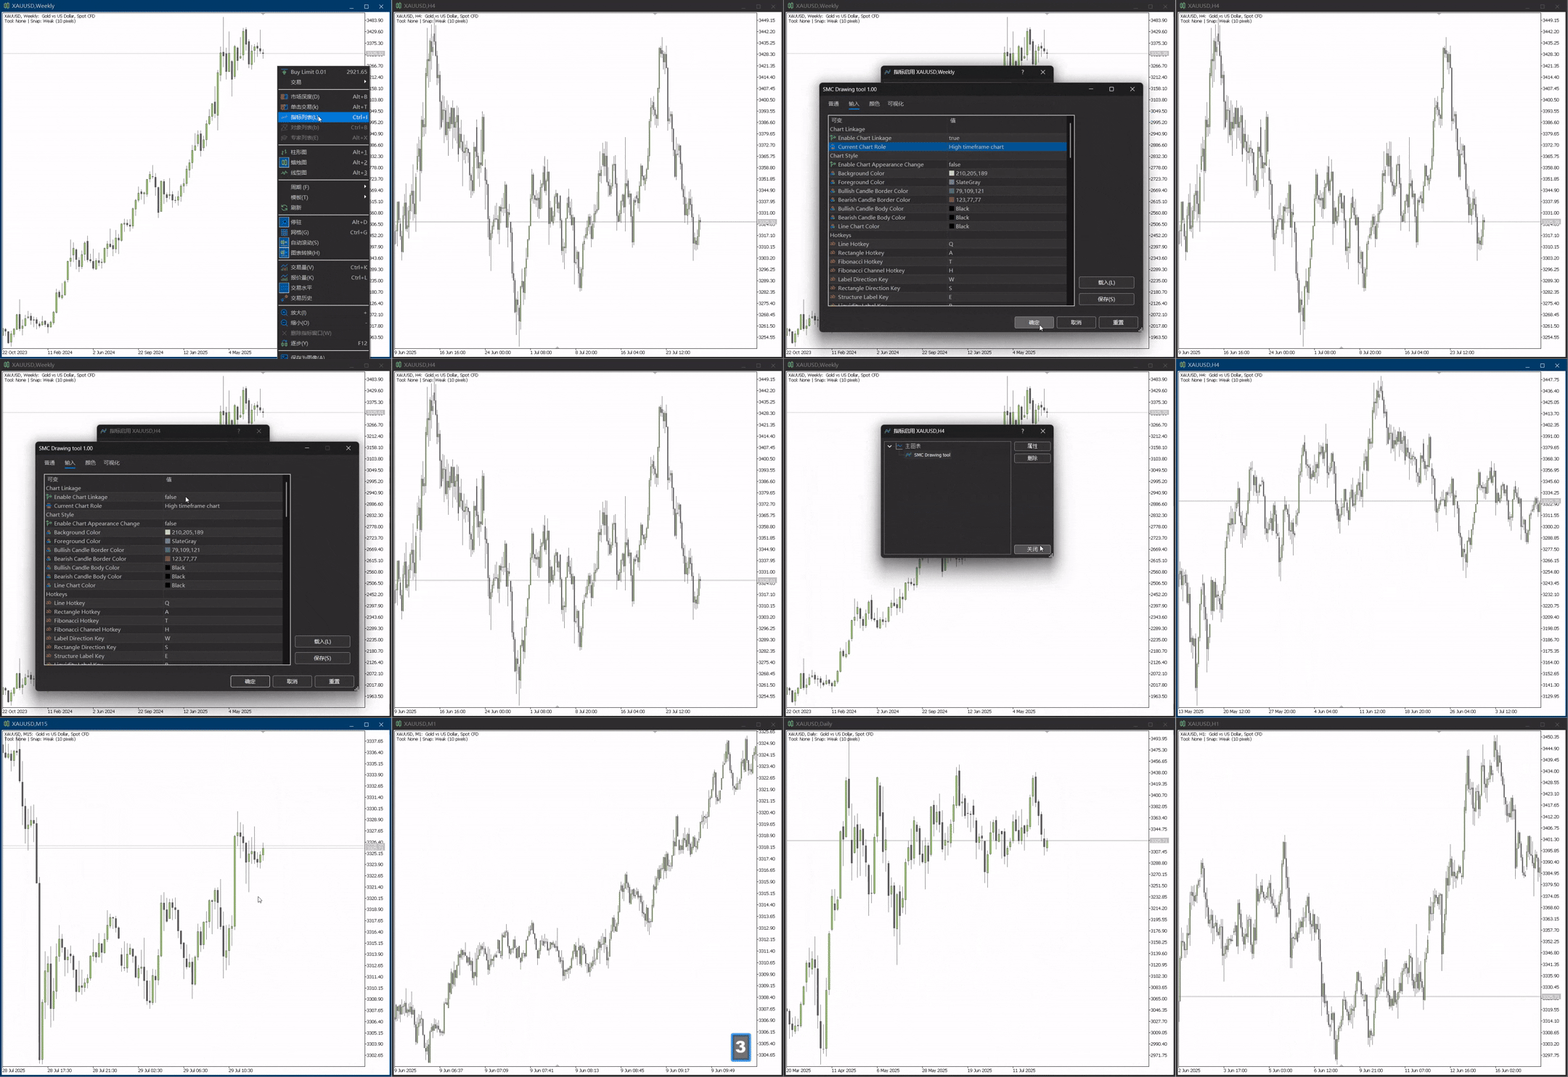
To enhance analytical efficiency, the indicator is equipped with several advanced capabilities. The Price Snap feature (G key) allows drawing objects to align automatically with key candle prices (High, Low, Open, Close). Multi-Timeframe Display ensures that objects drawn on a higher timeframe chart are rendered automatically on all lower timeframes, maintaining analytical consistency. Chart Synchronization keeps all objects in real time sync across multiple charts of the same symbol. Timeframe Linkage binds a higher and a lower timeframe chart, and the mapping from higher to lower timeframes is configurable, providing seamless analytical switching. The crosshair (X key) can be displayed in sync across charts of the same symbol, and Chart Navigation (Z key) positions all charts of that symbol at the same point in time.
We prioritize user experience and personalization. Users can edit label text directly by holding the Alt key and clicking an object, and can adjust colors, text and line styles through the floating toolbar. From drawing tools to labels and functions, all hotkeys are fully customizable, allowing you to build a workflow that best suits your needs. The indicator also offers complete style configuration options, including colors, line widths and font sizes for all drawing objects and labels. The structure, liquidity, order block and fair value gap label types each have their own independent font size setting. The toolbar position is remembered automatically, and text templates and custom colors persist between sessions. After configuring your setup, the Save Chart Template (P key) function saves your workspace with a single keystroke.
Visual Editing
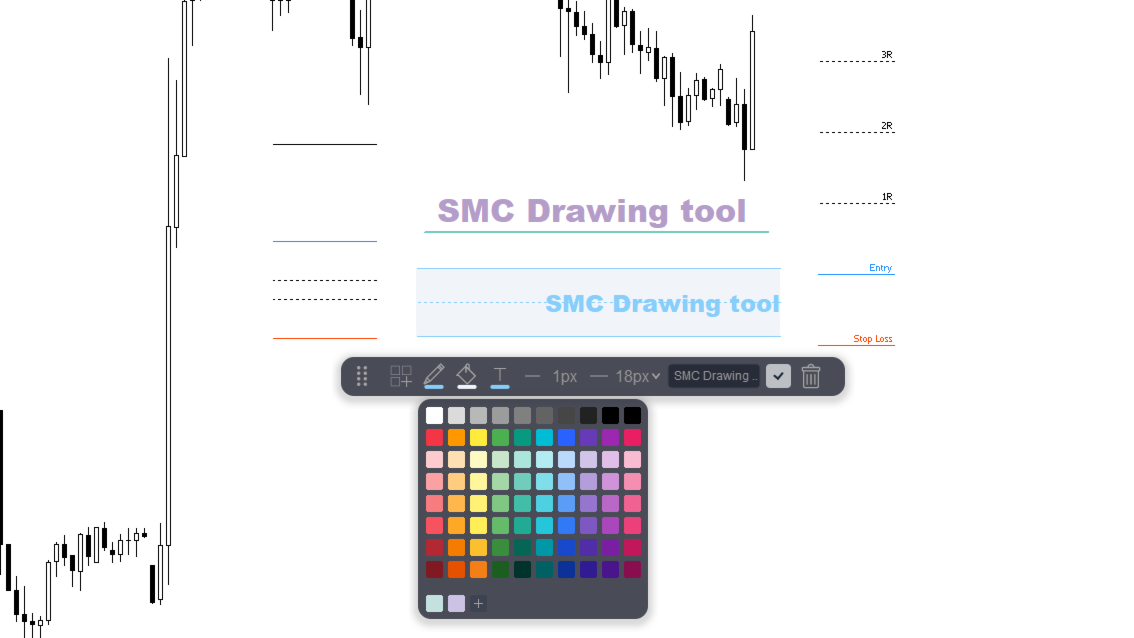
Floating Toolbar. Hold the Alt key and click any drawn object to open a toolbar next to it. The toolbar allows you to change colors, edit text, adjust line width and style, and delete the object without memorizing hotkeys. The layout switches automatically between a structure line toolbar and a rectangle toolbar, depending on the object type.
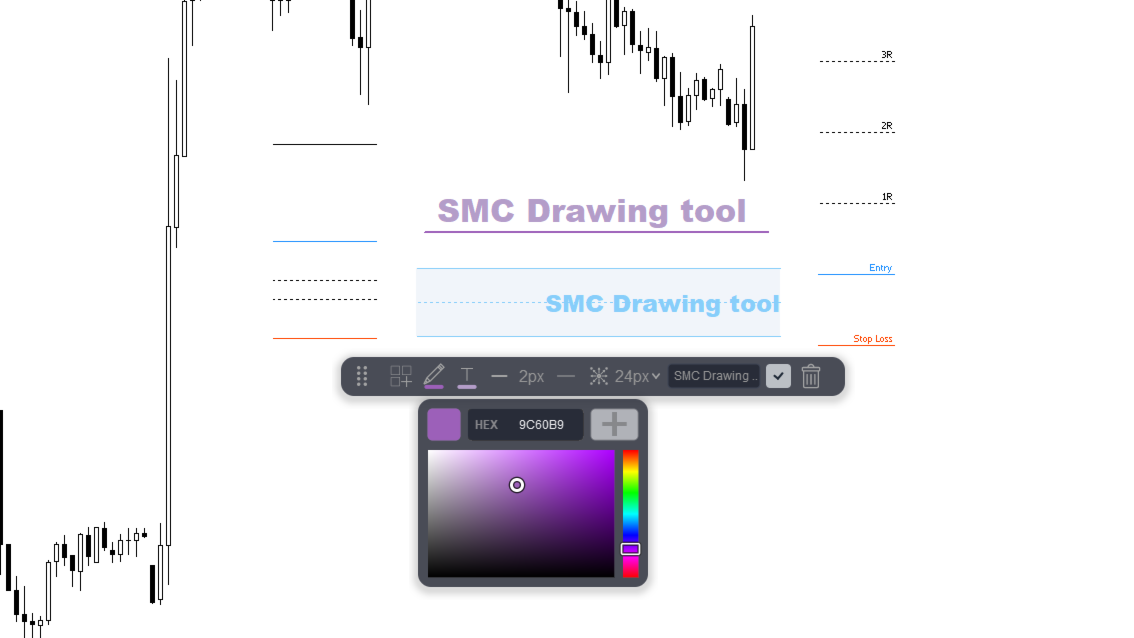
Color Panel and Picker. Provides 80 curated colors, plus an area for saving up to 50 custom colors. A built-in HSV picker with HEX input allows selecting any color. Three separate entry points on the toolbar control the border color, the fill color and the text color.
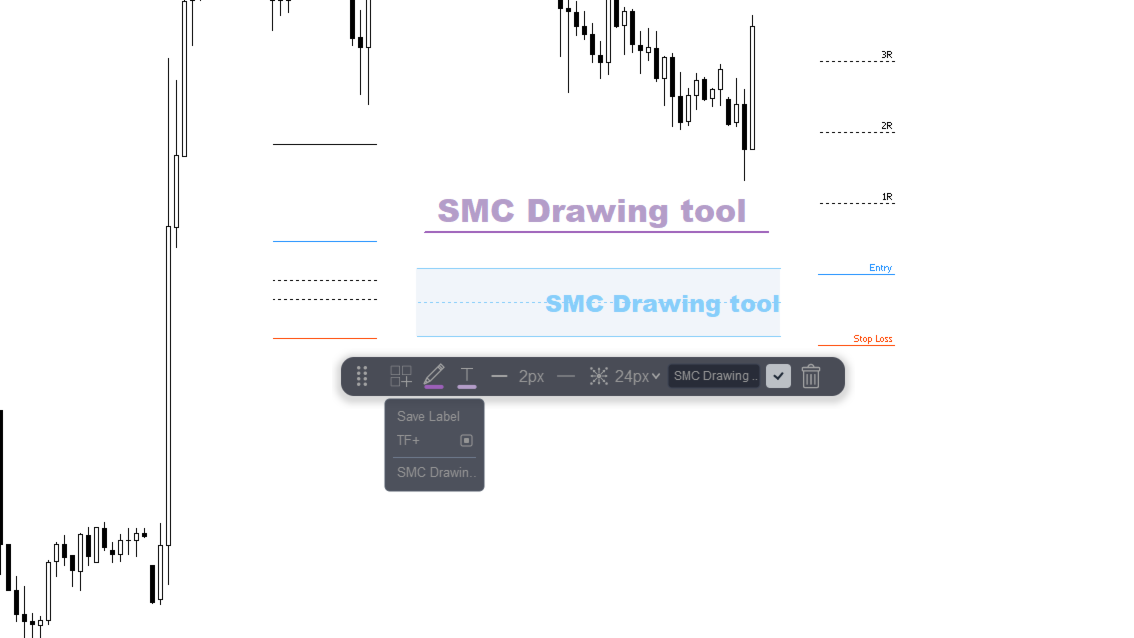
Text Template Panel. Frequently used label texts can be saved as templates and applied with a single click. A timeframe prefix switch adds the current timeframe automatically when a template is applied, for example H1 MSS. Saving a template also records the current style: the label color and font size plus the line color, width and style for structure lines, and additionally the fill and border colors for rectangles. Applying a template restores the style and the label direction together, so nothing has to be adjusted a second time.
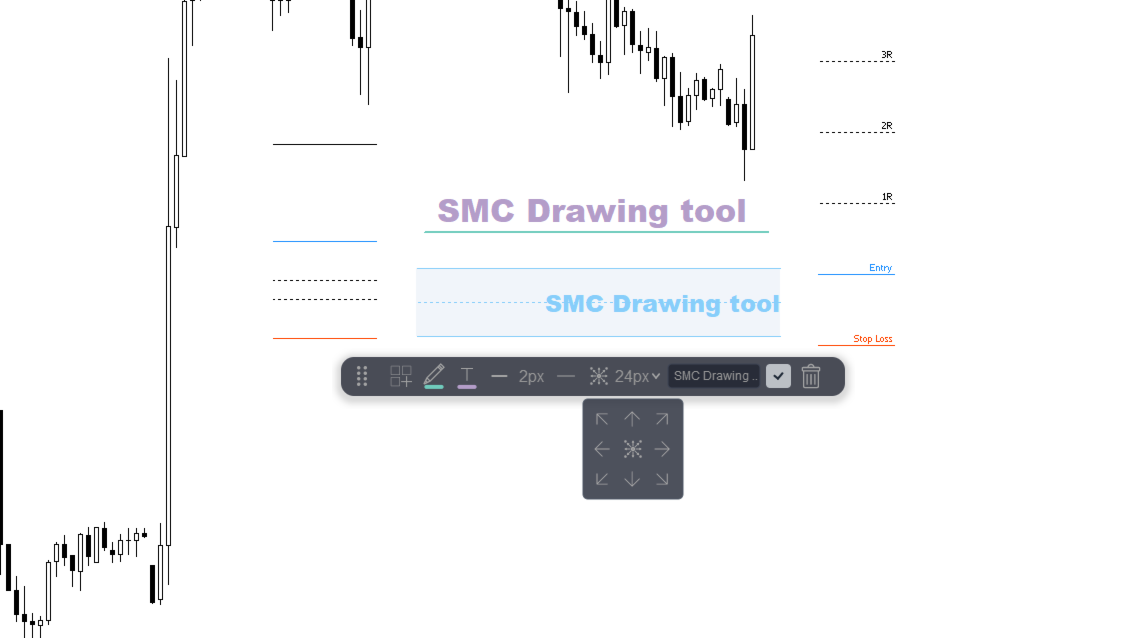
Direction Panel. Directions can be picked directly from a 3x3 grid instead of cycling through a hotkey. Both the structure line and the rectangle toolbar carry a direction button that opens the grid. A structure line label sits beside one end of the line. For rectangles the nine directions run clockwise over the four corners and the midpoints of the four sides, and the center cell places the label in the exact middle of the rectangle. All panel captions, input descriptions and tool names are available in Chinese and English.
How to Use Each Tool
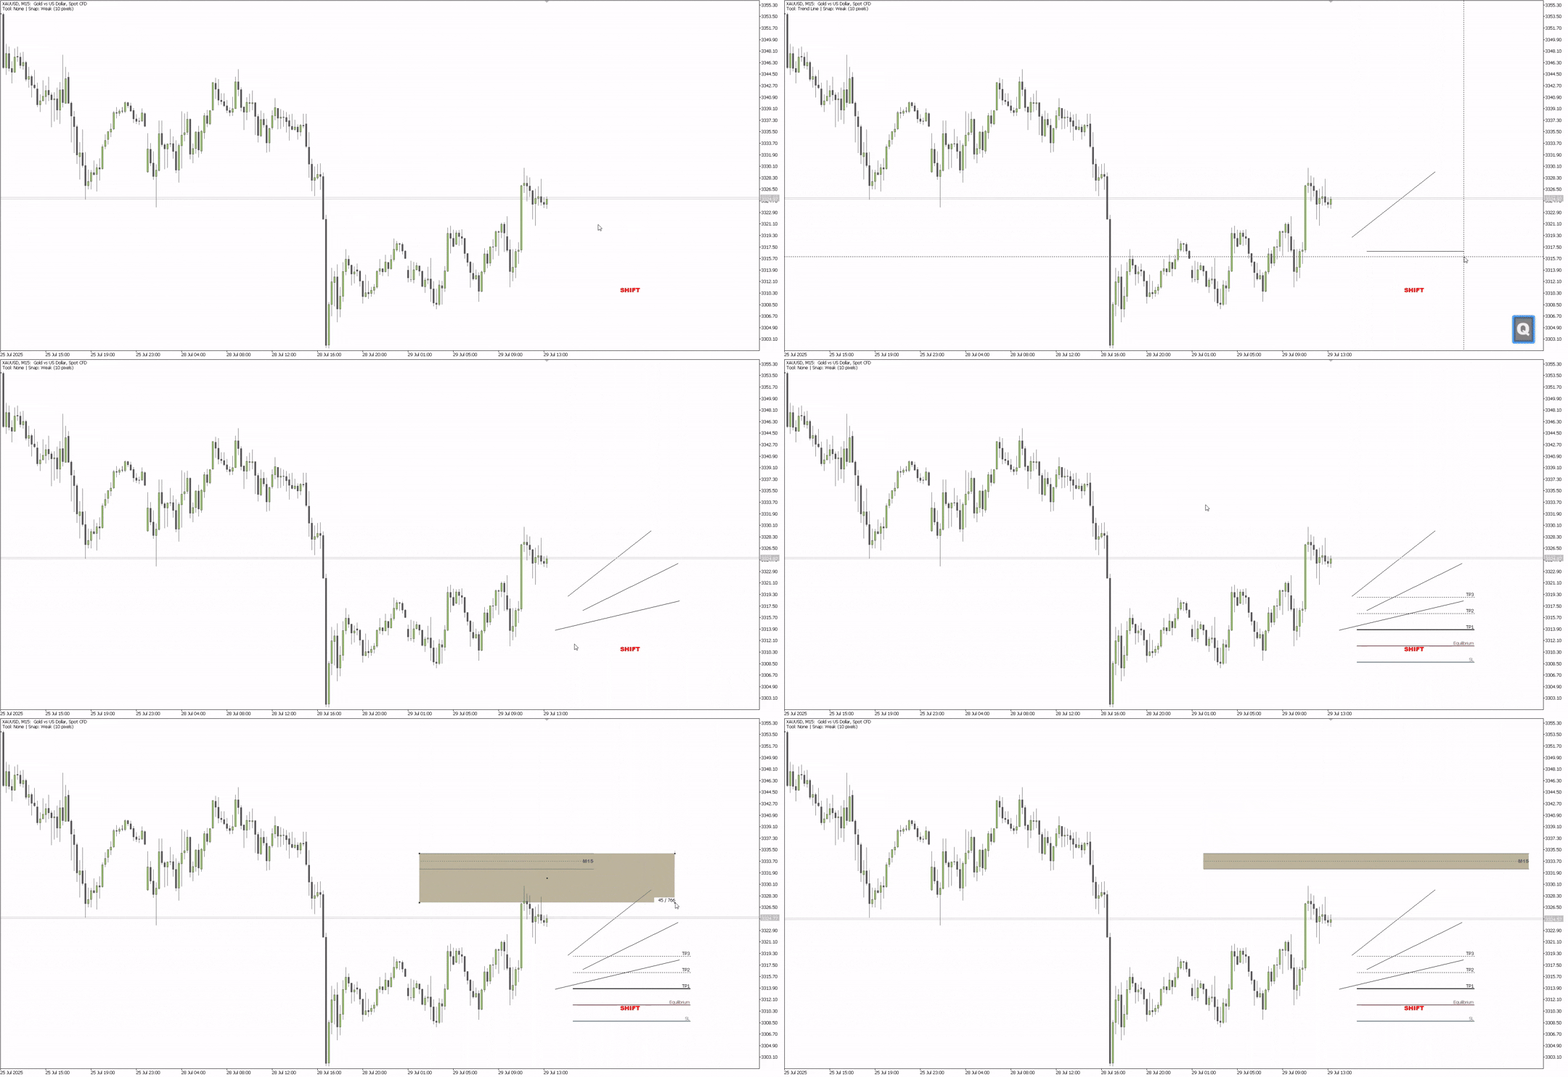
Trendline (Q key). Press Q to activate the trendline tool, click once on the chart to set the start point and click a second time to set the end point; the line is then created. A label is attached automatically and sits at the midpoint of the two time points by default. Press ESC at any time to cancel while drawing. After the line is drawn, drag an anchor point while holding the Shift key to move it along the direction of that anchor and adjust the line.
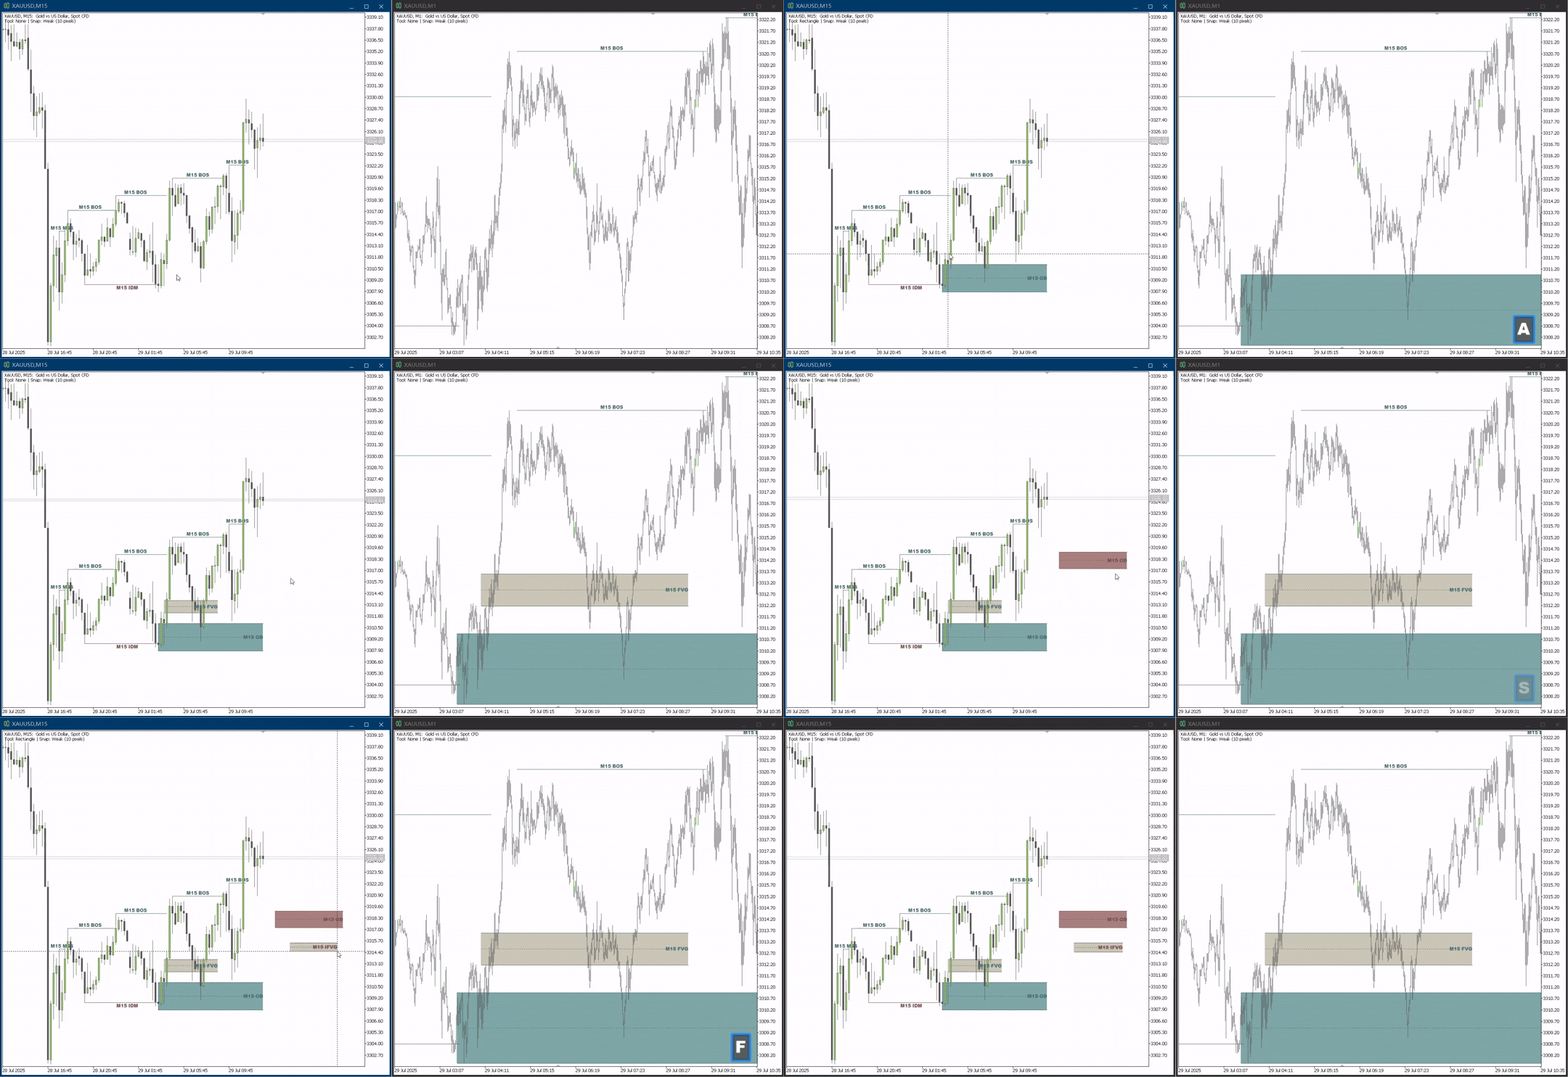
Rectangle (A key). Press A to activate the rectangle tool, then click twice to set two opposite corners. On the chart a rectangle consists of a filled area, upper and lower border lines, a midline, an attached Fibonacci level set and a text label. The label is anchored to the right border by default. While drawing, press W to cycle the label direction. The effect of the S key depends on the current state: when a label is active it changes the label direction, and when no label is active it cycles the rectangle border style between solid, dotted and dash-dot. After the rectangle is drawn, hold the Shift key and drag an anchor point; when you release the mouse the rectangle stretches horizontally automatically. Rectangles can be used to mark Order Blocks (OB) and Fair Value Gaps (FVG), whose fill colors and label colors are controlled independently.
Rectangle Label Direction. With a rectangle selected, the floating toolbar shows a direction button right after the line style button; click it to open the 3x3 grid. The nine directions run clockwise as upper left, top, upper right, right, lower right, bottom, lower left, left and center. The first eight correspond to the four corners and the midpoints of the four sides, and the center cell places the label in the middle of the rectangle. After picking a direction the label moves inside the rectangle to that position, and it keeps the same direction when the rectangle is dragged later.
Fibonacci Retracement (Y key). Press Y to activate the tool, then click twice to set the start and end points; the indicator generates level lines at 0.0, 0.5, 1.0 and related levels automatically. The colors and line width of each level are configured separately in the inputs, and the main, middle, zone and last levels can each be given a different color.
Fibonacci Channel (H key). Press H to activate the tool; three clicks are required. The first two clicks set the base line and the third sets the channel width, after which the indicator draws a parallel channel plus an auxiliary line at the minus 0.5 level. The color, width and style of the channel line and the minus 0.5 line are configured separately. Press ESC to cancel while drawing; points already set are kept until you start over.
Risk/Reward Tool (T key). Press T to activate the tool, click once to set the stop loss and click a second time to set the entry price; the indicator then generates the R-multiple level lines automatically. The colors and styles of the R lines, the entry line and the stop line are configured separately, with a shared line width. This tool is intended for quickly assessing the reward-to-risk ratio of a trade.
Labeling system (E, R, D and F keys). Press the corresponding label hotkey to apply a label to a drawn object. E applies structure labels for Market Structure Shift (MSS), Break of Structure (BOS) and Inducement (IDM). R applies liquidity labels for Buy Side and Sell Side Liquidity (BSL/SSL). D applies Order Block (OB) labels and F applies Fair Value Gap (FVG) labels. The preset texts of each label type can be edited in the inputs with multiple texts separated by commas, and pressing the same hotkey repeatedly cycles through the texts you defined. Press W to change the direction of the label on the object, and press S to change the rectangle direction.
Price Snap (G key). Press G to switch between strong snap and weak snap. With strong snap, drawing objects always align to the nearest key candle price, namely High, Low, Open or Close. With weak snap, an object aligns only when the cursor is within the configured pixel distance of a key price; otherwise it can be placed at any price. The snap distance is set in SnapDistancePixels, and the current mode is shown in the status line.
Crosshair (X key). Press X to create a crosshair on the chart; the vertical and horizontal lines follow the horizontal and vertical position of the mouse. The crosshair can be synchronized across charts of the same symbol, so moving it on one chart makes the other charts follow, which makes it easy to compare the same position across timeframes. Press X again or press ESC to hide the crosshair.
Chart Navigation (Z key). Press Z to enter navigation mode, where moving the mouse shows the crosshair. Click once at the target position and all other charts of the same symbol scroll horizontally so that this point in time is centered as far as possible. If the target time is too close to the most recent bar and there is not enough empty space on the right to center it fully, the chart stops at the most centered position it can reach. The mode exits automatically after navigating, and pressing Z or ESC also cancels it.
Floating Toolbar (Alt plus left click). Hold the Alt key and left click any drawn object to open a floating toolbar next to it. The layout switches automatically by object type: clicking a trendline, liquidity or structure object opens the structure line toolbar, while clicking a rectangle opens the rectangle toolbar. The toolbar lets you change the border color, the fill color and the text color, edit the label text, adjust line width and style, pick the label direction, and delete the object.
Adjusting Label Position. Besides picking a direction from the panel, you can drag a label and place it anywhere you like. The label remembers its offset relative to the object, so when you later drag the trend line or the rectangle the label follows the object while keeping the relative position you set, instead of being snapped back to the default direction. Labels that have not been dragged still follow the direction setting.
Text Template Panel. Open the text template panel from the toolbar to save frequently used label texts as templates. A timeframe prefix switch is provided; when it is enabled, the current timeframe is added in front of the text automatically, so applying an MSS template on an H1 chart produces H1 MSS. Saving also records the current style and label direction, including the label color, font size, line color, line width and line style, plus the fill and border colors for rectangles, and applying restores them completely. There is no limit on the number of templates; use the mouse wheel over the panel to browse them all. Templates and custom colors persist between sessions and remain available after restarting the terminal.
Save Chart Template (P key). After completing your drawings and style configuration, press P to save the full setup of the current chart as a chart template, including drawing objects, indicator inputs and the toolbar position, so the same working environment can be reused quickly on other charts.
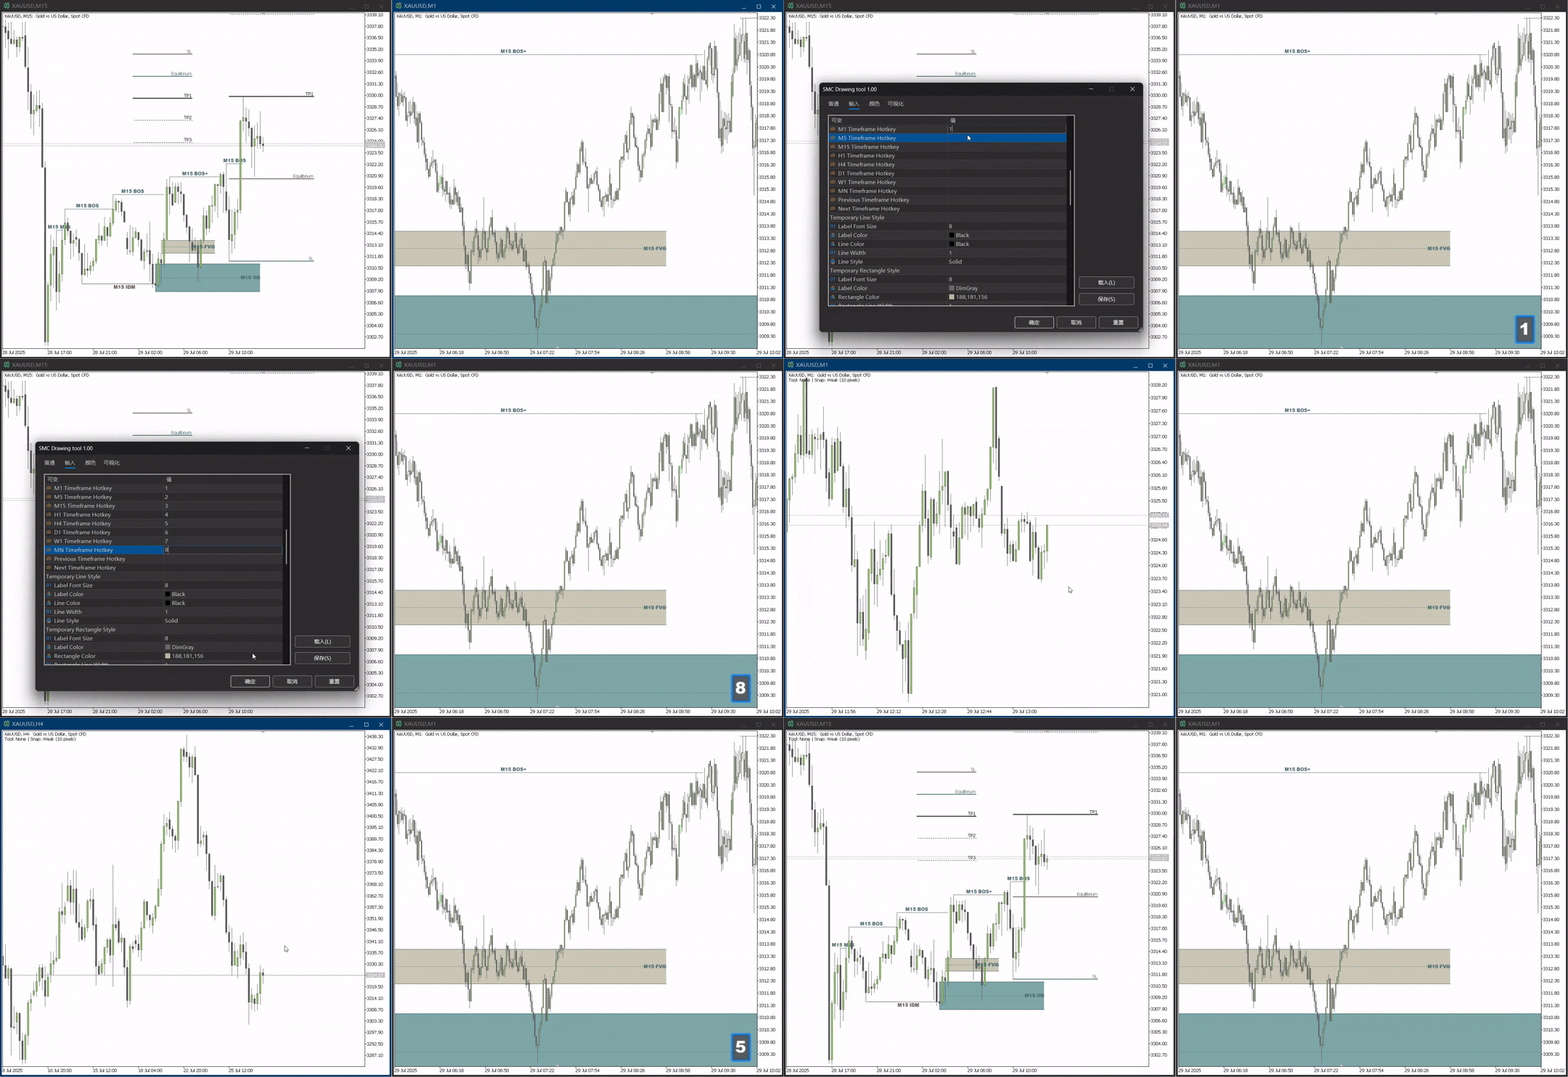
Cancelling and shortcuts. Press ESC while drawing to cancel the current drawing, and press ESC with an object selected to clear the selection. All hotkeys are customizable in the inputs, including the drawing tools, the label types, snap toggling, template saving and timeframe switching. The number keys 1 through 8 switch the timeframe by default.
Default Hotkeys
Q trendline, A rectangle, Y Fibonacci, H Fibonacci channel, T risk/reward tool, X crosshair toggle, Z chart navigation, E structure label, R liquidity label, D order block label, F fair value gap label, W label direction, S rectangle direction, G snap mode toggle, P save chart template, 1 through 8 switch the timeframe. Alt plus left click opens the floating toolbar, and ESC cancels drawing or clears the selection.
Notes
The crosshair is off by default. Its purpose is to compare the same position across several charts rather than for everyday drawing, and when it is on it follows the mouse, covers the chart and makes it harder to click and select drawn objects. It is therefore not shown on first load. Press X to turn it on, and press X again or press ESC to turn it off. The setting is remembered per chart, so a crosshair you turned on stays on the next time the chart is loaded.
This indicator must be used on a chart where algorithmic trading is allowed. Due to limitations in MetaTrader 5, it does not work in the Strategy Tester.
Text templates record the style and label direction that were in effect when they were saved. Templates saved with earlier versions contain no direction data, so applying them restores the text and the style only and does not change the label position; save the template once more if you want the direction recorded.
All panel captions, input descriptions and tool names are available in Chinese and English, and switching takes effect immediately without reloading the indicator.
If you have questions or suggestions, please contact the author through MQL5 internal messaging.








































good indicctor