KDJ Indicator for MT4

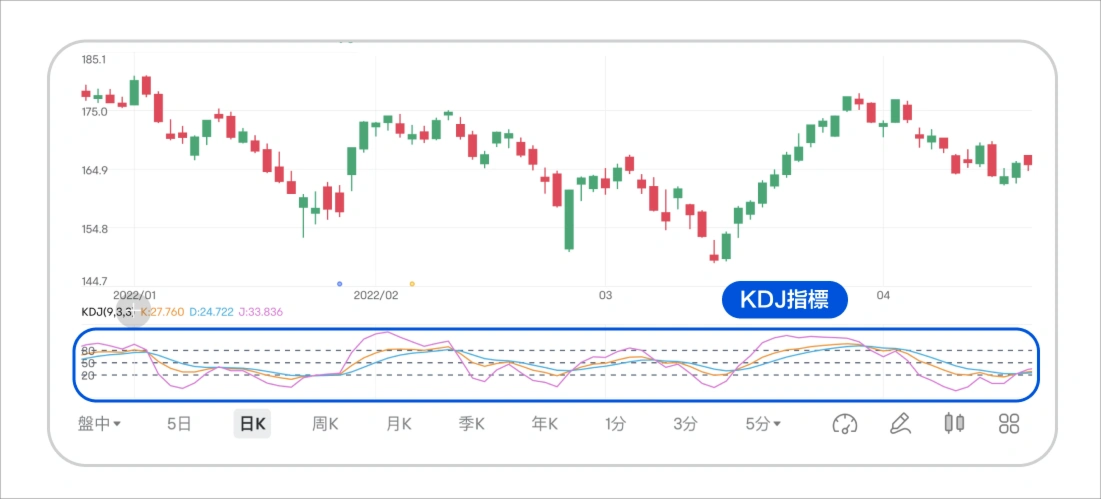
The KDJ indicator is a very useful momentum oscillation indicator made up of three indicator lines K, D, J.

Many people also refer to the KDJ indicator as a “random indicator” because it actually adds a J line as an auxiliary on the basis of a traditional random indicator (containing only K, D lines).

The KDJ indicator has a certain degree of comprehensiveness, drawing on the advantages of the William Indicator (WMSR) and Moving Averages (MA) to help investors better judge market trends and identify potential opportunities for market reversals.

Compared to many other technical analysis indicators, the KDJ indicator is unusually sensitive to short line movements and is therefore hailed by some traders as the “king of short line indicators”.

(Figure 1)

Parameters and calculation methods of the KDJ indicator

When calculating the KDJ indicator, first obtain an “immature random value” —RSV, which is similar to the William indicator; then moving average processing of the RSV gets a value of K, which is mainly to smooth the RSV; then moving average processing of the K value gets a value of D; and finally, a J value is obtained based on K, D values。

Calculation method of KDJ indicator

  • RSV = (Current closing price -21 day minimum)/(21 day high price -21 day minimum) ×100
  • K = MA(RSV, 3)
  • D = MA(K, 3)
  • J = 3K - 2D

KDJ Parameters

The KDJ indicator contains three parameters that are used to calculate RSV, K value, and D value, respectively:

THE RSV DEFAULT PARAMETER IS 21, WHICH REPRESENTS THE POSITION OF THE CURRENT CLOSING PRICE RELATIVE TO THE RECENT 21-DAY HIGHS AND LOWS.

The default parameter for K value is 3, i.e. the 3-day moving average for RSV.

The default parameter for the D value is 3, which is the 3-day moving average for the K value.

Key Points of the KDJ Indicator

  • The KDJ indicator evaluates momentum based on the closing price.

K, D values always oscillate up and down in the 0~100 range, while J values may be greater than 100 or less than 0.

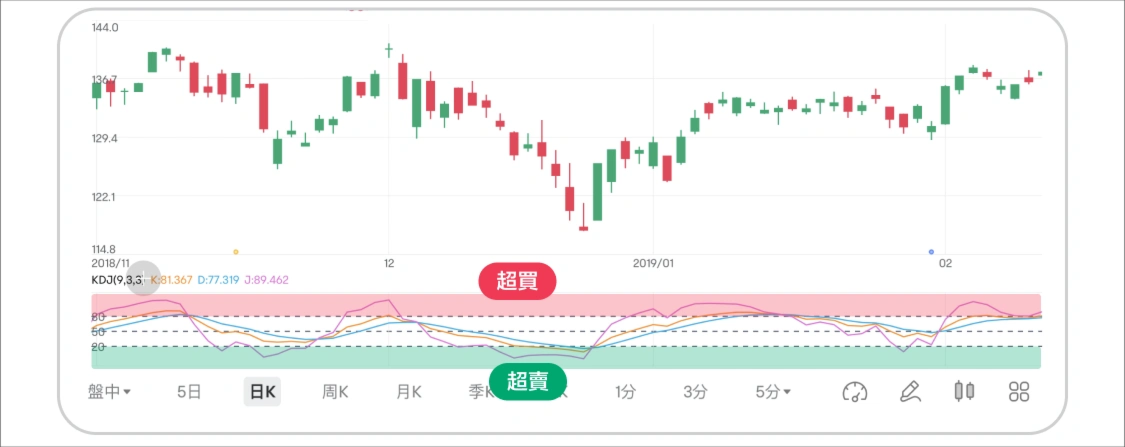
  • The KDJ indicator can assess overbought and oversold.

Generally, K values above 80 are considered overbought; K values below 20 are considered oversold.

(Figure 2)

  • KDJ can release short line buy and sell signals.

The K line crosses the D line up at the low level as a fork, which is a potential buy signal; the K line crosses the D line at the high level down as a dead fork, which is a potential sell signal.

  • The KDJ indicator can be used to escape the top or the bottom.

When the J line rises above 100, there is a greater probability of forming the top of the market; when the J line falls below 0, there is a greater probability of forming the bottom of the market.

(Figure 3)

  • The KDJ indicator may be “attenuated”.

When the trend is strong, the KDJ indicator may continue to hover near the overbought or oversold area, a so-called “blunting” phenomenon. This usually indicates that the trend is strengthening, and at this time a fork or dead fork should not be viewed blindly as a reversal signal.

What to see KDJ | Case Study
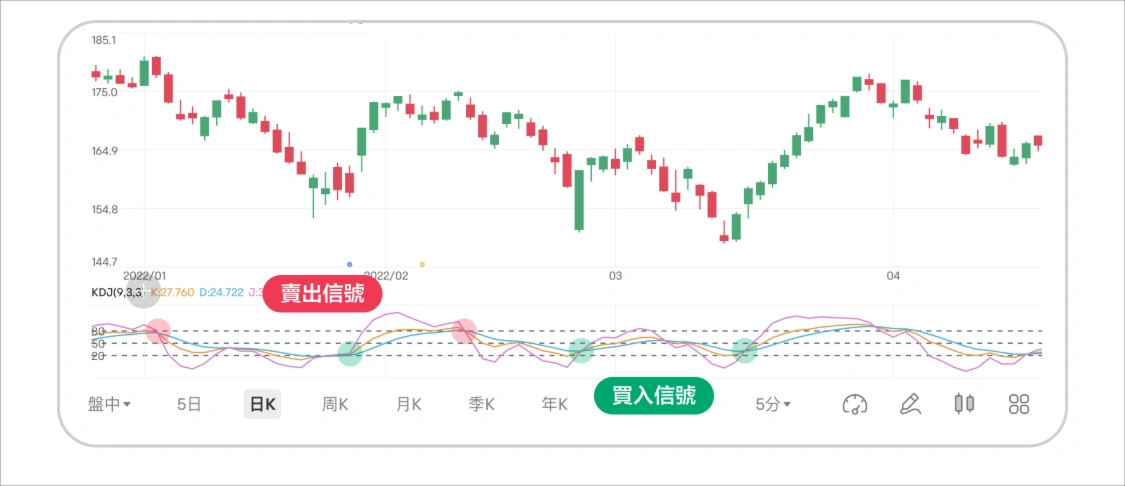
FORK/FORK

Figure 4 is a cross or dead fork signal released by the KDJ indicator to aid trading. When the K line rises above 80, it means overbought, if the K line then crosses the D line downwards, a dead fork signal appears, which is a potential sell opportunity; similarly, when the K line falls below 20, it means oversold, and if the K line then crosses the D line upwards, a cross signal appears, a potential buy opportunity.
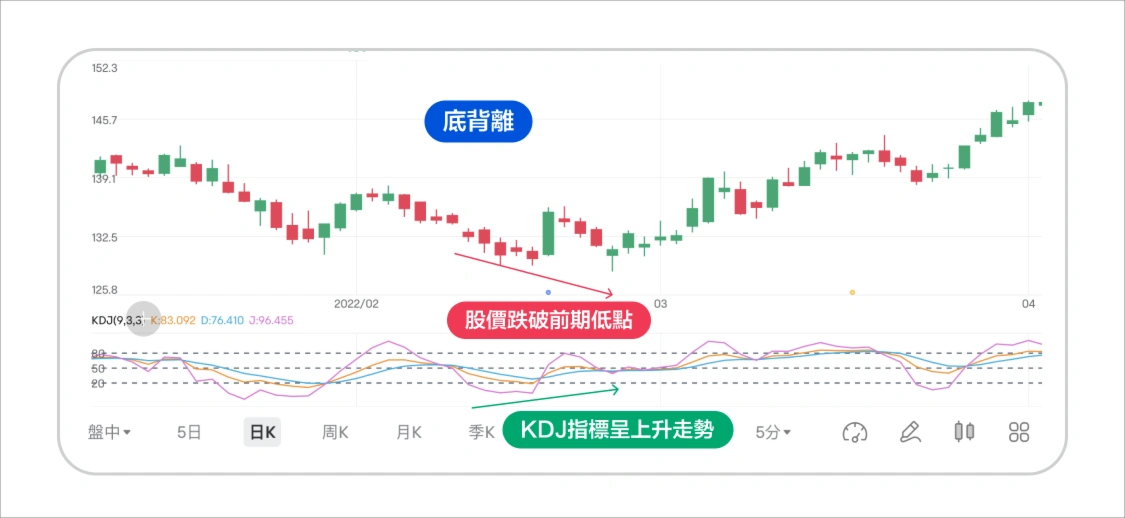
Back off

Figure 5 uses the KDJ indicator and the price movement to capture potential reversal opportunities. When the stock price breaks new lows, the KDJ indicator does not go lower in sync or even shows an uptrend. This phenomenon is called a “bottoming out”, suggesting that the stock price may move higher in the short term.

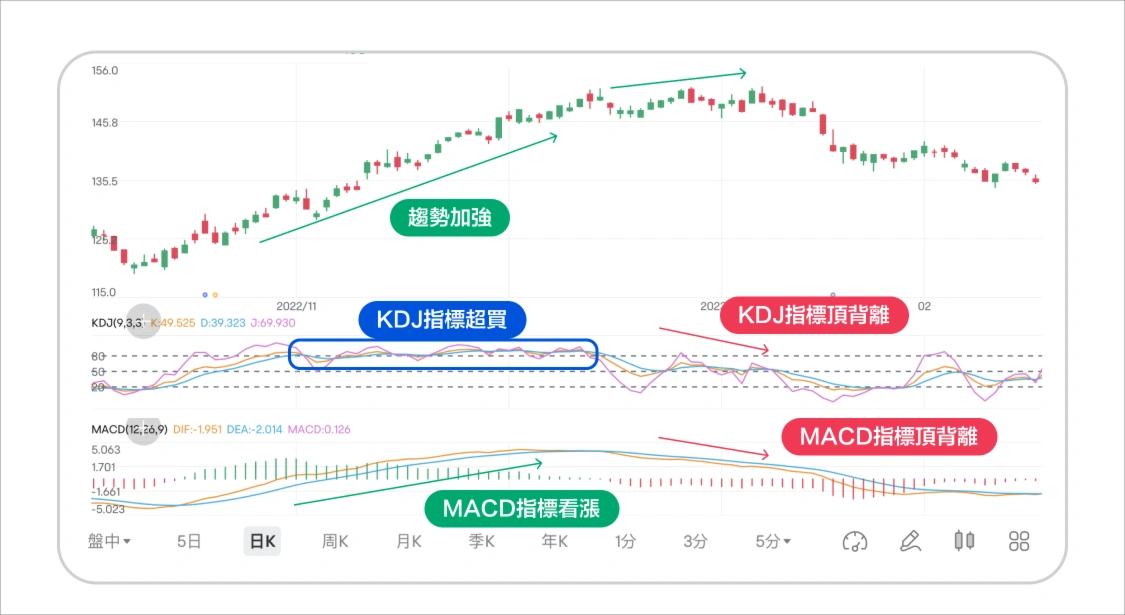
Trend Strengthening and Reversal

Figure 6 uses the KDJ indicator and MACD indicator to jointly confirm the trend intensification and determine the potential opportunity for a reversal of the trade. In a strong uptrend, the KDJ indicator may stay near the overbought area for a long time, hinting that the current trend is strengthening. This situation can be further confirmed by the MACD indicator, such as when the MACD indicator shows a clear bullish trend. In addition, it is also possible to determine the timing of a movement reversal based on these two indicators, for example, when both the KDJ indicator and the MACD indicator show a top break, the chances of a reversal downwards are greater.

Summary of KDJ Indicators

The KDJ indicator is a very useful momentum swing indicator primarily used to assess overbought and oversold.

The KDJ indicator is particularly suitable for use in turbulent markets, as KDJ indicators tend to be able to quickly release potential reversal signals when the market is oversold.

It should be noted that the KDJ indicator is very sensitive to short line movements, so error signals may be released frequently in some cases. In order to balance the KDJ indicator flaws, investors can use several lagging indicators at the same time to better support trading.

This content discusses technical analysis, and other approaches, including fundamental analysis, may provide different perspectives. The examples provided are for illustrative purposes only and do not reflect the expected results. All investments involve risk, including the potential loss of principal, which cannot guarantee the success of any investment strategy.

Key feature of this indicator:

+ Setting KDJ parameter

+ Notification: when trend change; when signal


Рекомендуем также
Устали от построения линий поддержки и сопротивления? Сопротивление поддержки - это мульти-таймфреймовый индикатор, который автоматически обнаруживает и отображает линии поддержки и сопротивления на графике с очень интересным поворотом: поскольку ценовые уровни тестируются с течением времени и его важность возрастает, линии становятся более толстыми и темными. [ Руководство по установке | Руководство по обновлению | Устранение неполадок | FAQ | Все продукты ] Повысьте технический анализ в одноч
Индикатор Crypto_Forex "Auto FIBO Pro" - отличный вспомогательный инструмент в торговле! - Индикатор автоматически рассчитывает и размещает на графике уровни Фибоначчи и локальные линии тренда (красного цвета). - Уровни Фибоначчи указывают ключевые области, где цена может развернуться. - Наиболее важными уровнями являются 23,6%, 38,2%, 50% и 61,8%. - Вы можете использовать его для скальпинга на разворот или для торговли по зональной сетке. - Существует множество возможностей улучшить вашу теку
Индикатор показывает потенциальный направление тренда по циклично-волновой зависимости. Таким образом, все лучи пересечения будут оптимальными лучами, в направлении которых ожидается движение цены с учетом периода индикатора. Лучи можно использовать как направление потенциального движения рынка. Но не надо забывать, что подход должен быть комплексным, сигналы индикатора требуют дополнительной информации для входа в рынок.
МТФ-индикатор уровней поддержки и сопротивления, построенных на экстремумах индикаторов Advanced ZigZag Dynamic и/или Extended Fractals с отключаемым ценовым значением в виде меток. Для режима МТФ можно выбрать все более старшие ТФ. По умолчанию уровни строятся на основе точек индикатора "Зигзаг", можно также использовать для построения точки индикатора Фракталов совместно с Зигзагом или вместо него. Для упрощения работы и экономии процессорного времени расчёт происходит один раз на каждом баре
Rainbow Price Visualizer v1.21 See where the market really breathes. Turns your MT4 chart into an ultra-precise heatmap that highlights price zones favored by big players. Why it matters 300 price levels at 0.2‑pip resolution — microscopic detail. 8 visual themes (Rainbow, Fire, Ocean…) for instant readibility. Smart opacity: low noise fades, real zones pop. Lightweight rendering with automatic cleanup. Fully customizable: saturation, opacity, resolution, history depth. Bands project into the f
Суть данного индикатора - анализ и предсказание котировок с помощью преобразования Фурье. Индикатор раскладывает ряд цен на гармоники и вычисляет их продукт на следующих барах. Индикатор выводит на истории ценовые метки, обозначающие размах цен в прошлом, а также ценовые метки с предполагаемым движением в будущем. Также прогнозируемое решение о покупке или продаже и размер take profit указывается в текстовой метке в окне индикатора. Индикатор использует в качестве "движка" для расчетов другой ин
Индикатор определяет и отображает на графике гармоничный паттерн 3 Движения (3 Drives), согласно схеме, приведенной на скриншоте. Выделение паттерна производится по вершинам индикатора ZigZag (включен в ресурсы, не требует дополнительной установки). В момент распознавания паттерна выводится сообщение во всплывающем окне, отправляются оповещения на мобильное устройство и электронный почтовый ящик. Индикатор выделяет не только завершенную фигуру, но и момент ее формирования. На этапе формирования
CRT Candle Range Theory HTF MT4.   Ultimate CRT Indicator: Advanced ICT Concepts and Malaysian SnR Trading System Discounted   Price   $50  !!     Secure your lifetime access   now   before it switches to   subscription-only ! Master the Market Maker's Footprints with the Most Advanced Candle Range Theory Indicator Unlock the true power of   Smart Money Concepts (SMC)   and trade precisely like the institutions with the   Ultimate CRT Indicator . Built exclusively for serious traders, this indic
Super Reversal Pattern Indicator Unlock the power of advanced pattern recognition with our Super Reversal Pattern Indicator. Designed for traders seeking precision and reliability, this indicator identifies one of the most effective reversal patterns in technical analysis, offering a significant edge in your trading strategy. Key Features: Non-Repainting Accuracy: Enjoy the confidence of non-repainting technology. Once a Super Reversal Pattern is detected, it remains static, providing consiste
Daily Candle Predictor - это индикатор, который предсказывает цену закрытия свечи. Прежде всего индикатор предназначен для использования на графиках D1. Данный индикатор подходит как для традиционной форекс торговли, так и для торговли бинарными опционами. Индикатор может использоваться как самостоятельная торговая система, так может выступать в качестве дополнения к вашей уже имеющейся торговой системе. Данный индикатор производит анализ текущей свечи, рассчитывая определенные факторы силы внут
Update:ver1.53 (2023/08/16) ・ Overview and required environment Generate a duplicate limit order reservation for manual orders or orders from other tools, etc. This is specialized to "simplify the ordering operation". For the analysis to decide ordering, please do your best by yourself, such as fishing for materials, deriving a rule of thumb, using other analysis tools and EA together, etc. Since version 1.28, the function of "automatically re-order after settlement" has been implemented. (This
Key level wedge pro
Presley Annais Tatenda Meck
5 (1)
We have combined all of our beloved indicators the likes of: Key level order block , Key level supply and demand , Key level liquidity grab and Key level wedge into one single indicator and dashboard. Whats new Dashboard : There is an easy access dashboard for all your needs. Multi-timeframe button : There is now a multi-timeframe option for Order Blocks and Supply and demand zones, making it easy to see higher timeframe zones easily on the current timeframe by just clicking the desired timefra
Индикатор SMC Venom Model BPR — профессиональный инструмент для трейдеров, работающих в рамках концепции Smart Money (SMC). Он автоматически идентифицирует на графике цены два ключевых паттерна:  FVG (Fair Value Gap) — комбинация их трёх свечей, в которой имеется разрыв между первой и третьей свечой. Формирует зону между уровнями, где отсутствует поддержка объемов, что часто приводит к коррекции цены. BPR (Balanced Price Range)— комбинация двух FVG-паттернов, образующих «мост»  — зону пробоя и в
Price Magnet — Индикатор зон плотности цены и уровней притяжения Price Magnet — это профессиональный аналитический инструмент, который определяет ключевые уровни поддержки и сопротивления на основе статистической плотности распределения цены (Price Density). Индикатор анализирует заданный исторический период и находит ценовые значения, на которых рынок находился дольше всего. Эти зоны выступают в роли «магнитов» — они притягивают цену или служат фундаментом для разворота. В отличие от стандартны
Antabod Gamechanger
Rev Anthony Olusegun Aboderin
*Antabod GameChanger Indicator – Transform Your Trading!*   Are you tired of chasing trends too late or second-guessing your trades? The *Antabod GameChanger Indicator* is here to *revolutionize your trading strategy* and give you the edge you need in the markets!   Why Choose GameChanger? *Accurate Trend Detection* – GameChanger identifies trend reversals with *pinpoint accuracy*, ensuring you enter and exit trades at the optimal time.   *Clear Buy & Sell Signals* – No more guesswork! T
VR Cub
Vladimir Pastushak
VR Cub это индикатор что бы получать качественные точки входа. Индикатор разрабатывался с целью облегчить математические расчеты и упростить поиск точек входа в позицию. Торговая стратегия, для которой писался индикатор, уже много лет доказывает свою эффективность. Простота торговой стратегии является ее большим преимуществом, что позволяет успешно торговать по ней даже начинающим трейдерам. VR Cub рассчитывает точки открытия позиций и целевые уровни Take Profit и Stop Loss, что значительно повы
Volume Profile Sniper v11.1 -комплексный инструмент для анализа рынка и профессиональный подход к торговле Volume Profile Sniper v11.1 объединяет более 15 ключевых фильтров в одном индикаторе, предоставляя чёткие сигналы на основе комплексной оценки рыночной ситуации. Основные возможности Анализ объёмного дисбаланса   – алгоритм вычисляет долю покупателей и продавцов в каждой свече, сигнализируя о преобладании одной из сторон (настраиваемый порог от 50% до 90%). Многоуровневая фильтрация сигн
Fisher Yur4ik MT4 — это продвинутый торговый индикатор, который использует мощь технического анализа для предоставления трейдерам точных инсайтов о рыночных тенденциях. Специально разработанный для MetaTrader 4, этот индикатор идеально подходит для трейдеров, стремящихся улучшить процесс принятия решений и повысить свои торговые результаты. Используя Fisher Yur4ik MT4, трейдеры могут получить конкурентное преимущество с помощью уведомлений в реальном времени и четких визуальных сигналов, что поз
EARLY REMINDER: The Starting price is 65 price will rise soon up to 365$ and then 750$ after first 10 copies of sales. Grab this offer now! Introduction Hello, traders! Welcome to the demonstration of the Forex Beast Indicator , a comprehensive tool designed to assist aspiring traders in navigating the complexities of the forex market. This indicator incorporates seven essential components to provide a well-rounded trading experience: Moving Averages Colored Zones Support and Resistance Levels
This is a new strategy for SUPPLY DEMAND areas It is based on a calculation using the tick volume to detect the big price action in market for both bear /bull actions this smart volume action candles are used to determine the supply and demand areas prices in between main supply and demand lines indicate sideway market  up arrows will be shown when prices moves above the main supply and the secondary supply lines Down arrows will be shown when prices moves below the main demand and the secondary
Уровни поддержки и сопротивления можно искать на любом таймфрейме. Однако наиболее важные  из них образуются на крупных периодах – дневных, недельных и месячных. Я предпочитаю использовать недельный график для поиска надежных уровней. Индикатор определяет уровни поддержки и сопротивления на основе недельного таймфрейма, используя максимумы, минимумы и среднее значение предыдущей недели.
LondonBreakout
SAMUEL EURFYL DAVIES
The EA shows great potential in all three major market breakouts - Asian(Tokyo), European(London), and North American(NewYork). This EA is a sophisticated adaption of the widely used Breakout strategy and has numerous parameters for you to fine tune if you wish, or you can simply run the EA with its default values to begin with. Both back testing and live testing have concluded positively, so I am proud to be able to share this EA with you after a number of month's hard work. The EA has been tes
Это, пожалуй, самый полный индикатор автоматического распознавания гармонического ценообразования, который вы можете найти для платформы MetaTrader. Он обнаруживает 19 различных паттернов, воспринимает проекции Фибоначчи так же серьезно, как и вы, отображает зону потенциального разворота (PRZ) и находит подходящие уровни стоп-лосс и тейк-профит. [ Руководство по установке | Руководство по обновлению | Устранение неполадок | FAQ | Все продукты ] Он обнаруживает 19 различных гармонических ценов
Presenting one-of-a-kind Gann Indicator for XAUUSD IQ Gold Gann Levels is a non-repainting, precision tool designed exclusively for XAUUSD/Gold intraday trading. It uses W.D. Gann’s square root method to plot real-time support and resistance levels, helping traders spot high-probability entries with confidence and clarity. William Delbert Gann (W.D. Gann) was an exceptional market analyst whose trading technique was based on a complex blend of mathematics, geometry, astrology, and ancient calcul
Shark Deal Book
Philip Pankaj Suthagar
4 (3)
Term  "shark"  in the business world denotes a high volume investor who just made a good investment in a highly Potential business deal.So, sharks are the ones who make the market move. In our case, if an American shark bought a Japanese company, he/she has to convert American dollars into Japanese yen to make the deal. So, the demand for the Japanese yen will increase sharply. Thus USD/JPY will go short rapidly if the deal was from the shark. Another example, In the case of forex, if fed increa
VR ATR Pro
Vladimir Pastushak
4.33 (6)
VR ATR Pro — технический индикатор, предназначенный для определения целевых уровней на основе статистического анализа предыдущих торговых периодов. В его основе лежит математический расчёт среднего ценового движения за выбранный период времени. Принцип работы индикатора, основанный на статистике В основе работы индикатора лежит наблюдение за ежедневным поведением цены: каждый торговый период характеризуется определённой амплитудой движения — цена проходит некоторое расстояние в пунктах как вверх
Volume Compair
Thiago Pereira Pinho
5 (1)
Ключевые Особенности  Гистограмма Кумулятивной Дельты – Визуализирует чистый объем покупок против объема продаж в реальном времени. Медианы Объема Покупок/Продаж – Горизонтальные линии, показывающие средние уровни объема покупок и продаж.  Умная Классификация Объема – Разделяет: Сильные Покупки (Зеленый) – Бычье давление. Сильные Продажи (Красный) – Медвежье давление. Медиана Объема Покупок (Синяя Линия) – Ориентир для типичного объема покупок. Медиана Объема Продаж (Оранжевая Линия) – Ориентир
Trend Scanner
Vladimir Kalendzhyan
4.33 (6)
By purchasing this indicator, you have the right to receive a free copy of one of   my other indicator's or advisor’s!  (All future updates are included. No limits) . To get it , please contact me by  mql5 message ! Индикатор трендовых линий Trend Scanner показывает направление тренда и его изменение. Индикатор работает на всех валютных парах  и таймфреймах. Индикатор отображает на графике цены сразу несколько показателей: линии поддержки и сопротивления валютной пары, существующие трендовые лин
Индикатор определяет и отображает на графике гармоничный паттерн Акула согласно схеме, приведенной на скриншоте. Выделение паттерна производится по вершинам индикатора ZigZag (включен в ресурсы, не требует дополнительной установки). В момент распознавания паттерна выводится сообщение во всплывающем окне, отправляются оповещения на мобильное устройство и электронный почтовый ящик. Индикатор выделяет не только завершенную фигуру, но и момент ее формирования. На этапе формирования фигура отображает
PivotSupportResistance Индикатор отрисовывает горизонтальные линии на уровнях дневных пивотов R3, R2, R1, Pivot, S1, S2, S3, где R - сопротивление, а S - поддержка. Индикатор работает на любому таймфрейме, но дневные пивоты на графиках больших таймфреймов не имеют смысла (если вы установите таймфрейм графике больше D1, индикатор не будет работать и сработает алерт). Последние дневные уровни отмечаются значками. Входных параметров нет, индикатор прост в использовании. Перед запуском индикатора на
С этим продуктом покупают
Gann Made Easy - это профессиональная, но при этом очень простая в применении Форекс система, основанная на лучших принципах торговли по методам господина У.Д. Ганна. Индикатор дает точные BUY/SELL сигналы, включающие в себя уровни Stop Loss и Take Profit. ПОЖАЛУЙСТА, СВЯЖИТЕСЬ СО МНОЙ ПОСЛЕ ПОКУПКИ, ЧТОБЫ ПОЛУЧИТЬ ТОРГОВЫЕ ИНСТРУКЦИИ И ОТЛИЧНЫЕ ДОПОЛНИТЕЛЬНЫЕ ИНДИКАТОРЫ БЕСПЛАТНО! Вероятно вы уже не раз слышали о торговли по методам Ганна. Как правило теория Ганна отпугивает от себя не только н
The Propfolio Master Suite is the ultimate all-in-one analytical workstation for professional traders. Combining the power of the Beat The Market Maker (BTMM) methodology, Smart Money Concepts (SND/Liquidity), and Advanced Volume Profile, this suite replaces multiple different indicators with one optimized engine. Monitor up to 14 pairs simultaneously from a single chart, instantly identify market cycles, and seamlessly map institutional footprints with the click of a button. The Command Center
Scalper Inside PRO Scalper Inside PRO — это индикатор внутридневного тренда и скальпинга для MetaTrader 4, который использует эксклюзивный алгоритм для быстрой оценки направления рынка и ключевых целевых уровней. Он автоматически рассчитывает точки входа, выхода и несколько уровней фиксации прибыли, а также показывает подробную статистику результативности, чтобы вы могли видеть, как разные инструменты и стратегии работали раньше. Это помогает выбирать наиболее подходящие торговые инструменты под
M1 SNIPER — это простая в использовании торговая система. Это стрелочный индикатор, разработанный для тайм фрейма M1. Индикатор можно использовать как отдельную систему для скальпинга на тайм фрейме M1, а также как часть вашей существующей торговой системы. Хотя эта торговая система была разработана специально для торговли на M1, ее можно использовать и с другими тайм фреймами. Первоначально я разработал этот метод для торговли XAUUSD и BTCUSD. Но я считаю этот метод полезным и для торговли на д
Auto Optimized Parabolic RSI: Передовой 3D-движок импульса Большинство розничных индикаторов терпят неудачу, потому что они полагаются на статические входные параметры, которые ломаются, как только меняется волатильность рынка. Auto Optimized Parabolic RSI решает проблему «устаревания индикатора» путем непрерывного пересчета собственного математического преимущества, привнося количественную адаптацию институционального уровня прямо в ваш терминал MT5. Главное преимущество: Пользовательская 3D-оп
PRO Renko System - это высокоточная система торговли на графиках RENKO. Система универсальна. Данная торговая система может применяться к различным торговым инструментам. Система эффективно нейтрализует так называемый рыночный шум, открывая доступ к точным разворотным сигналам. Индикатор прост в использовании и имеет лишь один параметр, отвечающий за генерацию сигналов. Вы легко можете адаптировать алгоритм к интересующему вас торговому инструменту и размеру ренко бара. Всем покупателям с удовол
NAM Order Blocks
NAM TECH GROUP, CORP.
3.67 (3)
Индикатор обнаружения блоков ордеров мультитаймфреймов MT4. Функции - Полностью настраиваемая панель управления графиком, обеспечивает полное взаимодействие. - Скрыть и показать панель управления где угодно. - Обнаружение OB на нескольких таймфреймах. - Выберите количество OB для отображения. - Различные пользовательские интерфейсы OB. - Различные фильтры по OB. - Оповещение о близости OB. - Линии ADR High и Low. - Служба уведомлений (Экранные оповещения | Push-уведомления). Резюме
Расширенный расчет на основе чистого ценового действия для поиска прорывов LH и HL. Это даст вам отличные точки разворота на рынке. Сигналы LH и HL также могут использоваться для прорывов трейнгла. Когда происходит прорыв, это указывает на сильный разворот. Хороший фильтр для скользящих средних. Я настоятельно рекомендую использовать это с индикаторами тренда. Может использоваться как дополнительное подтверждение для индикаторов поддержки и сопротивления, спроса и предложения. Более подробную
Dynamic Forex28 Navigator — инструмент для торговли на рынке Форекс нового поколения. В НАСТОЯЩЕЕ ВРЕМЯ СКИДКА 49%. Dynamic Forex28 Navigator — это эволюция наших популярных индикаторов, объединяющая мощь трех в одном: Advanced Currency Strength28 Indicator (695 отзывов) + Advanced Currency IMPULSE with ALERT (520 отзывов) + CS28 Combo Signals (бонус). Подробности об индикаторе https://www.mql5.com/en/blogs/post/758844 Что предлагает индикатор Strength нового поколения?  Все, что вам нравило
Индикатор точно показывает точки разворота и зоны возврата цены, где входят крупные игроки . Вы видите, где формируется новый тренд, и принимаете решения с максимальной точностью, держа контроль над каждой сделкой. VERSION MT5     -     Раскрывает свой максимальный потенциал в связке с индикатором  TREND LINES PRO Что показывает индикатор: Разворотные конструкции и разворотные уровни с активацией в начале нового тренда. Отображение уровней  TAKE PROFIT  и  STOP LOSS  с минимальным соотношением
Apollo SR Master — это индикатор уровней поддержки/сопротивления со специальными функциями, которые упрощают и повышают надежность торговли с использованием зон поддержки/сопротивления. Индикатор рассчитывает зоны поддержки/сопротивления в режиме реального времени без задержек, выявляя локальные максимумы и минимумы цены. Затем, для подтверждения сформированной зоны поддержки/сопротивления, индикатор выдаёт специальный сигнал, который сигнализирует о том, что зону поддержки/сопротивления можно у
Если вы покупаете этот индикатор, вы получите мой профессиональный Trade Manager + EA БЕСПЛАТНО. Прежде всего стоит подчеркнуть, что эта торговая система является индикатором без перерисовки, без повторной отрисовки и без задержки, что делает ее идеальной как для ручной, так и для роботизированной торговли. Онлайн курс, руководство и загрузка пресетов. «Smart Trend Trading System MT5» - это комплексное торговое решение, созданное для новичков и опытных трейдеров. Он объединяет более 10 премиаль
В НАСТОЯЩЕЕ ВРЕМЯ СКИДКА 40% Лучшее решение для новичка или трейдера-эксперта! Этот индикатор является уникальным, высококачественным и доступным торговым инструментом, поскольку мы включили в него ряд собственных функций и новую формулу. С помощью всего лишь ОДНОГО графика вы можете определить силу валюты для 28 пар Форекс! Представьте, как улучшится ваша торговля, потому что вы сможете точно определить точку запуска нового тренда или возможность скальпирования? Руководство пользователя:  
Сигнал GoldRush Trend Arrow Индикатор GoldRush Trend Arrow Signal предоставляет точный анализ тренда в режиме реального времени, специально разработанный для высокоскоростных краткосрочных скальперов в XAU/USD. Этот инструмент, созданный специально для 1-минутного таймфрейма, отображает стрелки направления для четких точек входа, позволяя скальперам уверенно ориентироваться в волатильных рыночных условиях. Индикатор состоит из ПЕРВИЧНЫХ и ВТОРИЧНЫХ стрелок оповещения. ПЕРВИЧНЫЕ сигналы — это
Market Structure Patterns   is an indicator based on   smart money concepts   that displays   SMC/ICT   elements that can take your trading decisions to the next level. Take advantage of the   alerts ,   push notifications   and   email messages   to keep informed from when an element is formed on the chart, the price crosses a level and/or enters in a box/zone. Developers can access the values of the elements of the indicator using the   global variables  what allows the automation of trading d
Advanced Supply Demand
Bernhard Schweigert
4.91 (300)
Специальное предложение – скидка 40% Этот индикатор является уникальным, качественным и доступным инструментом для торговли, включающим в себя наши собственные разработки и новую формулу. В обновленной версии появилась возможность отображать зоны двух таймфреймов. Это означает, что вам будут доступны зоны не только на старшем ТФ, а сразу с двух таймфреймов - таймфрейма графика и старшего: отображение вложенных зон. Обновление обязательно понравится всем трейдерам, торгующим по зонам спроса и пре
Этот индикатор исследует ценовую структуру фракталов разных периодов, чтобы определить возможные точки разворота на рынке, предоставляя время позиционным трейдерам, которые уже имеют фундаментальную или техническую модель оценки. В отличие от своего младшего брата, Reversal Fractals , этот индикатор не пропустит развороты из-за выбранного периода и будет находить разворотные фракталы зигзагообразно, игнорируя те развороты, которые не несут достаточного импульса для начала устойчивого движения ц
Индикатор " Dynamic Scalper System " разработан для скальпингового метода торговли внутри трендовых волн. Тестировался на основных валютных парах и золоте, возможна совместимость с другими торговыми инструментами. Дает сигналы для кратковременного открытия позиций по тренду с дополнительным сопровождением движения цены. Принцип действия индикатора. Большие стрелки определяют направление тренда. Внутри трендовых волн действует алгоритм генерации сигналов для скальпинга в виде маленьких стрело
Если вы торгуете на Форекс, наличие подробной информации о силе валют и корреляции валютных пар может вывести вашу торговлю на новый уровень. Корреляция поможет сократить риск вдвое, а анализ силы валют поможет максимизировать прибыль. Этот индикатор предлагает гибридный подход к выбору наиболее подходящих валютных пар, используя анализ силы валют и корреляцию валютных пар. Как использовать анализ силы валют Предположим, ваша торговая стратегия показывает возможность покупки по AUD/JPY, но при
СЕЙЧАС СКИДКА 26% !!! Этот индикатор является супер комбинацией обоих наших основных индикаторов ( Advanced Currency Strength 28   &  Advanced Currency IMPULSE with ALERT ) . Он показывает значения силы валюты для TICK-единиц и предупреждающие сигналы для 28 пар Форекс. Можно использовать 11 различных тик-единиц. Это 1, 2, 3, 4, 5, 6, 10, 12, 15, 20 и 30 секунд. Полоса Tick-Unit во вложенном окне будет показана и сдвинута влево, когда в таймере секунды будет хотя бы 1 тик.  С помощью всего ли
Day Trader Master - это полноценная торговая система для трейдеров, кто ведет внутридневную торговлю. Система состоит из двух индикаторов. Один индикатор представляет собой стрелки-сигналы на покупку и продажу. Именно стрелочный индикатор вы приобретаете. Второй индикатор я предоставлю вам совершенно бесплатно. Второй индикатор является индикатором тренда, специально разработанного для использования совместно с этими стрелками. ИНДИКАТОРЫ НЕ ПЕРЕРИСОВЫВАЮТСЯ И НЕ ЗАПАЗДЫВАЮТ! Использовать данную
KURAMA GOLD SIGNAL PRO (MT4) — Полная Торговая Система XAUUSD с 7-Слойным Фильтром, Автоматическим TP/SL и Оценкой Качества БЕЗ ПЕРЕРИСОВКИ. БЕЗ ПЕРЕПРОРИСОВКИ. БЕЗ ЗАДЕРЖКИ. Каждый сигнал постоянен. То, что вы видите, то и получаете. БОНУС: Купите пожизненную лицензию и получите AI Zone Radar (стоимость $59) + полное руководство PDF БЕСПЛАТНО. Напишите мне после покупки. AI Zone Radar: https://www.mql5.com/en/market/product/175834 ДОВЕРИЕ ТРЕЙДЕРОВ: Уже используется активным сообществом тре
Паттерн «голова и плечи» - это форма диаграммы, которая напоминает базовую линию с тремя вершинами, две внешние - близки по высоте, а средняя - самая высокая. Он предсказывает разворот тренда от бычьего к медвежьему и считается одним из самых надежных паттернов разворота тренда. Это один из нескольких верхних паттернов, которые с различной степенью точности сигнализируют о том, что тренд близится к концу. [ Руководство по установке | Руководство по обновлению | Устранение неполадок | FAQ | Все
Этот индикатор находит паттерны разворота с двойным верхом и двойным дном и генерирует торговые сигналы, используя прорывы. [ Руководство по установке | Руководство по обновлению | Устранение неполадок | FAQ | Все продукты ] Четкие торговые сигналы Настраиваемые цвета и размеры Реализует статистику производительности Настраиваемые уровни восстановления Фибоначчи Он отображает подходящие уровни стоп-лосс и тейк-профит Он реализует электронную почту / звуковые / визуальные оповещения Эти паттер
Gold Scalper Super   — это простая в использовании торговая система. Индикатор можно использовать как отдельную систему для скальпинга на тайм фрейме M1 , а также как часть вашей существующей торговой системы. Бонус: при покупке индикатора, Trend Arrow Super предоставляется бесплатно,напишите нам после покупки MT5 Version -  https://www.mql5.com/en/market/product/165110 Индикатор 100% не перерисовывается!!! Если сигнал появился, он больше Не исчезает! В отличие от индикаторов с перерисовкой,ко
Технический индикатор производящий структуризацию графиков и выявляющий циклические движения цены. Может работать на любых графиках. Несколько типов оповещений. Есть дополнительные стрелки на самом графике. Без перерисовки на истории, работает на закрытии свечи. Рекомендуемые TF от M5 и выше. Прост в использовании и настройке параметров. При использовании 2 индикаторов с разными параметрами можно использовать без других индикаторов. Имеет 2 входных параметра Цикличность и Продолжительность сиг
Индикатор построен на не стандартном Zig Zag ,он отрисовывает накопления  после чего если цена выходит с этой зоны и происходит тест этой зоны,то подаётся звуковой сигнал и появляется стрелка- после закрытия тестовой свечи.Индикатор не перерисовывает свои сигналы,очень прост в использовании,всего три настройки 1- это параметр zig zag 2- это  минимальный выход цены из зоны 3- это максимальный выход цены из зоны.Чем ниже параметр для Zig Zag,тем больше ложного сигнала,но и также чаще точек входа(р
Trend Screener
STE S.S.COMPANY
4.79 (95)
Индикатор тренда, революционное уникальное решение для торговли и фильтрации тренда со всеми важными функциями тренда, встроенными в один инструмент! Это 100% неперерисовывающийся мультитаймфреймный и мультивалютный индикатор, который можно использовать на всех инструментах/инструментах: форекс, товары, криптовалюты, индексы, акции. ПРЕДЛОЖЕНИЕ ОГРАНИЧЕННОГО ВРЕМЕНИ: Индикатор скринера поддержки и сопротивления доступен всего за 65$ и бессрочно. (Изначальная цена 250$) (предложение продлено) Tre
Advanced UT BOT ALERTS for MT4 Профессиональная система обнаружения тренда с многоуровневыми фильтрами | Улучшенный движок UT BOT Мы предоставляем только индикаторы высокого качества. Advanced UT BOT создан для профессионального использования и имеет устойчивую логику сигналов и безопасные расчёты, исключающие задержки или ложные обновления. Он не перерисовывает, не удаляет и не изменяет прошлые сигналы. Все сигналы BUY и SELL генерируются только после закрытия свечи и остаются зафиксированными.
Delta Fusion Pro – Продвинутая Аналитика Order Flow для Внутридневной Торговли Delta Fusion Pro — это профессиональный индикатор для MetaTrader 4, который раскрывает поток агрессивных ордеров, показывая интенсивность и направление институционального давления в реальном времени. В отличие от традиционных объемных индикаторов, он анализирует дельту между объемами Ask и Bid, чтобы предсказывать развороты, подтверждать тренды и выявлять зоны профессионального интереса. Основные Характеристики Инте
Другие продукты этого автора
The Breaker Blocks with Signals indicator aims to highlight a complete methodology based on breaker blocks. Breakout signals between the price and breaker blocks are highlighted and premium/discount swing levels are included to provide potential take profit/stop loss levels. This script also includes alerts for each signal highlighted.   SETTINGS   Breaker Blocks Length: Sensitivity of the detected swings used to construct breaker blocks. Higher values will return longer term break
Multiple Wicks forming at OverSold & OverBought levels create Buying and Selling Pressure. This indicator tries to capture the essence of the buy and sell pressure created by those wicks. Wick pressure shows that the trend is Exhausted. Order block should display when buying or selling pressure wick. When price go inside buy order block and up to outside order block, trader should consider a buy order. If price go inside buy order block and down to outside order block, trader should consider a s
This indicator shows when user set sessions are active and returns various tools + metrics using the closing price within active sessions as an input. Users have the option to change up to 4 session times. The indicator will increasingly lack accuracy when the chart timeframe is higher than 1 hour. Settings Sessions Enable Session: Allows to enable or disable all associated elements with a specific user set session. Session Time: Opening and closing times of the user set session in the  
The indicator returning pivot point based trendlines with highlighted breakouts . Trendline caculated by pivot point and other clue are ATR, Stdev. The indicator also includes integrated alerts for  trendlines  breakouts and foward message to Telegram channel or group if you want. Settings ·          Lookback bar: Default 200 is number of bar caculate when init indicator. ·          Length:  Pivot points  period ·          Slope Calculation Method: Determines how this lope is calculated. We supp
This is a Forex Scalping Trading Sytem based on the Bollinger Bands.  Pairs:Major Time frame: 1M or higher. Spread max:0,0001.  Indicators (just suggestion) Bollinger bands (20, 2); ADX (14 period); RSI   (7 period ). Y ou should only trade this system between 2am to 5am EST, 8am to 12am EST and 7.30pm to 10pm EST. Do not scalp 30 minutes before a orange or red news  report and not for a hour afterwards.   Setup: is for price to move above the lower or lower Bollinger Bands, RSI raise above the
FREE
This is addition of  Effective SV squeeze momentum  that add bolliger band and Keltner channel to chart window.  Squeeze momentum introduced by “John Carter”, the squeeze indicator for MT5 represents a volatility-based tool. Regardless, we can also consider the squeeze indicator as a momentum indicator, as many traders use it to identify the direction and strength of price moves. In fact, the Tradingview  squeeze indicator shows when a financial instrument is willing to change from a trending ma
FREE
ICT Concepts
Minh Truong Pham
5 (2)
The ICT Concepts indicator regroups core concepts highlighted by trader and educator "The Inner Circle Trader" (ICT) into an all-in-one toolkit. Features include Market Structure (MSS & BOS), Order Blocks, Imbalances, Buyside/Sellside Liquidity, Displacements, ICT Killzones, and New Week/Day Opening Gaps. It’s one kind of Smart money concepts. USAGE: Please read this document  !    DETAILS Market Structure Market structure labels are constructed from price breaking a prior extreme point. T
The Inversion Fair Value Gaps (IFVG) indicator is based on the inversion FVG concept by ICT and provides support and resistance zones based on mitigated Fair Value Gaps (FVGs). Image 1   USAGE Once mitigation of an FVG occurs, we detect the zone as an "Inverted FVG". This would now be looked upon for potential support or resistance. Mitigation occurs when the price closes above or below the FVG area in the opposite direction of its bias. (Image 2) Inverted Bullish FVGs Turn into Potenti
Introduction One of the patterns in "RTM" is the "QM" pattern, also known as "Quasimodo". Its name is derived from the appearance of "Hunchback of Notre-Dame" from Victor Hugo's novel. It is a type of "Head and Shoulders" pattern.   Formation Method   Upward Trend In an upward trend, the left shoulder is formed, and the price creates a new peak higher than the left shoulder peak . After a decline, it manages to break the previous low and move upward again. We expect the price to
All about Smart Money Concepts Strategy: Market struture: internal or swing BOS, CHoCH; Orderblock; Liquity equal; Fair Value Gap with Consequent encroachment, Balanced price range; Level with Previous month, week, day level or in day level (PMH, PWH, PDH, HOD); BuySell Stops Liquidity (BSL, SSL); Liquidity Void Long Wicks; Premium and Discount; Candle pattern ... "Smart Money Concepts" ( SMC ) is a fairly new yet widely used term amongst price action traders looking to more accurately navigate
The indicator   returning pivot point based trendlines with highlighted breakouts . Trendline caculated by pivot point and other clue are ATR, Stdev.   The indicator also includes integrated alerts for  trendlines  breakouts   and foward message to Telegram channel or group if you want. Settings ·            Lookback bar: Default 200 is number of bar caculate when init indicator. ·            Length:  Pivot points  period ·            Slope Calculation Method: Determines how this lope is calcula
This all-in-one indicator displays real-time market structure (internal & swing BOS / CHoCH), order blocks, premium & discount zones, equal highs & lows, and much more...allowing traders to automatically mark up their charts with widely used price action methodologies. Following the release of our Fair Value Gap script, we received numerous requests from our community to release more features in the same category. //------------------------------------// Version 1.x has missing functions + PDAr
The Breaker Blocks with Signals indicator aims to highlight a complete methodology based on breaker blocks. Breakout signals between the price and breaker blocks are highlighted and premium/discount swing levels are included to provide potential take profit/stop loss levels. This script also includes alerts for each signal highlighted.   SETTINGS   Breaker Blocks Length: Sensitivity of the detected swings used to construct breaker blocks. Higher values will return longer term break
The ICT Concepts indicator regroups core concepts highlighted by trader and educator "The Inner Circle Trader" (ICT) into an all-in-one toolkit. Features include Market Structure (MSS & BOS), Order Blocks, Imbalances, Buyside/Sellside Liquidity, Displacements, ICT Killzones, and New Week/Day Opening Gaps. It’s one kind of Smart money concepts.   USAGE:   Please read this   document  !      DETAILS Market Structure Market structure labels are constructed from price breaking a prior extreme
The FollowLine indicator is a trend following indicator. The blue/red lines are activated when the price closes above the upper Bollinger band or below the lower one. Once the trigger of the trend direction is made, the FollowLine will be placed at High or Low (depending of the trend). An ATR filter can be selected to place the line at a more distance level than the normal mode settled at candles Highs/Lows. Some features: + Trend detech + Reversal signal + Alert teminar / mobile app
The ICT Silver Bullet indicator is inspired from the lectures of "The Inner Circle Trader" (ICT) and highlights the Silver Bullet (SB) window which is a specific 1-hour interval where a Fair Value Gap (FVG) pattern can be formed. A detail document about ICT Silver Bullet here . There are 3 different Silver Bullet windows (New York local time): The London Open Silver Bullet (3 AM — 4 AM ~ 03:00 — 04:00) The AM Session Silver Bullet (10 AM — 11 AM ~ 10:00 — 11:00) The PM Session Silver Bullet (2
This indicator shows when user set sessions are active and returns various tools + metrics using the closing price within active sessions as an input. Users have the option to change up to 4 session times. The indicator will increasingly lack accuracy when the chart timeframe is higher than 1 hour. Settings Sessions Enable Session: Allows to enable or disable all associated elements with a specific user set session. Session Time: Opening and closing times of the user set session in the  
The liquidity swings indicator highlights swing areas with existent trading activity. The number of times price revisited a swing area is highlighted by a zone delimiting the swing areas. Additionally, the accumulated volume within swing areas is highlighted by labels on the chart. An option to filter out swing areas with volume/counts not reaching a user-set threshold is also included. This indicator by its very nature is not real-time and is meant for descriptive analysis alongside other com
The SuperTrend AI indicator is a novel take on bridging the gap between the K-means clustering machine learning method & technical indicators. In this case, we apply K-Means clustering to the famous SuperTrend indicator.   USAGE Users can interpret the SuperTrend AI trailing stop similarly to the regular SuperTrend indicator. Using higher minimum/maximum factors will return longer-term signals. (image 1) The displayed performance metrics displayed on each signal allow for a deeper interpretat
OVERVIEW A Lorentzian Distance Classifier (LDC) is a Machine Learning classification algorithm capable of categorizing historical data from a multi-dimensional feature space. This indicator demonstrates how Lorentzian Classification can also be used to predict the direction of future price movements when used as the distance metric for a novel implementation of an Approximate Nearest Neighbors (ANN) algorithm. This indicator provide signal as buffer, so very easy for create EA from this indi
This script automatically calculates and updates ICT's daily IPDA look back time intervals and their respective discount / equilibrium / premium, so you don't have to :) IPDA stands for Interbank Price Delivery Algorithm. Said algorithm appears to be referencing the past 20, 40, and 60 days intervals as points of reference to define ranges and related PD arrays. Intraday traders can find most value in the 20 Day Look Back box, by observing imbalances and points of interest. Longer term traders c
An Implied Fair Value Gap (IFVG) is a three candles imbalance formation conceptualized by ICT that is based on detecting a larger candle body & then measuring the average between the two adjacent candle shadows. This indicator automatically detects this imbalance formation on your charts and can be extended by a user set number of bars. The IFVG average can also be extended until a new respective IFVG is detected, serving as a support/resistance line. Alerts for the detection of bullish/be
Consolidation is when price is moving inside a clear trading range. When prices are consolidated it shows the market maker placing orders on both sides of the market. This is mainly due to manipulate the un informed money. This indicator automatically identifies consolidation zones and plots them on the chart. The method of determining consolidation zones is based on pivot points and ATR, ensuring precise identification. The indicator also sends alert notifications to users when a new consolida
This indicator presents an alternative approach to identify Market Structure. The logic used is derived from learning material created by   DaveTeaches (on X) Upgrade v1.10: add option to put protected high/low value to buffer (figure 11, 12) When quantifying Market Structure, it is common to use fractal highs and lows to identify "significant" swing pivots. When price closes through these pivots, we may identify a Market Structure Shift (MSS) for reversals or a Break of Structure (BOS) for co
This indicator provides the ability to recognize the SMC pattern, essentially a condensed version of the Wyckoff model. Once the pattern is confirmed by RTO, it represents a significant investment opportunity.    There are numerous indicators related to SMC beyond the market, but this is the first indicator to leverage patterns to identify specific actions of BigBoy to  navigate the market. Upgrade 2024-03-08: Add TP by RR feature. The SMC (Smart Money Concept)   pattern   is a market analysis m
Created by imjesstwoone and mickey1984, this trade model attempts to capture the expansion from the 10:00-14:00 EST 4h candle using just 3 simple steps. All of the information presented in this description has been outlined by its creators, all I did was translate it to MQL4. All core settings of the trade model may be edited so that users can test several variations, however this description will cover its default, intended behavior using NQ 5m as an example. Step 1 is to identify our Price Ra
The Buyside & Sellside Liquidity indicator aims to detect & highlight the first and arguably most important concept within the ICT trading methodology,   Liquidity   levels. SETTINGS Liquidity Levels Detection Length: Lookback period Margin: Sets margin/sensitivity for a liquidity level detection Liquidity Zones Buyside Liquidity Zones: Enables display of the buyside liquidity zones. Margin: Sets margin/sensitivity for the liquidity zone boundaries. Color: Color option for buysid
The   Liquidation Estimates (Real-Time)   experimental indicator attempts to highlight real-time long and short liquidations on all timeframes. Here with liquidations, we refer to the process of forcibly closing a trader's position in the market. By analyzing liquidation data, traders can gauge market sentiment, identify potential support and resistance levels, identify potential trend reversals, and make informed decisions about entry and exit points. USAGE (Img 1)    Liquidation refers
The   ICT Unicorn Model   indicator highlights the presence of "unicorn" patterns on the user's chart which is derived from the lectures of   "The Inner Circle Trader" (ICT) . Detected patterns are followed by targets with a distance controlled by the user.   USAGE (image 2) At its core, the ICT Unicorn Model relies on two popular concepts, Fair Value Gaps and Breaker Blocks. This combination highlights a future area of support/resistance. A   Bullish Unicorn Pattern   consists out of:
Overview The   Volume SuperTrend AI   is an advanced technical indicator used to predict trends in price movements by utilizing a combination of traditional SuperTrend calculation and AI techniques, particularly the k-nearest neighbors (KNN) algorithm. The Volume SuperTrend AI is designed to provide traders with insights into potential market trends, using both volume-weighted moving averages (VWMA) and the k-nearest neighbors (KNN) algorithm. By combining these approaches, the indicator
Фильтр:
Нет отзывов
Ответ на отзыв