Смотри обучающее видео по маркету на YouTube
Как купить торгового робота или индикатор
Запусти робота на
виртуальном хостинге
виртуальном хостинге
Протестируй индикатор/робота перед покупкой
Хочешь зарабатывать в Маркете?
Как подать продукт, чтобы его покупали
Технические индикаторы для MetaTrader 4 - 33

The Bolliger Bands On-Off let you control the indicator using the keyboard or a button . You can choose if you want the indicator always shown or always hided while switching among different time frames or financial instruments . ---> This indicator is part of Combo Indicator OnOff
The Bollinger Bands identify the degree of real-time volatility for a financial instruments . A lower amplitude corresponds to a low volatility, conversely a greater bandwidth corresponds to high volatility. Na
FREE

Uncomplicated straightforward indicator that shows the maximum account drawdown since the indicator was added to the chart. The indicator does not take transaction history into account since it is impossible to calculate drawdown from historical entries en closures of trades. The indicator will be free in this basic form. Eventually it will be developed but the focus is to keep it plain and simple.
FREE

Покупайте и продавайте сигналы с помощью Гистограммы MACD. Интерфейс прост и прост для понимания. Вы можете перзонализировать индикатор несколькими способами в соответствии с его визуальным стилем или, что еще более важно, его настройкой параметров для обнаружения рыночных сигналов. Используя опцию Мультипликатора в меню, можно увеличить период индикатора, хотя рекомендуется использовать настройки по умолчанию.
FREE

Relative Strength Index Cross [RSI Cross] A combination of 2 RSI to create a crossover trading setup Input parameters: signal mode: set it to true if you want to plug it into STAT (Signal Tester and Trader) arrow shift: distance between fast EMA line to arrow on chart price line filter fast RSI period slow RSI period RSI price method price upper level price lower level You can find the best setting for 4 hour EURUSD on this video
FREE

Traders Dynamic Index (TDI) Signal Input parameters: signal mode: set it to true if you want to plug it into STAT (Signal Tester and Trader) arrow shift: distance between fast EMA line to arrow on chart middle band filter price line filter RSI period RSI price method Volatility period MA period 1 MA period 2 Averaging method You can find the best setting for 4 hour EURUSD on this video
FREE

Description:
This Free Indicator will allow you to monitor the Max/Min spread in a bar/candle. By running it 24h/24h will allow you to recognize which period of time having maximum spread, based on that you will understand the market more, and could develop/improve to have better trading strategy.
Parameters: limit: <specify the limit of spread, above which the indicator will mark the price, at which high spread occurs>
Note: Beside the price marked due to high spread above, the indicator al
FREE

Cross Trend Lines indicator trend indicator of find. This indicator, an array of works by using a series of indicator and algorithm. Uses two lines to find trends. The intersection of this line means that the start of the trend. These lines are green, tend to rise. Red lines indicate the downward trend. Use of this indicator is easy to understand. This indicator on its own or you can use other indicators that are appropriate for the strategy.
Suggestions and Features Starts a new trend at the
FREE

Индикатор отображает различными цветами на фоне графика три торговые сессии. Открытие - закрытие Лондон, Нью Йорк, Токио по умолчанию. Применение Для успешной торговли важно знать начало и конец торговых сессий с наибольшей ликвидностью, так как именно в это время цена делает самые большие движения.
Особенности Настройки по умолчанию - торговые сессии по Лондону, Нью Йорку, Токио. Возможность выставить свои рамки тоговых сессий Алерт при открытии сессии Показ открытия дня по GMT Настройки для
FREE

The Sessions Partition Indicator draws clear, accurate session separators for the Sydney, Tokyo, London, and New York trading sessions.
It automatically adapts to your broker’s server time and allows full GMT customization. Designed especially for IC Markets (Winter – GMT+2) , this indicator gives traders a clean visual structure of the market’s intraday phases – making session-based strategies MUCH easier to follow. Key Features 4 Major Forex Sessions Marked Sydney Session Tokyo Session Lon
FREE

Индикатор Currency Strength Matrix (CSM) показывает текущую силу основных валют на нескольких таймфреймах, позволяя сортировать валюты по силе и обнаруживать потенциально прибыльные пары. Индикатор идеален для скальпинга и во время резких сильных движений.
Как она работает? CSM сравнивает значение текущей скользящей средней с такое же скользящей средней на предыдущей свече для всех 28 пар и 9 таймфреймов, формируя таблицу силы всех отдельных валют. Затем валюты сортируются по силе на определенн
FREE

The ' Average Bar Chart ' indicator was created to showcase the traditional Heiken Ashi calculation as an exotic charting style. This indicator is known for reducing chart noise for a smoother price action. A dditional indicators are recommended
Key Features Candlesticks for OHLC are removed from the chart. Average bars may be shown as complete bars without tails. All functionality and features of this exotic chart are inputs.
Input Parameters Chart Timeframe = PERIOD_CURRENT; - period to set
FREE

Отличный полезный инструмент, с помощью которого вы можете в режиме реального времени отслеживать рост вашего счета и распространение символа. Это будет знать, как точно идентифицировать данные, чтобы знать, например, есть ли у вас учетная запись Prop Firm, чтобы знать правильный Laverage, манипулируют ли спредом и т. д., чтобы сделать точный лот.
Сочетание кредитного плеча и индикатора спреда. Инструменты для автоматической проверки кредитного плеча и спреда на вашем торговом счете. Работа во
FREE

HZZM - это адаптивный зигзаг, построенный на модификации индикатора HZZ (исходный код доступен в статье ). Наиболее важные изменения: добавлено 2 индикаторных буфера, позволяющих отслеживать построение новых отрезков зигзага - в точках, где сменяется направление зигзага, выводятся цветные крестики; диапазон зигзага (H) может автоматически определяться в движении на основе дневного диапазона; диапазон зигзага может изменяться в зависимости от времени существования текущего отрезка. Параметры: H
FREE

Designed to mark a specific price and time point on an MT4 chart based on a single mouse click, synchronizing this data across all timeframes for the same symbol. Its primary purpose is to help traders pinpoint and track critical levels or events (e.g., support/resistance or entry points) with persistent visual markers. The indicator uses dashed lines for price and time crosshairs, accompanied by labels that dynamically adjust to stay within chart boundaries, ensuring clarity regardless of win
FREE

Индикатор выводит на график инструмента результаты торговли. Доступно управление цветом и шрифтом выводимых результатов, а также обработка сделок заданного магического номера. Если несколько сделок закрыто в течение одного бара текущего таймфрема, то результат по ним складывается и выводится одним значением.
Параметры утилиты Plot profit in - формат вывода результатов в валюте депозита с учетом комиссии и swap или в пунктах; Start from - начать обработку результатов с этого времени; Plot last d
FREE

Индикатор вычисляет и рисует линии на графике. Два типа тренда: Тренд A: линия отрисовывается по локальным минимумам для восходящих трендов и по локальным максимумам - для нисходящих. Тренд Б: линия отрисовывается по локальным максимумам для восходящих трендов и по локальным минимумам — для нисходящих. Нужно, чтобы ситуация полностью удовлетворяла нескольким условиям, которые можно настроить во входных параметрах (см. также рис. 4): MinBarAge : количество баров до последней базовой точки линии н
FREE

The product Divergence Cci Force Stddev Ac Atr is designed to find the differences between indicators and price. It allows you to open orders or set trends using these differences. The indicator has 4 different divergence features.
Divergence types Class A Divergence Class B Divergence Class C Divergence Hidden Divergence
Product Features and Rec ommendations There are 5 indicators on the indicator Indicators = CCI, Force, Stdandard Deviation, Acelereator, Atr 4 different divergence type
FREE

Индикатор Канал Кельтнера представляет собой канал идущий вдоль скользящей средней , ширина которого задается путем вычисления среднего истинного диапазона на периоде скользящей средней. Этот индикатор можно применять для получения сигналов, а также в качестве замены индикатору Конверт скользящей средней , перед которым имеет преимущество в качестве авто подбора ширины канала, который можно подкорректировать параметром Size of channel in percent .
Параметры индикатора Period of indicator - Пери
FREE

Smart Scalper's Edge: The Triple-Filter Signal Tired of chasing false signals? The "Smart Scalper's Edge" is your unfair advantage in the market, designed for traders who demand precision and confirmation. This indicator doesn't just rely on a simple crossover; it uses a powerful triple-confirmation system to filter out the noise and pinpoint high-probability trading opportunities. Get the clarity you need to enter the market with confidence! Key Advantages: Trade Smarter, Not Harder Filter Out
FREE

MTF Heiken Ashi MA - мультитаймфреймовый индикатор Heiken Ashi и скользящей средней. Полностью настраиваемый индикатор для продвинутых и уникальных расчетов Heiken AshiHeiken Ashi и скользящей средней (HA-Bodies).
Основные возможности Три значения баров на истории - закрытия, максимума и минимума. Мультитаймфреймовый характер; особенно полезно для свинговых стратегий. Не перерисовывается; хороший инструмент для скальперских стратегий.
Входные параметры Timeframe = PERIOD_CURRENT - таймфрейм ск
FREE

InpRSIshort =13; // RSI short InpRSIPeriod =34; // RSI long PeriodRs =0; //Price 0C 4HL/2 5HLC/3 mafast =13;//mafast maslow =65;//MAslow
Double line RSI sub graph index. The parameters are adjustable. The RSI lines with two different cycles can be used to observe the trend strength effectively. Meanwhile, a short period cross long period color column image is displayed below. When the cycle (Jin Cha) is on the short cycle, the color of the column map changes from the light green to the
FREE
MACD Optimiser – AI-Enhanced MACD Settings for Smarter Trading The MACD Optimiser is an advanced tool that supercharges the classic MACD indicator by automatically finding the best parameter settings for different market conditions. Powered by AI and historical data analysis, it eliminates guesswork and helps traders make more precise, data-driven decisions. Why Use MACD Optimiser? Automated Optimization – No more trial-and-error. The tool fine-tunes the MACD’s fast EMA, slow EMA, and sign
FREE

The Icarus Reversals(TM) FREE Indicator is a powerful tool to identify high-probability reversal points, across all instruments. The Reversals Indicator provides traders and investors with a simple-to-use and highly dynamic insight into points of likely price-action reversals. Generated by a unique proprietary code-set, the Reversals Indicator (FREE version) generates long and short trade signals, which can be customised for key inputs and colourisation. Settings of the Icarus Reversals FREE h
FREE

Что такое Squeeze? Сокращение полос Боллинджера внутри канала Кельтнера отражает перерыв и консолидацию на рынке и обычно рассматривается как потенциальный индикатор последующего направленного движения или больших колебательных движений. Когда полосы Боллинджера выходят за пределы канала Кельтнера, это означает переход рынков от низкой волатильности к высокой - информация, которую ищут все трейдеры. Различия
Squeeze FREE
Squeeze
Squeeze PRO Количество таймфреймов
1
5
10
Пользовательские наст
FREE

ATR Channels_PRT indicator can be used to identify trend and support and resistance levels.The price chart of a currency pair displays three price channels that are plotted using moving averages and the ATR value.
Indicator settings allow you to assign a specific coefficient to each price channel, which makes it possible to narrow or expand each channel separately. The ATR Channels_PRT indicator is a multicurrency instrument, so the choice of a timeframe depends solely on the trader’s preferenc
FREE

The Sentiment Ratio indicator gauges current Market Sentiment between -100% and 100%, where lower than -40% is considered Bearish and higher than 40% is Bullish. The channel between the two is considered Neutral. The indicator has been a very useful filter tool for signals within a trading system.
Example call function: int SentimentIndicator(double triggerLevel)//Return sentiment if trigger level is activated { double sentimentRatio=iCustom(NULL,0,"Sentiment Ratio",0,0,0); if(sentimentRat
FREE

This indicator helps you to scan symbols which are in the Market Watch window and filter out a trend according to RSI.
The relative strength index (RSI) is a technical indicator used in the analysis of financial markets. It is intended to chart the current and historical strength or weakness of a stock or market based on the closing prices of a recent trading period. The indicator should not be confused with relative strength. The RSI is classified as a momentum oscillator, measuring the veloci
FREE

STOCHASTIC Dashboard Panel This indicator helps you to scan symbols which are in the Market Watch window and filter out a trend according to STOCHASTIC .
In technical analysis of securities trading, the stochastic oscillator is a momentum indicator that uses support and resistance levels. Dr. George Lane developed this indicator in the late 1950s.[1] The term stochastic refers to the point of a current price in relation to its price range over a period of time.[2] This method attempts to pre
FREE
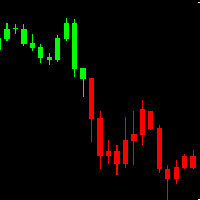
AH Candles MT4 AH Candles MT4 is a new product that allows identifying the current market phase (uptrend and downtrend ).
This indicator paints bars in different colors depending on the current state of the market trend ( Green and Red )
AH Candles MT4 is use for trading currencies
Advantages Suitable for intraday and swing trading. The indicator base on EMA method to calculate Period Parameters It can be used as a standalone tool or together with other indicators.
How to use the prod
FREE

This is a tool to measure the velocity of the price. It's completely free, you can download and use. "Way: distance of price after one tick." "Speed: price velocity after one tick." p/s: The time for the price to jump 1 tick will not be fixed, you should know this. If Way > 0, the indicator will change color to Green If Way < 0, the indicator will change color to Red || I am a 3D artist and I love math and programming! ||
FREE

STRUCTURAL TREND LINES - MT4 Indicator
Simple indicator that automatically draws trend lines based on market structure.
Features:
- 3 degrees of structure detection (short, medium, long term)
- Configurable swing strength for each degree
- Single color per degree for clean visualization
- Adjustable number of lines per degree
- Customizable colors and line widths
How it works:
The indicator identifies swing highs and lows based on the strength parameter,
then connects these points to create t
FREE

A pin bar pattern consists of one price bar, typically a candlestick price bar, which represents a sharp reversal and rejection of price. The pin bar reversal as it is sometimes called, is defined by a long tail, the tail is also referred to as a “shadow” or “wick”. The area between the open and close of the pin bar is called its “real body”, and pin bars generally have small real bodies in comparison to their long tails.
The tail of the pin bar shows the area of price that was rejected, and t
FREE
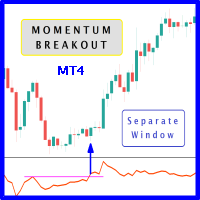
When prices breakout resistance levels are combined with momentum oscillator breaks out its historical resistance levels then probability emerges to record farther prices. It's strongly encouraged to confirm price breakout with oscillator breakout since they have comparable effects to price breaking support and resistance levels; certainly short trades will have the same perception. Concept is based on find swing levels which based on number of bars by each side to confirm peak or trough and in
FREE

Tired of using the same technical indicators? The "Tekno RSI" is an innovative tool designed to make the interpretation of the Relative Strength Index (RSI) more intuitive and accessible to traders of all levels. It displays the RSI as a 3-color histogram, providing a clear and intuitive visual representation of market conditions.
1)Key Features 3-Color Histogram: RSI is a versatile indicator providing insights into market direction and potential reversal points. However, when analyzing the cha
FREE
Индикатор определяет зоны перекупленности и перепроданности на разных временных интервалах. Стрелки обозначают тенденцию рынка на разных тайм сессиях. Если рынок вышел из зоны перепроданности, то стрелка будет сигнализировать о восходящем тренде (стрелка вверх), если рынок вышел из зоны перекупленности, то стрелка будет сигнализировать о нисходящем тренде (стрелка вниз). В правом нижнем окне отображается ситуация на том тайм-фрейме, на котором установлен индикатор. В нем представлена информация
FREE

MultiFiboDynamicMT4 - мощный, профессиональный индикатор для оценки важных уровней поддержки и сопротивления. Главное преимущество - он строит уровни Фибоначчи на всех временных периодах одновременно, что позволяет трейдеру видеть полную картину возможного движения цены торгового инструмента!
Преимущества индикатора Индикатор прекрасно подходит для скальпинга и торговли бинарными опционами; Подходит для начинающих и опытных трейдеров; Работает на любых таймфреймах; Работает на любых финансовых
FREE

Двойной RSI по временным рамкам - это новый технический индикатор, предназначенный для трейдеров, которые хотят сравнивать показатели Индекса Относительной Силы (RSI) из двух различных временных рамок на одном графике. Эта двойная перспектива позволяет трейдерам более эффективно идентифицировать подтверждения трендов и дивергенции. Например, трейдер может использовать RSI с одночасового графика наряду с дневным RSI, чтобы убедиться, что краткосрочные сделки соответствуют более широкому рыночному
FREE

Ещё один простой информационный индикатор. Данный индикатор показывает текущий спред по валютному инструменту и стоимость одного пункта объёмом 0,10 лота.
О понятии Cпред Спред (от английского слова spread «разброс») — разница между ценами на покупку (Ask) и на продажу (Bid) какого-либо актива на фондовой или валютной бирже. Чтобы разобраться, что такое Spread и как он важен для торговли на валютном рынке, вспомним Центральные Банки и обмен валюты в них. Там мы всегда видим разницу между ценой
FREE

Indicator support for only: Entry Point to Trend Pro Link indicator support : https://www.mql5.com/en/market/product/70867
Supports all currency pairs declared in the definition. Help investors do not need to open many charts. Notice the DEAL: multiple time frames confluence M15, H1, H4.
Entry Point to Trend Pro The indicator helps investors to identify the earliest and perfect reversal point. Easy to make decision to trade with the trend Price action trading. support resistance an
FREE

APP System Signals — это технический индикатор, предназначенный для активных пользователей финансовых рынков. Он предоставляет сигналы на покупку и продажу на основе комбинации инструментов, таких как экспоненциальные скользящие средние (EMA), простые скользящие средние (SMA) и анализ тренда. Индикатор имеет полностью настраиваемые параметры, что позволяет адаптировать его под индивидуальные предпочтения и подход к торговле. Он разработан с учетом удобства использования и подходит как для начина
FREE

Necessary for traders: tools and indicators Waves automatically calculate indicators, channel trend trading Perfect trend-wave automatic calculation channel calculation , MT4 Perfect trend-wave automatic calculation channel calculation , MT5 Local Trading copying Easy And Fast Copy , MT4 Easy And Fast Copy , MT5 Local Trading copying For DEMO Easy And Fast Copy , MT4 DEMO Easy And Fast Copy , MT5 DEMO Fibo: from KTrade 1. Automatically calculate and analyze the band. -> Get the desired band 2.
FREE

the AK CAP toolbox free to use;
it includes the same indicators we use for our daily trading and we think the simpler the better. Lightweight indicator for use on all timeframes. that includes VWAP with vwap value indicator on top right. 3 EMA: FAST, MEDIUM, SLOW the candle timer to show how much time left in a candle.
colors and positions are fully customizable.
enjoy
FREE

Hello all. This indicator helps you to open a trade, when break out occurred, also you can add to your position and ride it if trend continued. I use it on 1-5 min chart, as you can use short stop loss. Also profit target should be small as well. It is better to enter few small position, so you can book some profit early and ride the rest for bigger gains. Look at the past to have a plan. Enjoy.
FREE

Hello. Another free indicator from Sepehr! ;) You can determine the trend with this tool. Using crosses of two Moving averages, you can say that the trend is going to be bullish or bearish; A fast-moving average and a slow one. When the fast-moving crosses up the slow-moving, it's going to be an uptrend and when it crosses down the slow-moving, it means that you are going to have a downtrend. That's easy ;) Hope to enjoy it Sepehr(Faran)
FREE

The Awesome Oscillator (AO) Signal Candle Indicator is an indicator used to measure market momentum. Awesome Oscillator (AO) Signal Candle Indicator will change bar's color when set overbought or oversold levels reach. Colored Candles, based on Awesome Oscillator (AO) Signal.
-If the indicator is above zero, the market is bullish. -If the indicator is below zero, the market is bearish. -If the market is bullish, you can take a stand with green candle signals. -If the market is bearish,
FREE

Описание Продукт основан на применении скользящей средней к индикатору RSI. Подтвержденные пересечения скользящей средней с линией RSI отмечаются стрелками на графике. При пересечении снизу вверх отображается стрелка на покупку и наоборот. Стрелки не перерисовываются, так как индикатор использует лишь подтвержденные значения и ожидает закрытия свечи перед тем, как вывести стрелку на график. Индикатор также может выдавать алерты при появлении стрелок. Предусмотрены 3 типа алертов - всплывающие, о
FREE

Семафорный индикатор основан на стандартном индикаторе RSI, на который наложен индикатор Envelopes, который показывает конверт или границы колебания индикатора. Это версия индикатора RSI vs Envelopes Graph который рисуется в отдельном окне . Сигнал на продажу возникает, когда верхний конверт/граница пробивается индикатором RSI сверху вниз. Сигнал на покупку возникает, когда нижний конверт/граница пробивается индикатором RSI снизу вверх. Индикатор имеет возможность рисовать стрелки на индикаторе,
FREE

Еще никогда отслеживание важных параметров торгового счета не было таким простым занятием! PZ Risk Management помогает поддерживать ваш счет в хорошей форме. Удивительно прост в освоении Не содержит ничего лишнего Вычисляет подверженность активов риску (exposure) по парам и валютам Всегда держит под контролем размер используемого кредитного плеча Быстро оценивает размер валютного риска (currency exposure) Оранжевые метки обозначают зоны особого внимания Красные метки предупреждают об опасности С
FREE

Индикатор "Buy Sell zones x2" основан на принципе "остановка/разворот после сильного движения". Поэтому, как только обнаруживается сильное безоткатное движение, сразу после остановки - рисуется зона покупок/продаж. Зоны отрабатывают красиво. Или цена ретестит зону и улетает в космос, или пробивает зону насквозь и зона отрабатывается с другой стороны так же красиво. Работает на всех таймфреймах.
Лучше всего выглядит и отрабатывает на Н1.
Может использоваться как: индикатор зон, где лучше вс
FREE

Chart Time — очень простой индикатор, но он может быть очень важным помощником для контроля времени перед открытием сделки вручную. В индикаторе есть три варианта отображения времени на графике.
Входные параметры Show Time : выбор вариантов отображения времени. Local Time (локальное время компьютера), Server Time (время сервера брокера) или GMT. Рекомендации: Индикатор надо запускать на каждом необходимом графике.
FREE

Индикатор на основе (Williams` Percent Range) анализирует касания сигнальной линии по стенкам канала и формирует зоны для принятия решения о направлении хода цены. Для удобства встроена функция оповещения. Также можно включать и отключать искомые зоны. На одном графике можно использовать несколько индикаторов с разными настройками. Это поможет подобрать оптимальную стратегию.
FREE

Multi-Asset Forex Scanner
This indicator allows you to scan multiple assets at once, sending you configurable alerts when any asset touches daily pivot levels 1, 2 or 3.
The original code was just modified to send alerts to MT4 Desktop, MT4 Mobile or Email. (Credits for the original code go to Carlos Oliveira)
In order to receive mobile or Email alerts you must configure Notifications and Email sections in the MT4 platform.
In addition to pivots, this indicator also shows ATR, Volume, RSI,
FREE

This indicator show all history orders on chart with the same symbol. It help you see time and price that orders opened and closed. 1) Show all history 2) Open chart with symbol that you need to watch 3) Attach the indicator 4) Press key "h" -Downwards line Blue: sell with profit -Downwards line Red: buy with loss -Upwards line Blue: buy with profit -Upwards line Red: sell with loss.
FREE

ATSCStrategy is a versatile indicator designed for both binary options and forex markets. Empower your trading strategies with this dynamic tool, providing valuable insights for making informed decisions in the fast-paced world of binary options and forex trading.
-Forex Market
-Binary Option Market
-Binary use timeframe 1M - 5M
-Forex use timeframe M30 or high
FREE

Harami is a two candle pattern with recent candle formed inside the previous candle's high and low . It represents indecision in the market and is used for breakout price action trading strategy. This indi fires all signals to a dashboard on the chart including pop_up alert, push to phone notification and email. Harami has two types, bullish and bearish pattern. Enter long for bullish Harami and enter short for bearish Harami. Inputs : Currency Symbols: EURUSD,GBPJPY,USDJPY,USDCAD (default) , u
FREE
Version History : Date Version Changes 6/20/2022 1.00 Initial release 6/21/2022 1.10 Add global variables for Minimum (SYMBOL_volume_min) and Maximum (SYMBOL_volume_max) History Volumes Description : RedeeCash Volumes Indicator is the Volumes indicator that you have come to trust for market entry and exit with the added benefit of exposing key metrics as global variables. Including global variables in an indicator permits easier interaction with expert advisors (EA) and scripts. When attaching
FREE

Я создал этот простой индикатор, когда изучал TheStrat Роба Смита, и он оказался настолько полезным, что я решил поделиться им с вами. Если вы сочтете это полезным, посмотрите другие индикаторы, которые я опубликовал на MQL5. Индикатор просто рисует на графике одну линию, показывающую выбранный вами уровень цены на более высоком таймфрейме. Используя настройки, вы имеете полный контроль над отображаемым таймфреймом, но по умолчанию он сам рассчитывает более высокий таймфрейм, просто перемещаяс
FREE
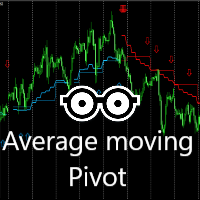
Этот индикатор очень эффективен для повседневной торговли.
Комбинация скользящих средних и расчета 2X Pivots для получения очень убедительного сигнала каждый день.
Синий цвет сигнализирует о возможности покупки. Следуйте стрелкам для возможных точек покупки. Синие опорные точки и средняя линия, служит возможной поддержкой. Красный цвет сигнализирует о возможности продажи. Следуйте стрелкам для возможных точек продажи. Красные точки разворота и средняя линия, служит возможным сопротивлением. Л
FREE

Индикатор RS 24 Titanium- э то мультивалютный и мультитаймфреймовый сигнальный индикатор, созданный по авторскому алгоритму. П редназначен для быстрой оценки тренда (настроения участников рынка) на всех таймфреймах одновременно, по конкретному финансовому инструменту. RS 24 Titanium сканирует показания со всех таймфреймов по одному финансовому активу и выводить данные в виде наглядной таблицы. Индикатор может использоваться с любым брокером (с 4/5-значными котировками). Полученные торговы
FREE

Линии сопротивления скорости - м ощный инструмент для определения тренда и линий сопротивления. Индикатор строит линии с использованием экстремумов графика и специальных математических формул. Индикатор можно использовать для определения направления тренда и точек разворота. <---------------------------->
Параметры индикатора: "Depth of search" - глубина (в барах) поиска экстремумов графика "Back step of search" - минимальное расстояние (в барах) между экстремумами "Deviation of price" - допус
FREE

Never miss a trend change again! This indicator uses various calculation methods based on price action to detect changes in the direction of the trend. It can be used on high timeframes (from H1 to D1) and is most suitable for H4 and Daily timeframe. This indicator is compatible with all broker symbols (forex, indices, CFD, commodities, crypto…). It is also possible to open the indicator on several charts to follow several symbols at the same time. In addition, you don't have to stand by your P
FREE

Spread Sekanas: The True Cost of Your Trade Stop guessing with pips and points. Start seeing the real , proportional cost of the spread with the Spread Sekanas indicator. The traditional spread, measured in pips, is misleading. A 2-pip spread on EUR/USD is completely different from a 2-pip spread on GBP/JPY or a $2 spread on Gold. This makes it impossible to consistently compare your real trading costs across different instruments. The Spread Sekanas indicator solves this problem by measuring th
FREE

Это алгоритм для раннего обнаружения изменений тренда. Вы должны попробовать несколько значений для параметра мультипликатора (1 < <10 рекомендуется). На первый взгляд вы можете увидеть эффективные записи. Это, по сути, один из строк, что Гелег Faktor первоначально было. Но он был удален, потому что он больше не нужен. Других строк было достаточно для эффективности G.Faktor, но я все еще хотел поделиться этим. Всегда тест, прежде чем использовать его на живой счет, так что вы полностью понимаете
FREE

Описание Цветной индикатор для раскраски настроений рынка линейного графика в окне основного финансового инструмента. Полезен для поиска линий поддержки и сопротивления. Назначение Индикатор может быть использован для ручной или автоматической торговли в составе советника. Для автоматической торговли могут быть использованы показания индикаторных буферов типа double : повышающаяся линия - буфер 0, не должен быть равным EMPTY_VALUE. понижающаяся линия - буфер 1, не должен быть равным EMPTY_
FREE

This Dashboard is free to download but is dependent on you owning the Flag Trend Pro MT4 indicator. Down load the indicator: Flag Trend Pro
The Dashboard will show you on a single chart all the timeframes (M1 to Monthly) with their own status for the indicator: Gold Pro MT4
all time frame and all symbol: smart algorithm detects the trend, filters out market noise and gives entry signals!!!
How to understand the status: symbol - Fill All the Pair what you want. M1, M5, M15,M3
FREE

Индикатор PipTick OHLC показывает текущие и исторические значения минимума, максимума, открытия, закрытия и средне цены на выбранном периоде. Он может отображать текущие значения или значения за предыдущую сессию. Диапазоном для расчета индикатора может быть дневная, недельная, месячная или любая выбранная пользователем сессия.
Уровни Максимум текущей или предыдущей сессии. Минимум текущей или предыдущей сессии. Открытие текущей или предыдущей сессии. Закрытие текущей или предыдущей сессии. Сре
FREE

Unleash Your Trading Potential with the Apex Trend Detector! Are you tired of missing out on profitable trades? Do you struggle to find reliable entry and exit points in the volatile forex market? It's time to upgrade your trading arsenal with the Apex Trend Detector – the intelligent MT4 indicator designed to cut through market noise and pinpoint high-probability trading opportunities! The Apex Trend Detector isn't just another indicator; it's a sophisticated signal system that expertly fuses t
FREE
Intraday Pulse – Indicatore per il Prezzo Medio Intraday Intraday Pulse è un indicatore progettato per determinare il prezzo medio intraday alla chiusura giornaliera del grafico. Grazie al suo algoritmo avanzato, traccia automaticamente il livello di riferimento, fornendo un supporto essenziale per strategie di trading efficaci. Nota bene: il grafico giornaliero e' ideale per utilizzare l'indicatore (D1). Aggiorna il time frame alla fine della sessione giornaliera.
L'indicatore è versatile e ut
FREE

This indicator is the translated version of Kıvanç ÖZBİLGİÇ's PMAX Indicator, developed on the Matriks Data Terminal, into the MQL4 language. It is a trend-following indicator and quite successful. Its usage will be free and unlimited for a lifetime. You can click on my profile to access the MQL5 version of this indicator. You can also get your programming requests for MQL4 and MQL5 languages done at İpek Bilgisayar with an invoiced service. You can reach İpek Bilgisayar at www.ipekbilgisayar.or
FREE
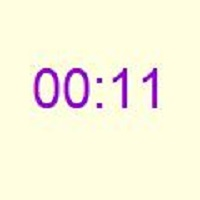
Индикатор "Время до закрытия свечи" (TimeToBarEnd)
Этот технический индикатор предназначен для точного отслеживания времени до закрытия текущей свечи на графике. Он отображает обратный отсчет в формате минуты:секунды, что особенно полезно для внутридневных трейдеров и скальперов, которым важно знать точное время закрытия текущей свечи. Индикатор обновляется в режиме реального времени и позволяет гибко настроить его внешний вид. В настройках доступны: выбор расположения из четырех углов графика,
FREE
А знаете ли вы, почему MetaTrader Market - лучшее место для продажи торговых стратегий и технических индикаторов? Разработчику у нас не нужно тратить время и силы на рекламу, защиту программ и расчеты с покупателями. Всё это уже сделано.
Вы упускаете торговые возможности:
- Бесплатные приложения для трейдинга
- 8 000+ сигналов для копирования
- Экономические новости для анализа финансовых рынков
Регистрация
Вход
Если у вас нет учетной записи, зарегистрируйтесь
Для авторизации и пользования сайтом MQL5.com необходимо разрешить использование файлов Сookie.
Пожалуйста, включите в вашем браузере данную настройку, иначе вы не сможете авторизоваться.