Смотри обучающее видео по маркету на YouTube
Как купить торгового робота или индикатор
Запусти робота на
виртуальном хостинге
виртуальном хостинге
Протестируй индикатор/робота перед покупкой
Хочешь зарабатывать в Маркете?
Как подать продукт, чтобы его покупали
Технические индикаторы для MetaTrader 4 - 32

Ultimate Super Rejection Zones is a powerful MT4 indicator designed to detect accurate intraday reversal points using a combination of: Previous Day High & Low Midline equilibrium zone Rejection candle patterns Double-layer confirmation using two Stochastic filters Smart alert and arrow system Daily auto-reset filtering Optional trend filter using Moving Averages The indicator helps traders find high-probability reversal entries at premium and discount zones.
It automatically marks: ️ Sell Reje

Или «МАК». Этот индикатор разработан, чтобы помочь вам уловить тренд и торговать по нему. Идею этого индикатора можно объяснить следующими шагами:
Нарисуйте быстро движущийся средний конверт. Нарисуйте конверт медленных средних. Верхняя полоса MAC - это наивысшее значение между максимумом обоих конвертов. Нижняя полоса MAC - это самое низкое значение между минимумом обоих конвертов. Облако гистограммы MAC заполняет расстояние между двумя полосами, чтобы показать вам изменение направления. Синее

PLEASE HELP REVIEW/ SUPPORT/ SHARE THIS OTHER INDICATOR HERE https://www.mql5.com/en/market/product/51637 AS YOU DOWNLOAD THIS ONE FOR FREE. THANKS.
The indicator was created to make trading very easy to understand. It is based on five moving average crosses and pivot points. Download the "EASY TREND" on my Product list for a more advanced and profiting trades. You can trade with this indicator alone and get the maximum out of the market. If you are a new trader, just open your chart window
FREE
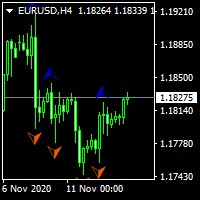
...................................................custom fractal............................................... .................................fractal is very help full to find waves and ............................... ...the defult fractal at meta trader dosent have input parameters and cant find any waves.. .............................................this is fractal with input......................................... ................................................for find any waves.......
FREE

This indicator filters the Zigzag indicator to calculate the main support and resistance
levels.
Variables
minimum gap between peaks : is the distance (GAP) between the peaks of
the Zigzag
peaks sensitivity : Minimum number of nearby peaks
look back: it means that it has to test the last 50 peaks in the Zigzag
object name perfix: a prefix for level’s line name on chart
FREE

The principle of this indicator is very simple: detecting the candlestick pattern in D1 timeframe, then monitoring the return point of graph by using the pullback of High-Low of D1 Candlestick and finally predicting BUY and SELL signal with arrows, alerts and notifications. The parameters are fixed and automatically calculated on each time frame. Example:
If you install indicator on XAUUSD, timeframe D1: the indicator will detect the reversal, pullback, price action on this timeframe (for exam
FREE

Trend indicator derived from T3 moving averages. The cloud is bounded by a fast T3 and slow T3 lines. Buying/Selling opportunities above/below cloud. The fast and slow T3 MA lines can also be used as dynamic support/resistance for more aggressive entries. Use default values for best settings. The number of look back bars is user defined. This indicator can be used in combination with other strategies such as price action. Suitable for all time frames. Prerequisites: T3IndiSlow and T3IndiFast in
FREE
Целью этой новой версии стандартного MT4 индикатора, входящего в поставку платформы, является отображение в подокне нескольких таймфреймах одного и того же индикатора. См. пример, приведенный на рисунке ниже. Однако индикатор отражается не как простой индикатор MTF. Это реальное отображение индикатора на его таймфрейме. Доступные настройки в индикаторе FFx: Выбор таймфрейма для отображения (от M1 до MN) Установка ширины (количество баров) для каждого окна таймфрейма Всплывающее оповещение/звуков
FREE

Данный индикатор находит сильные трендовые движения валютной пары на заданном количестве баров, а также находит коррекцию к этому тренду. Если тренд достаточно сильный, а коррекция становится равной заданной в параметрах, то индикатор сигнализирует об этом. Можно устанавливать разные значения коррекции, лучше подходят значения 38, 50 и 62 (уровни Фибоначчи). Кроме этого, можно настраивать минимальную длину тренда, количество истории баров для поиска и другие параметры.
Параметры History - колич
FREE

Introducing the Super Pivot and Fibo Indicator: Your Ultimate Trading Companion Are you ready to take your trading to the next level? The Super Pivot and Fibo Indicator is here to revolutionize your trading strategy. This powerful tool combines key elements such as pivot points, Fibonacci retracement and extension levels, high-low values, and Camarilla points to provide you with a comprehensive and accurate analysis of the market. Key Features: Pivot Points: Our indicator calculates daily, weekl
FREE

A combined indicator of two famous indicators: RSI , Bollinger Bands Can be used in all currency pairs Can be used in all time frames with many signals Very simple and fast to use
Description:
This indicator is made from the combination of RSI and Bollinger Bands indicators
As you can see, it shows good signals and is worth using and testing
We hope you are satisfied with this indicator
Settings: show past show candle: Displays the number of candles that the indicator calculates.
For example
FREE
Spread Monitoring - это уникальный продукт для анализа спреда. В отличие от большинства подобных индикаторов, Spread Monitoring работает по тикам, а не по барам, что позволяет увидеть и зафиксировать аномальные расширения спреда. Особенности
Работает на тиках, а не на барах. Простая и легкая настройка индикатора. Работает на любых таймфреймах. Работает на любых финансовых инструментах. Не перерисовывается.
Параметры
Total - количество отображаемых тиков. clrSpread - цвет линии индикатора.
FREE

Detailed post explained:
https://www.mql5.com/en/blogs/post/759269
This is a slope indicator for Bollinger Bands indicator. It provides slopes for BB top band, center band (main) and Lower Band. You can also set a threshold value for Center line to control Red/Green slope histogram lines. Settings:
You can choose which line you need the slope and Threshold Alerts for in Drop down.
Slope Thresholds: for Alerts. Please note that Alerts only happen when Threshold is crossed. e.g.: If Threshold
FREE

The Ultimate Trading Companion: Beyond the Bands Tired of missing out on key market moves? Our indicator, Beyond the Bands , is the solution you've been waiting for. This powerful tool takes the classic Bollinger Bands strategy and supercharges it with an intelligent EMA filter, giving you more accurate and reliable signals than ever before. It's designed to help you find high-probability entry points and avoid false signals, so you can trade with confidence. What makes Beyond the Bands differen
FREE

Проверьте это, и если вам это нравится, просто наслаждайтесь этим. Попробуйте различные значения, чтобы найти параметр, который лучше всего подходит для вашей торговли. Восходящий сигнал, если индикатор окрашен зеленым газоном и медвежьим сигналом, если индикатор серый. Вы можете использовать сам линию для задней остановки при открытии ордеров. Это всего лишь инструмент. Дополнение. Это не стратегия. Объедините его с собственным анализом Просто скачайте его и попробуйте, это бесплатно.
FREE

Concept
Market arranges in Time upcoming Phases according to the present Results of its Interest. Directing Modulations are an Interaction of immanent Periods, which show in Reference to Time cyclic Activity and to Price leveling Activity. PointZero is a projecting Price Mask of this Concept of Time and Price and categorizing developed Price Movements related to their own Range: how far moved ? indicating their Status by marking special Events: when which Action ? setting the Situation in a fun
FREE

CCFp (Complex_Common_Frames percent) is a measure of currency strength.
Shows the total rate of change of “short-term moving average” and “long-term moving average” for each currency.
Supports eight major currencies: USD, EUR, JPY, CHF, GBP, AUD, CAD and NZD.
1). Displays the currency name at the right end of the graph.
2). You can change the display color of each currency.
3). Moving average smoothing type (ENUM_MA_METHOD) can be selected.
4). Price constant (ENUM_APPLIED_PRICE) can be c
FREE

Analyze volatility by clicking on a specific candlestick, which triggers the display of horizontal grid lines centered around the candlestick’s closing price, spaced by multiples of the calculated ATR. A vertical line highlights the selected candlestick, and an optional text label can display the ATR value in pips above the candlestick. The indicator is lightweight, using no buffers, and relies on chart objects for visualization. It includes error handling for invalid candlestick selections and
FREE

RJT SALAMANDER, the indicator as in a video game
VERSION 2
Pilot your PRICE spaceship inside the cavern and avoid the collision against the stalactites (green) and stalagmites (red), dodging these obstacles to win.
When these objects are forming (or disappearing) then you must make the decision how to move your ship (just like in a video game)
Depending on the market and the size of the candles/bars you can adjust the calculation of stalactites and stalagmites (based on the last bars) in the
FREE
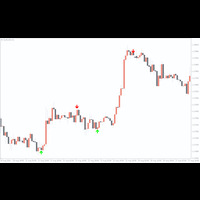
The indicator is a 15-minute signal indicator for all types of traders. Meaning, you could make lots of profits trading two different signals in one indicator.
NOTE: Both indicators are channels for achieving the same result. RED ARROW -- Sell Signal BLUE ARROW -- Buy Signal
Purchase now to be part of our community. We offer standard chart setups for both novice and intermediate traders. Trade with ease!
FREE

Super Channels indicator is a channel indicator created by calculating support and resistance levels. It calculates by taking the average of support and resistance levels. After determining the number of candles, it takes the levels of the number of candles and creates an autonomous channel according to these levels. If you want to calculate how many candles, you must enter the number in the parameter section. Also, there are two types of modes in the indicator. The first is to calculate based o
FREE

Supertrend Moving Average A combination of Supertrend and Moving Average to create a converging trade setup Input parameters: signal mode: set it to true if you want to plug it into STAT (Signal Tester and Trader) arrow shift: distance between fast EMA line to arrow on chart turn on price line filter turn on moving average signal for converging setup k period d period s period averaging method Moving average period Averaging method upper level limit (Stochastic) lower level limit (Stochastic)
FREE

Мы, в Stonehill Forex, публикуем наш первый индикатор собственной разработки, который был представлен на сайте Stonehill Forex в марте 25 года. Первоначальная версия была закодирована для MetaTrader 4 (MT4), а затем для MT5 и TradingView, на основе интересов сообщества. Этот индикатор предоставляется вам бесплатно и открывает нашу библиотеку.
Это двухлинейный перекрестный ценовой оверлей, который в своей основе использует две взвешенные скользящие средние линии, пропущенные через очень гладкий
FREE

ATR Moving Average draws a moving average of the standard Average True Range( ATR ) in the same window.
Settings Name Description ATR period
Set Price per iod for ATR calculation
ATR level Set ATR value for thresholding( only whole number, ignore leading zeros e.g. 0.00089 = 89 ) MA Period Set moving Average Period MA Method Set moving average method( Simple, Exponential, Smoothed and Linear Weighted ) MA Shift
Set moving average shift
Enable Alerts ? Generate Alert when ATR Crosses
FREE
Этот индикатор предназначен для удобного и быстрого создания скриншотов графиков в торговом терминале. Он значительно упрощает процесс сохранения графиков в определённую директорию, предоставляя удобный интерфейс с кнопкой на графике, которая активируется одним нажатием. Основные функции индикатора: Автоматическое создание скриншота графика при нажатии кнопки. Возможность выбора директории для сохранения скриншотов. Настраиваемый префикс для различения скриншотов, если на одном графике работают
FREE

Индикатор создан по материалам взятых из книги: Билл Вильямс. Торговый хаос. Экспертные методики максимизации прибыли. Показания индикатора в верху каждого бара рассчитываются по расположению цены открытия и закрытия относительно трети бара. Бар делиться на три части, нижняя треть бара это цифра три (3), средняя треть бара цифра два (2), верхняя часть трети бара цифра один (1). Первая цифра в показаниях индикатора - это расположение цены открытия относительно трети бара, вторая цифра - расположе
FREE

Necessary for traders: tools and indicators Waves automatically calculate indicators, channel trend trading Perfect trend-wave automatic calculation channel calculation , MT4 Perfect trend-wave automatic calculation channel calculation , MT5 Local Trading copying Easy And Fast Copy , MT4 Easy And Fast Copy , MT5 Local Trading copying For DEMO Easy And Fast Copy , MT4 DEMO Easy And Fast Copy , MT5 DEMO
The homeopathic indicator is also called the CCI indicator. The CCI indicator was proposed
FREE
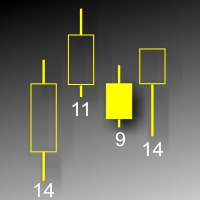
Данный индикатор показывает объем каждого бара (видимый диапазон) в пунктах. Возможна настройка параметров показа. Индикатор создавался для личного пользования, анализа графиков. Параметры: ColorL - цвет текстовых меток. Position - позиция метки: 0 - снизу, 1 - сверху. FontSize - размер шрифта. ANGLE - угол наклона текста.
FREE

Индикатор "INFO Spread Swaзp Info Panel" для MT4, вспомогательный инструмент для торговли.
- Индикатор показывает текущий спред и свопы валютной пары, к которой он прикреплен. Также идикатор показывает: 1. Дату и время сервера 2. Название сервера 3. Название влютной пары. 4. Спред 5. Своп 6. Открытые позиции 7. Отложенные ордера 8. Максимальная просадка после открытия индикатора 9. 30% от депозита. (можно менять) Можно менять положение, размер, цвет шрифта, расстояние между строками.
FREE

Intraday Setup Indicator uses Bollinger Bands as a main indicator to find a good setup filtered with candle stick pattern such as engulfing and pin bar. This is great tool for those who trade with Bollinger bands for entry or use it as a filter for trend. It is suggested to use a higher time frame when using this tool. There are many input setting for user to conveniently find a good probability setup.
FREE
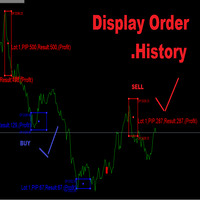
Display Order History Let Try trading.
Button Mark - Red : Order SELL - Blue : Order BUY
Button Lot - Ex. (Lot : 0.01)
Button Profit,Lost - Ex. (Profit:1,Lost:-1) Button PIP - Ex. (PIP:100) Button Open,Close - Ex. Open:3300,Close:3301 VLine M30,H1,H4,D1 IMport CSV Button All Button Summary M30,H1,H4,D1 Profit,Lost Number Order _____________ Start trading Display on chart ____________
FREE

RaysFX StepMA+Stoch Caratteristiche Principali Adattabilità: Il nostro indicatore RaysFX StepMA+Stoch è progettato per adattarsi alle mutevoli condizioni di mercato. Utilizza l’Average True Range (ATR) per misurare la volatilità del mercato e regolare di conseguenza le sue strategie di trading. Precisione: L’indicatore genera segnali di trading quando la linea minima incrocia la linea media. Questi segnali sono rappresentati come frecce sul grafico, fornendo punti di ingresso e di uscita chiari
FREE
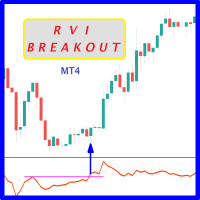
Probability emerges to record higher prices when RVi breaks out oscillator historical resistance level. It's strongly encouraged to confirm price breakout with oscillator breakout since they have comparable effects to price breaking support and resistance levels; surely, short trades will have the same perception. As advantage, a lot of times oscillator breakout precedes price breakout as early alert to upcoming event as illustrated by 6th screenshot. Furthermore; divergence is confirmed in case
FREE

Based on the trend-following principle of CCI, it has been improved to become an indicator that can identify the reversal of the trend and its development direction, that is, it can identify the top and bottom attenuation of the oscillating trend in the trend market. feature The red and green columns represent the trend of bullish or bearish development under the current cycle. The blue line shows the position and attenuation of the current price trend in the current cycle. The upper and lower r
FREE
Highly configurable Relative Vigor Index (RVI) indicator.
Features: Highly customizable alert functions (at levels, crosses, direction changes via email, push, sound, popup) Multi timeframe ability Color customization (at levels, crosses, direction changes) Linear interpolation and histogram mode options Works on strategy tester in multi timeframe mode (at weekend without ticks also) Adjustable Levels Parameters:
RVI Timeframe: You can set the lower/higher timeframes for RVI. RVI Bar Shift: yo
FREE
This multimeter is a smaller version of the full scanner here: https://www.mql5.com/en/market/product/123072
This multimeter is for people interested in TDI Line Crossings. And who only use a single currency symbol/pair with multiple timeframes. If you want multiple currencies, then please look into the scanner.
It is for showing Cross of various TDI elements: PriceLine, Trade Signal Line and Market Base Line And for getting alerts, so you can be prepared for finding good trade setups before t
FREE

Power Trend Free - индикатор, показывающий "силу" тренда на выбранном периоде.
Входные параметры Индикатор имеет три входных параметра: Period - положительное число больше единицы, показывающее, по какому количеству свечей строятся показания. Если ввести единицу или ноль, ошибки не будет, но отрисовываться индикатор не будет. Applied Price - стандартный набор "Применить к:", обозначающий, по каким данным будет рассчитываться индикатор: Close - по ценам закрытия; Open - по ценам открытия; High -
FREE

Мультивалютный, Мультитаймфреймовый индикатор, позволяющий увидеть тренд основанный на пересечении 2 EMA без дополнительных кликов, он ищет последнее пересечение на всех таймфреймах сразу и пишет в левом верхнем углу в какую сторону направлен тренд открытой валютной пары, а также как давно было последнее пересечение. На основе этого индикатора вы можете открывать ордера если все большинство трендов направлены в 1 сторону и выходить из сделок когда ситуация меняется. Индикатор не рисует на график
FREE
TMA_KC PRT is non-redrawn channel indicator and can be used to identify trend and support and resistance levels.
Indicator settings allow you to assign a specific coefficient to each price channel, which makes it possible to narrow or expand each channel separately. The TMA_KC PRT indicator is a multicurrency instrument, so the choice of a timeframe depends solely on the trader’s preference. TMA_KC PRT indicator can be used on any time frame, so you can easily make the indicator an i
FREE

Dynamic MA Trend Zone – Dynamic Moving Average Trend Zone
The Dynamic MA Trend Zone is a visually compelling indicator that dynamically tracks changes in market trends. By displaying moving averages on three different price levels (close, high, and low), it creates a color-coded trend zone that clearly indicates the trend’s direction and strength.
Features and Functions:
- Trend Direction Color Coding: The indicator automatically color-codes the trend zones based on whether the candle’s clos
FREE
Oscillators and Volatility: Oscillators like RSI and Stochastic are particularly useful in assessing the market sentiment and potential turning points in volatility. However, it's essential to use them in conjunction with other indicators and analyses for a comprehensive view. Divergences between price movements and oscillator readings can be powerful signals. For example, if a volatility index is making new highs, but the oscillator fails to confirm these highs, it may indicate weakening momen
FREE

Индикатор выводит первые производные двух MACD. По умолчанию, желтая MACD является более быстрой, чем синяя MACD. В настройках можно задать подходящие вам параметры для каждой из MACD. Одновременное изменение знака производных может являться дополнительным сигналом разворота. Входные параметры
Yellow MACD fast EMA period Yellow MACD slow EMA period Blue MACD fast EMA period Blue MACD slow EMA period
FREE

Wicks UpDown Target GJ
Wicks UpDown Target GJ is specialized in GJ forex pairs.
Choppy movement up and down on the opening range every day. Trading breakouts on London session and New York session is recommended.
Guideline Entry Strategy Idea:
Step 1 - Breakout Forming (Warning! Trade on London Session and New York Session) Step 2 - Breakout Starting (Take Action on your trading plan) Step 3 - Partial Close your order & set breakeven (no-risk) Step 4 - Target complete Step 5 - Don't trade
FREE

Индикатор отображает коэффициенты между экстремумами графика. Вы можете указать собственные коэффициенты (например, Фибоначчи).
Параметры Наиболее важные Density - чувствительность поиска коэффициентов экстремумов. Чем выше значение, тем ниже чувствительность, и наоборот. Базовая единица - 1 бар графика. History - глубина истории для поиска. При -1 индикатор ищет на всех барах истории. Базовая единица - 1 бар графика. Range - глубина поиска коэффициентов от экстремума. Базовая единица - 1 бар г
FREE
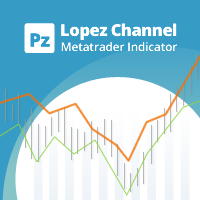
Мультитаймфреймовый индикатор Lopez Channel определяет тенденцию рынка при торговле внутри узкого ценового диапазона. Он очень прост в понимании Находит ситуации перекупленности и перепроданности Рисует на закрытии бара и не перерисовывает Расчетный таймфрейм настраивается Красная линия - цена перекупленности Зеленая линия - цена перепроданности Он имеет прямое участие в торговле. Ищите возможности покупки, когда рынок перепродан Ищите возможности продажи, когда рынок перекуплен
Расчет
Индикато
FREE

Multi Timeframe Indicator сочетает в себе множество функций и может считаться универсальным помощником трейдера в принятии решений. Основной его задачей является отображение вплоть до десяти индикаторов одновременно, используя всего один маленький квадрат на каждый индикатор. Среди индикаторов, доступных для отображения, - Awesome Oscillator, CCI, DeMarker, MACD, RSI, RVI, Stochastic, Percent Range Ларри Вильямса, Bulls Power и Bears Power. Важной функцией индикатора является возможность отслеж
FREE

Сканер показывает значения тренда на основе пересечения двух скользящих средних. Значения отображаются на нескольких символах (до 30) и 8 таймфреймах. Уведомляет о смене направления тренда в терминале MetaTrader 4, по email и push-уведомлением. Это бесплатная версия индикатора: https://www.mql5.com/ru/market/product/29159
Важная информация Для максимального использования потенциала сканера прочитайте полное описание (на английском языке): www.mql5.com/en/blogs/post/718074
Есть различные способ
FREE

For all those traders interested or currently trading Ichimoku, you will not want to miss this article. Although I am heading out in a few hours with my girlfriend to Harbin Hot Springs, I wanted to write a brief introduction to Ichimoku Number Theory as there has been a lot of questions (and confusion) about Ichimoku settings, time frames, etc. The basis of Ichimoku as known to most is the 5 lines; Tenkan Line Kijun Line Senkou Span A (part of the Kumo) Senkou Span B (other part of the Kum
FREE

Velvet RVI is intended for use with the Velvet advanced ordering layer. It is based on the algorithm for the Relative Vigor Index, provided by Investopedia here . All of the data it displays is accurate and verified against the internal API function iRVI, when it is detected by the ordering layer. In order to place orders with the Velvet RVI indicator, the ordering layer must be installed and running. Ordering from the Velvet RVI indicator requires that "Velvet Ordering Layer" ( found here ),
FREE
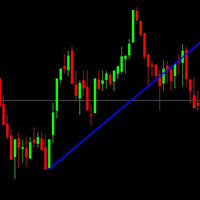
This is just a simple indicator that show Alert when the Current candle Close Below the Trendline. Previous candle do not affect the Alert.
The indicator is tied to the Trendline so if the Trendline is accidentally deleted, the Alert will not work. The indicator will draw another Trendline if the current Trendline is deleted.
Removing the indicator will removed the Trendline.
There are 4 type of Alert to set: Popup Alert, Signal Alert, Push Notification, Comment.
FREE

IceFX TickInfo - это уникальный индикатор для тиковых графиков для платформы MetaTrader 4. Индикатор графически отображает последние 100 тиков, а также дополнительно показывает текущий спред, цены bid/ask и значение времени на элегантной панели IceFX. Индикатор является эффективным инструментом для трейдеров, торгующих на таймфрейме M5 или даже M1.
Параметры индикатора: Corner - угол привязки панели; CornerXOffset - отступ от угла по горизонтали; CornerYOffset - отступ от угла по вертикали; Cha
FREE
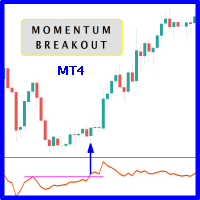
When prices breakout resistance levels are combined with momentum oscillator breaks out its historical resistance levels then probability emerges to record farther prices. It's strongly encouraged to confirm price breakout with oscillator breakout since they have comparable effects to price breaking support and resistance levels; surely, short trades will have the same perception. Concept is based on find swing levels which based on number of bars by each side to confirm peak or trough and in tu
FREE

Introduction and Description
The indicator displays an arrow whenever a " Bearish Engulfing " is detected. The latter usually indicates the beginning of a downward trend. A bearish engulfing pattern is a technical chart pattern that signals lower prices to come. The pattern consists of an up candlestick followed by a large down candlestick that eclipses or "engulfs" the smaller up candle. The pattern can be important because it shows sellers have overtaken the buyers and are pushing the price mo
FREE

Trendfinder SMA With Zone and Alert are Colored candlesticks showing the trend based on two SMA as Signal and two SMA as a Buy and Sell Zone and the slope of the slow moving average. This indicator will give you the color change on the next bar on the confirmation candle and will provide alert on Buy and sell signal, when it enters the buy and sell zone and when the market test the buy or sell zones as support or resistance and will never repaint . This indicator has the following: 2 SMA for th
FREE

Индикатор запаса хода, означает среднестатистическое дневное движение цены. Для удобства визуально отображается на графиках, но с таймфреймом H4 и ниже. Индикатор перерисовывается ежедневно и учитывает гэпы. Дополнительная пунктирная линия означает 80% пройденного дневного движения. Важный инструмент в арсенале профессионального трейдера или того, кто хочет им стать. PrimeTools - это серия продуктов предназначенных для правильной и профессиональной торговли. [ PrimeTools Levels | PrimeTools Rang
FREE
Индикатор Free Pro Level предназначен для автоматического построения уровней поддержки и сопротивления. Преимущества индикатора: подходит как для опытных трейдеров, так и для новичков; простота в использовании; уровни не перерисовываются; вероятность реакции цены при касании уровня более 80%; бесплатный. Индикатор Free Pro Level имеет всего 5 пунктов входных параметров: Минимальная длина свечи в пунктах по 5 знаку - основной параметр, на основании которого происходит анализ и поиск уровней по
FREE

Индикатор Прорыва по Силе Валют (Currency Strength Breakout Indicator)
Получите преимущество в торговле с Индикатором Прорыва по Силе Валют , мощным инструментом, который анализирует восемь валют на нескольких таймфреймах (M1, M5, M15, M30 и H1) — всё в одном, легко читаемом окне. Определяйте самые сильные и слабые валюты и торгуйте откаты с точностью, используя уведомления, которые помогут войти в тренд в нужное время. Основные характеристики Мониторинг Силы Валют в Реальном Времени : Мгновенн
FREE

ATR Pyramid ️: Ваш билет к прибылям, растущим выше, чем башня Дженга на стероидах , превращающий волатильность рынка в сёрфинг по трендам ️ и вечеринку с добавлением позиций , где только первая сделка рискует обвалом , в то время как вы защищаете остальные, поднимая стоп-лосс, как на лифте , создавая зону комфорта – единственный реальный путь к умножению вашего форекс-счета быстрее, чем кролик на эспрессо!!! Внимание всем накопителям прибыли и сёрферам трендов! ️ Этот
FREE

Целью этой новой версии стандартного MT4 индикатора, входящего в поставку платформы, является отображение в подокне нескольких таймфреймах одного и того же индикатора. См. пример, приведенный на рисунке ниже. Однако индикатор отражается не как простой индикатор MTF. Это реальное отображение индикатора на его таймфрейме. Доступные настройки в индикаторе FFx: Выбор таймфрейма для отображения (от M1 до MN) Установка ширины (количество баров) для каждого окна таймфрейма Всплывающее оповещение/звуков
FREE

Сигнальный индикатор, состоящий из нескольких широко известных индикаторов, обрабатывающих данные последовательно. 2 варианта - для графика и подвальный. В настройках возможно включить оповещения о смене тренда (алерты) звуковые, на e-mail и push. Есть возможность менять цвета и толщину линий, цвета и коды стрелок, количество расчетных баров и отдельно настраивать параметры входящих в состав индикаторов.
FREE

Этот индикатор превратит цвета ваших свечей в цветные, ориентированные на тренд, показывая 4 разных цвета на основе двух скользящих средних и наклона медленной скользящей средней. очень мощный индикатор для всех периодов времени, показывающий направление тренда для подтверждения ваших сделок.
Зеленый: бычий
Темно-зеленый: бычий слабый
Светло-красный: Медвежий Слабый
Красный: медвежий
Для получения дополнительной информации:
https://linktr.ee/trader_1st
FREE

Indicator overview Trend indicator usage Moving averages. Highest quality alerts that need no introduction. It is completely loyal to the original algorithm and uses other useful features.
Easy to trade Carry out all kinds of notifications It's not a new paint and it's not a back paint. Setting Indicator SSMA50 in Time frame H1 for any pair currency and Gold Spot. EMA200 in Time frame H1 for any pair currency and more than EMA250 for Gold spot. Using it for maximum benefit Set up notificatio
FREE

This indicator scans the Moving Average values for 2 Moving Averages on multiple pairs and multiple timeframes in realtime and displays a Buy signal when the fast MA is above the slow MA and a Sell signal when the fast MA is below the slow MA.
-All the MA parameters(Period, Method and Applied price) can be changed from the inputs window.
-You can either add your own list of pairs to scan or set the scanner to automatically use the pairs in the market watch using the Symbols Source input.
-T
FREE
As the suggested, with this indicator you are able to switch from one symbol or timeframe to another in the same single chart. So forget about opening tons of chart on your screen! It's not designed for ICT or SMC trader, but if you are that kind of trader you still can use it. Imagine you have a strategy containing various indicators and settings, on a single chart you can screen the entry opportunity then move to the next symbol or timeframe.
FREE
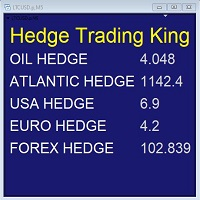
Hedge Trading Monitor e' il mio indicatore che monitora a colpo d'occhio la differenza o il ratio tra due asset utili per fare Hedge trading.
Come si utilizza + scaricare l'indicatore + applicare l'indicatore su un grafico aperto + si possono cambiare gli asset agendo nelle impostazioni.
Distribuzione + e' distribuito solo su MQL5.vom + licenza gratuita (FREE)
FREE
Канальный гибрид индикаторов Moving Average, Bollinger Bands, RSI и CCI. Уникальная фильтрация сигналов без перерисовки индикатора дает возможность совершать разнообразные сделки - как среднесрочные, так и краткосрочные. Принцип работы индикатора состоит в поиске разворотных моделей рынка. В методе определения разворота используется канальная триангулярная скользящая средняя (Triangular Moving Average), которая строит равноудаленные не перерисовывающиеся каналы с периодом отклонения (Deviation),

Индикатор выводит на график размер спреда по текущему инструменту. Очень гибок в настройках. Есть возможность задать максимальное значение спреда, по превышении которого, сменится цвет надписи спреда, и прозвучит сигнал (если включено в настройках). Индикатор будет очень удобен людям, которые торгуют на новостях. Вы никогда не войдете в сделку с большим спредом, так как индикатор вас об этом уведомит как визуально так и звуком. Входные параметры: AlerT - true - включен звуковой сигнал при превыш
FREE
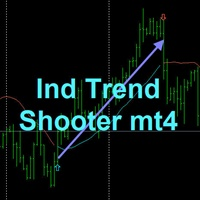
TREND SHOOTER Without alerts
It is a trend indicator based on moving averages that very efficiently calculates changes in market direction.
This has the ability to anticipate changes of direction very early.
FEATURES
This indicator particularly draws two moving averages that are used only to show color changes. they can wear these moving stockings as they wish as they do not affect the color change behavior bullish blue color
bearish red color where the line is interrupted it is not reco
FREE

Этот индикатор был модифицирован согласно 'Пути черепахи'. Индикатор ATR можно использовать в качестве опорной точки для установки стоп-лосса или тейк-профита, а также для подтверждения дневного ценового диапазона (также применимо к другим периодам).
Расчет Значение истинного диапазона рассчитывается следующим образом: TR = MAX(H-L, H-PDC, PDC-L) Где: H = максимальная цена текущего бара L = минимальная цена текущего бара PDC = цена закрытия предыдущего бара Средний истинный диапазон в "Пути чер
FREE
Highly configurable RSI indicator. Features: Highly customizable alert functions (at levels, crosses, direction changes via email, push, sound, popup) Multi timeframe ability Color customization (at levels, crosses, direction changes) Linear interpolation and histogram mode options Works on strategy tester in multi timeframe mode (at weekend without ticks also) Adjustable Levels Parameters:
RSI Timeframe: You can set the current or a higher timeframes for RSI. RSI Bar Shift: you can set t
FREE
MetaTrader Маркет - лучшее место для продажи торговых роботов и технических индикаторов.
Вам необходимо только написать востребованную программу для платформы MetaTrader, красиво оформить и добавить хорошее описание. Мы поможем вам опубликовать продукт в сервисе Маркет, где его могут купить миллионы пользователей MetaTrader. Так что занимайтесь только непосредственно своим делом - пишите программы для автотрейдинга.
Вы упускаете торговые возможности:
- Бесплатные приложения для трейдинга
- 8 000+ сигналов для копирования
- Экономические новости для анализа финансовых рынков
Регистрация
Вход
Если у вас нет учетной записи, зарегистрируйтесь
Для авторизации и пользования сайтом MQL5.com необходимо разрешить использование файлов Сookie.
Пожалуйста, включите в вашем браузере данную настройку, иначе вы не сможете авторизоваться.