
MACRO SNAPSHOT
Gold trades at $4,437 after a sharp 5.3% pullback from the $4,690 peak, navigating heightened volatility amid shifting Fed expectations. The DXY holds near 99.3, maintaining moderate pressure on dollar-denominated metals. Markets price in a 68% probability of a 25bp cut at the September FOMC meeting (CME FedWatch), down from earlier dovish bets following mixed inflation data. Core PCE came in at 2.6% YoY, slightly above expectations, complicating the Fed's path. Geopolitical tensions persist in the Middle East with ongoing concerns about Red Sea shipping routes, providing underlying safe-haven support. US 10Y yields stabilize at 4.18%, while real rates (TIPS) hover near 1.85%, creating a moderately challenging environment for non-yielding assets. Central bank demand remains robust, with PBoC and emerging market banks continuing accumulation. WTI crude trades at $84.15/barrel, supporting inflation-hedge narratives. Key event this week: Friday's NFP release, consensus at +165K jobs.
KEY LEVELS
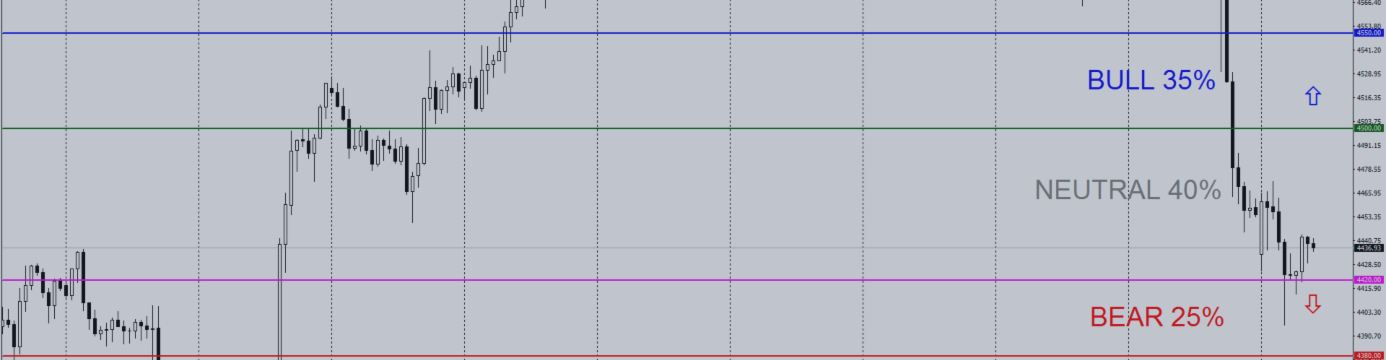
Support: 4420 | 4380 | 4350
Resistance: 4500 | 4550 | 4620
Decision rule: A confirmed H1 close below 4420 opens path to 4380, while reclaiming 4500 with momentum suggests consolidation rather than structural breakdown.

PROBABILISTIC SCENARIOS
BULL (35%): If price reclaims and holds above 4500 with two consecutive H1 closes, potential recovery toward 4550, with extension to 4620 if momentum sustains. This scenario requires bullish displacement candles and failure to make new lows.
NEUTRAL (40%): If price oscillates between 4420 and 4500, expect range-bound consolidation as market digests the recent 250-point decline. Midpoint around 4460 acts as equilibrium while awaiting NFP catalyst.
BEAR (25%): If price breaks and sustains below 4420 with confirmed H1 close, potential extension to 4380, with deeper corrective move toward 4350 if selling pressure intensifies. This requires follow-through selling and failure to reclaim 4450.
PRICE ACTION & MARKET STRUCTURE
From a structural perspective, the H1 chart exhibits a clear market structure shift following the liquidity sweep at 4690. The recent displacement candles to the downside indicate strong sell-side momentum, breaking the previous higher-low structure. Price now trades in a premium array relative to the dealing range established between 4350-4500. The swift decline from 4690 to 4437 represents a 253-point move with minimal mitigation, suggesting aggressive distribution. We're observing potential demand zone formation around 4420-4380, where previous order blocks may provide support. However, until price mitigates the 4500 supply block with conviction, the bearish structure remains intact. Watch for equilibrium retest around 4460 as a potential mitigation level for short-term bears.
⚠️ DISCLAIMER: This content is strictly for educational and informational purposes only. It does not constitute financial advice, investment advice, trading signals, or a recommendation to buy or sell any instrument. Past performance does not guarantee future results. Always conduct your own research and consult a licensed financial advisor before making any investment decision.
💬 With NFP on Friday and gold down 5% from highs, where do you see the bigger opportunity — buying the dip toward 4380 or fading rallies into 4500? I'd genuinely love to hear your perspective. Drop your take below.