
📊 MACRO SNAPSHOT
Gold consolidates near $4,605 after testing the $4,700 zone, still up double digits year-to-date. The Fed holds at 3.50–3.75%, with CME FedWatch assigning roughly a 59% probability of a hold at the September 16 FOMC, capping rate-cut tailwinds. DXY drifts near 99.1 and remains soft on the month within its 95.5–101.8 yearly band, a supportive backdrop for the metal. The 10-year yield near 4.66% keeps real yields elevated, limiting upside momentum. WTI around $82 sustains inflation-hedging demand amid persistent geopolitical risk premiums across key trade corridors. Central banks stay structural buyers — 289t in Q2 per the World Gold Council, Poland and China leading. Key event on the horizon: FOMC, September 16.
🔑 KEY LEVELS
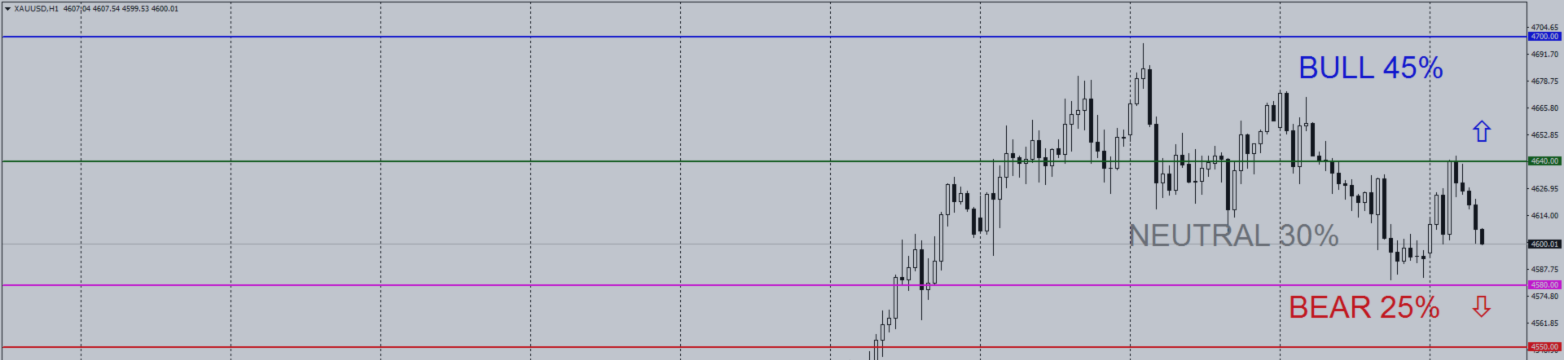
Support: 4580 | 4550 | 4500
Resistance: 4640 | 4675 | 4700
Decision rule: two consecutive H1 closes outside the 4580–4640 range activate the corresponding directional scenario; inside it, treat price as two-sided, with average session ranges near $80 arguing against chasing extremes.

⚡ PROBABILISTIC SCENARIOS
BULL (45%): If price reclaims and holds above 4640, potentially targeting 4675, with a stretch objective at the 4700 buy-side liquidity pocket, implying continuation of the higher-timeframe bullish sequence. Confirmation: two consecutive H1 closes above 4640.
NEUTRAL (30%): If price oscillates between 4580 and 4640, a range-bound consolidation is likely, with equilibrium near 4610 acting as a two-sided pivot.
BEAR (25%): If price breaks and sustains below 4580, potentially targeting 4550, then the 4500 demand zone on a deeper correction. Confirmation: a confirmed H1 close below 4580.
Probabilities derived from weighted historical-analogue matching on the H1 archive (multi-horizon returns, volatility, structure). All levels are observation zones, not execution points.
📐 PRICE ACTION & MARKET STRUCTURE
From a structural perspective, the H1 chart displays a mature bullish sequence: displacement legs off the Aug 18 demand zone near 4330 lifted price into premium arrays, culminating in a buy-side liquidity pocket above 4690. The ensuing decline swept sell-side liquidity at 4580 and is now mitigating an order block near 4600–4610, around equilibrium of the 4580–4640 dealing range. Lower highs signal caution, yet while discount-zone demand holds, higher-timeframe structure stays constructive; a confirmed break of 4580 would mark a market structure shift toward deeper supply. Session ranges near $80 keep two-sided risk elevated.
⚠️ DISCLAIMER: This content is strictly for educational and informational purposes only. It does not constitute financial advice, investment advice, trading signals, or a recommendation to buy or sell any instrument. Past performance does not guarantee future results. Always conduct your own research and consult a licensed financial advisor before making any investment decision.
💬 Breakout above 4640 or a fade back to 4580 — where are you watching gold this session? I'd genuinely love to hear your take. Drop it below.