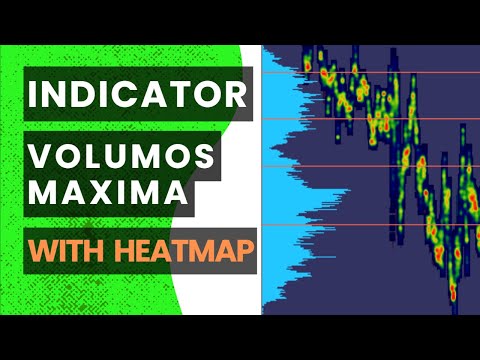
Heatmap Volume Profile

3.5

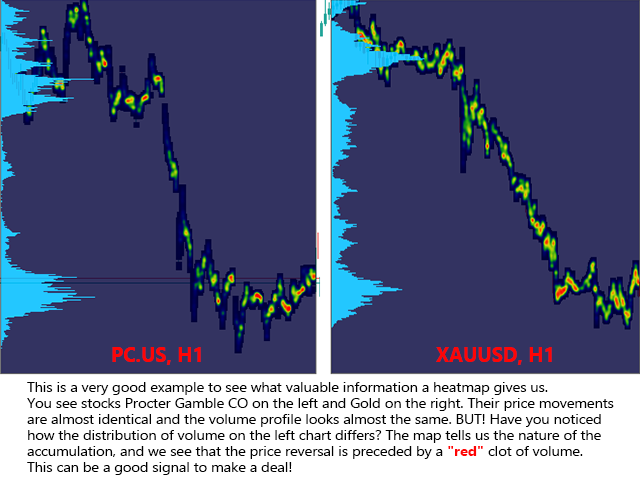
A Heatmap with a Volume Profile is like a thermal imager or x-ray machine. It will help you to estimate the relative distribution of volume during the price movement and to understand  the relationship between volume and price. Indicator Volume Profile "Volumos Maxima" is a powerful tool for analyzing this relationship.

After simple experimentation with heatmap, you can find that each trading instrument has its own “characteristic” way of distributing volume. And this will help you to make a better analysis in making trading decisions.

Also, the indicator has the ability to display the Fibonacci grid. This will help to assess the harmony of the price movement. Fibanacci lines are automatically drawn relative to the "high" and "low" of the price range. This feature is implemented primarily to measure the corrective movement.

For more details please visit [our blog]

We plan to improve our indicator. We want to make it work more stable and faster.

Help us make it better - if you find a bug or have suggestions - PLEASE contact us. We will be very happy!

Benefits of the indicator

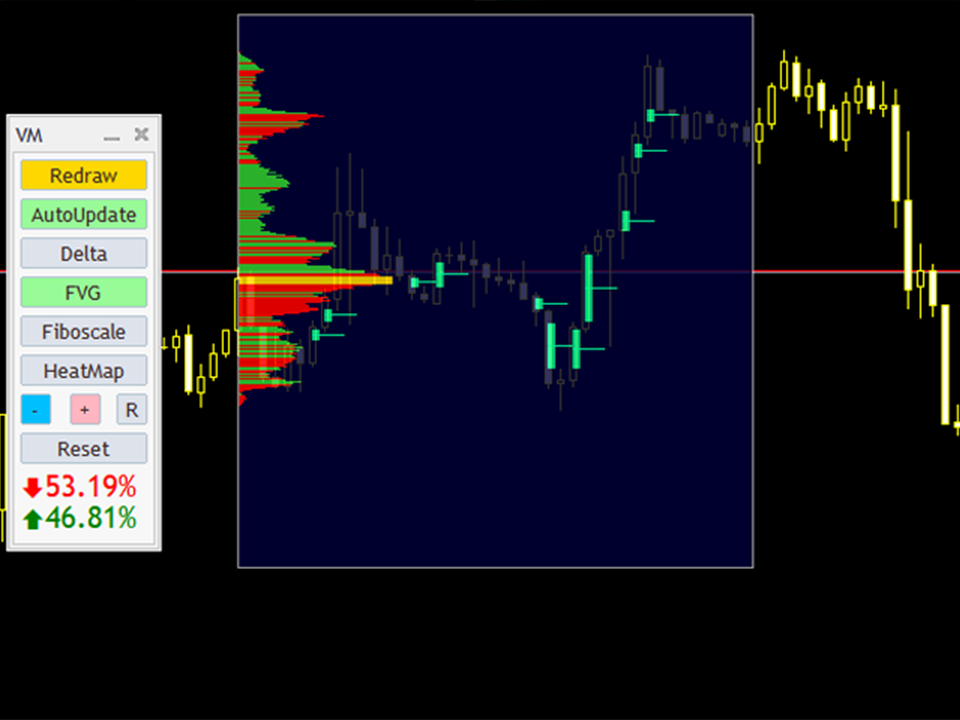
  • Building a histogram of horizontal volume with POC - point of control.
  • Building a delta colored profile. It helps to see the dominance of bulls or bears at some levels.
  • Display of "heatmap" of volume distribution.
  • Dynamic Fibonacci grid, which allows you to quickly identify potential price movement targets. Especially if the Fibonacci lines coincide with the "red spots" on the heat map.
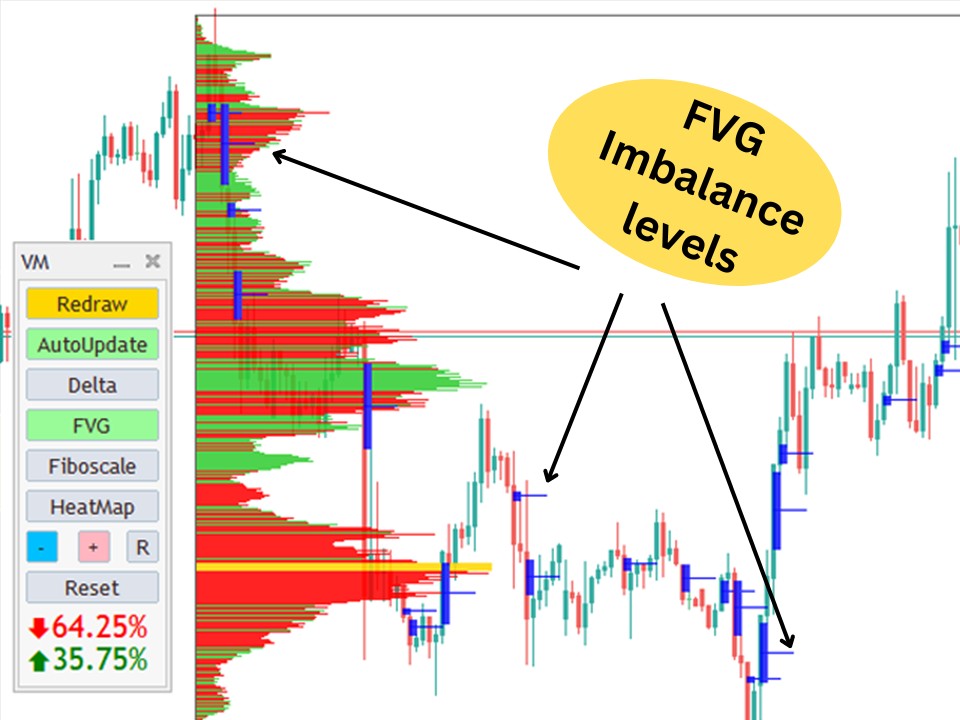
  • Display FVG - fair value gap. In other words - imbalance.
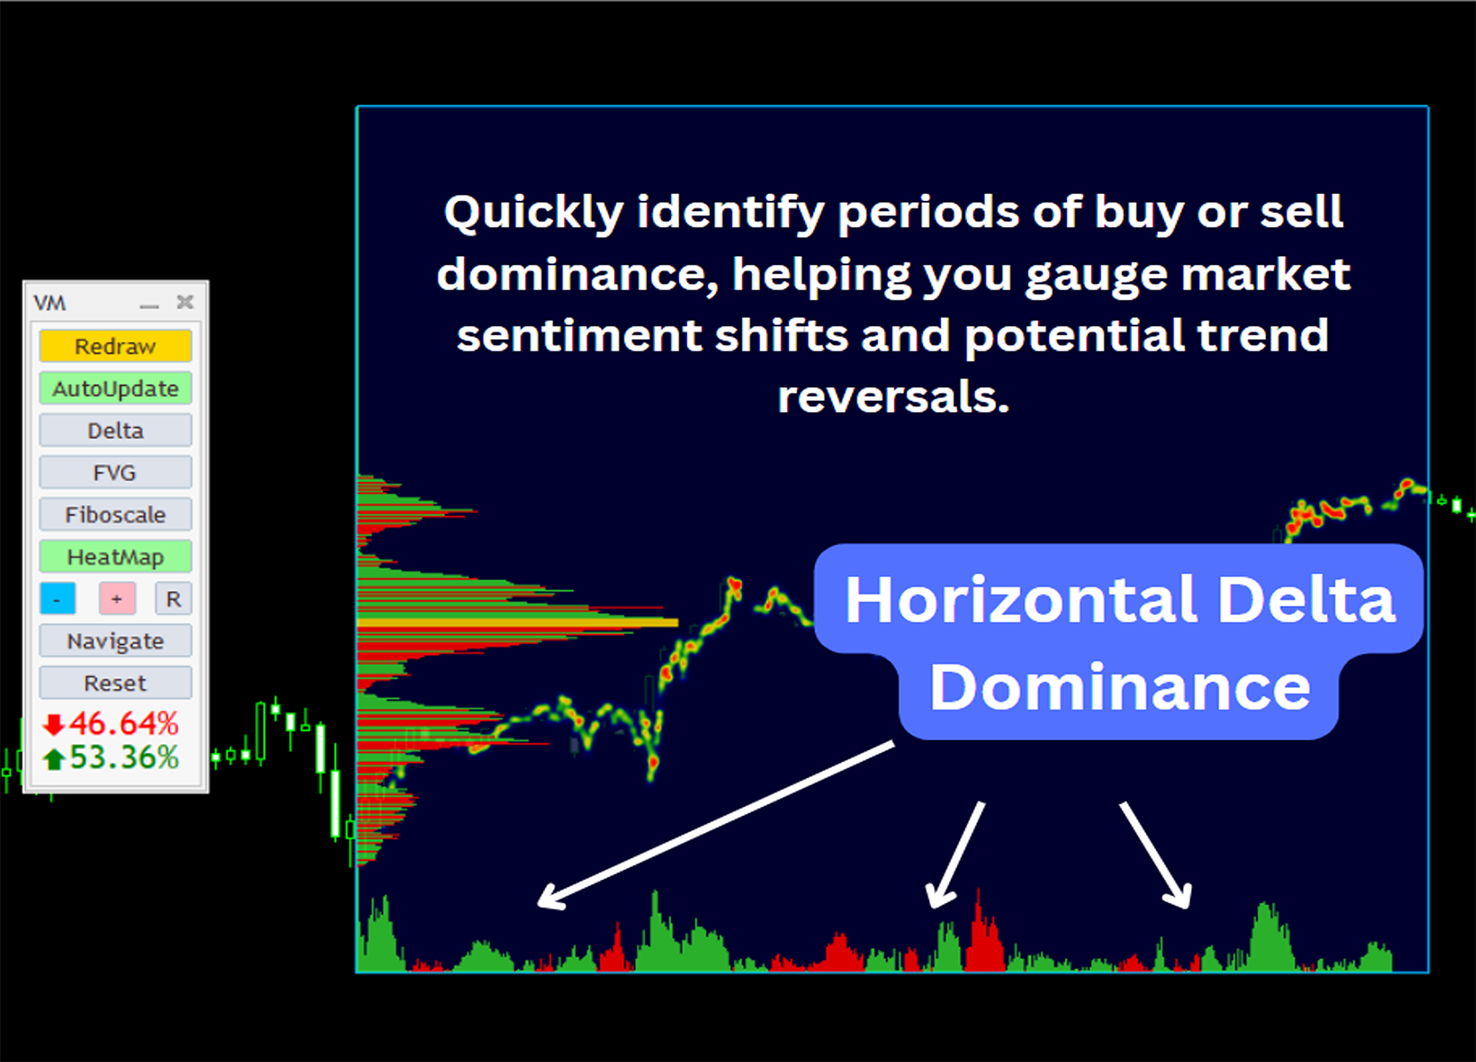
  • Percentage market dominance. The indicator calculates and shows the percentage dominance of buyers and sellers. A significant difference in values may indicate a change in trend.
  • Dominance of the horizontal delta. Quickly identify periods of buy or sell dominance, helping you gauge market sentiment shifts and potential trend reversals.
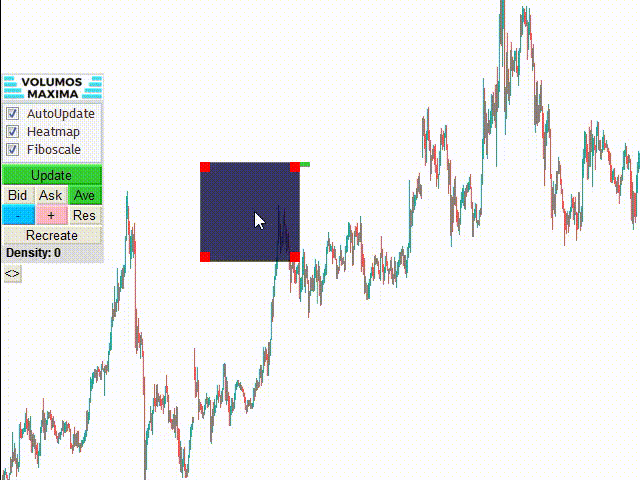
Panel

The panel allows you to do the following things:

  • Use the "AutoUpdate" button to activate automatic profile recalculation. A very important option. If it is selected, then the indicator will start recalculation every time you drag it, or change the scale of the chart. On timeframes up to 4 hours, these updates are not critical and take up to 1 second. But on larger timeframes, these delays can be noticeable and uncomfortable. Therefore, you can simply disable auto-update. And start the recalculation manually with the "Redraw" button.
  • Button "Redraw" for manual recalculation.
  • Button to switch between Simple Profile/Delta Profile.
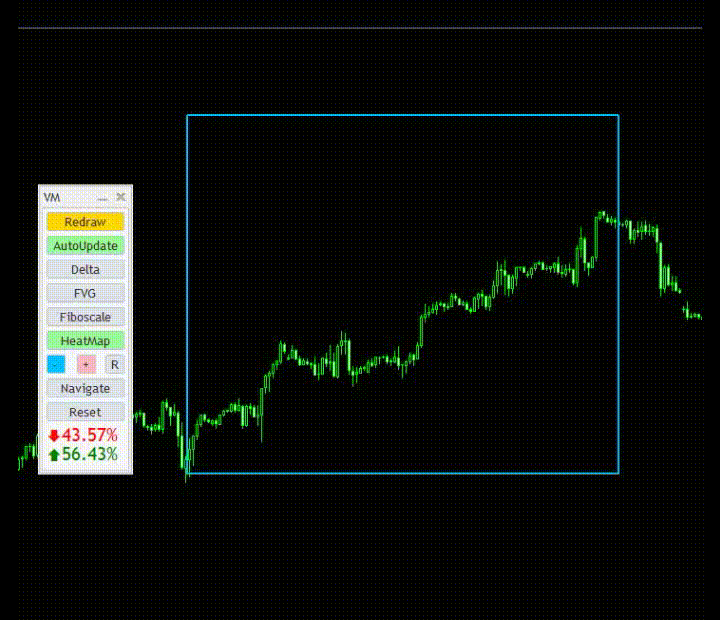
  • Buttons "Heatmap" and "Fiboscale"  allows you to show/hide the Heatmap and Fibonacci retracement accordingly. After cheking click "Redraw" button!
  • Button to show "FVG" (fair value gap or imbalance).
  • Buttons "+", "-" and "R". These are the buttons to increase/decrease and reset the gradient value for the heatmap. A useful thing when you need to display volumes peaks more expressively.
  • Button "Navigate". When you have lost the indicator somewhere - just click and the chart will move to a rectangle.
  • Button "Reset". It allows you to recreate the "rectangle" of the indicator again. This feature is useful if you lose the indicator while scrolling. Then you can just recreate it again.
  • The bottom area of the panel. Percentage market dominance.

Input  settings

The indicator has settings that relate to its design and display. You can change as you like. At the moment, it is possible to choose a light and dark style.

  • Color mode
  • Background color
  • Background transparency, in %
  • Spawn X and Y
  • Spawn width and heigth
  • Profile width, in %
  • Profile color
  • POC color
  • FVG color
  • Color of 0% and 100%  Fibos lines
  • Color Fibos lines
  • TextScaleColor for 0%-100% fiborange
  • TextScaleColor for rest of range

IMPORTANT SETTINGS:

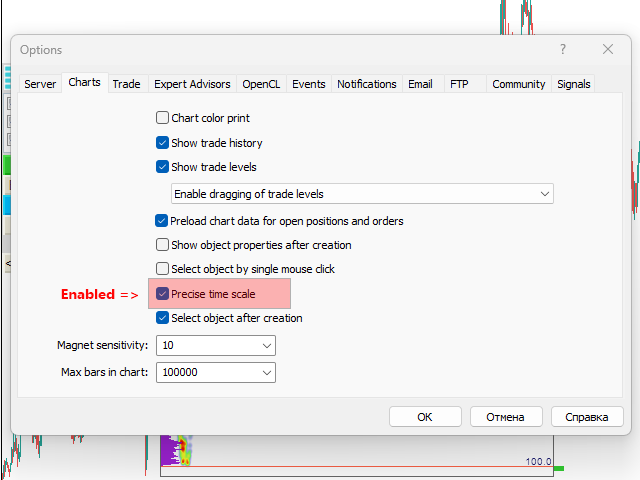
For the correct display of the "drawing window" of indicator, terminal must have "Precise time scale" option enabled. To do this, open the settings: Tools -> Options -> Charts -> Precise time scale  (should be active). Or you can use Ctrl+O.


TECHNICAL LIMITATIONS:

  • The work of the indicator is related to the processing of a large amount of data. Namely, information about the volumes. Therefore, the indicator needs time to download data (tick history) from your broker's server and to complete the calculations. It usually takes 1-3 seconds (with ping ~40ms).
  • The indicator’s range window will update the data only when it is completely on the visible part of the chart.
  • At the moment, we have implemented only the processing of tick volumes. And in the next updates we will add the ability to work with real volumes.
  • In this version of the indicator, it is possible to work with only one “range window”. We are considering adding more of these “windows” in future updates. We do not recommend more than one instance of the indicator per chart!


What to do if the indicator does not show anything?

This can happen when the indicator is first launched on a trading chart. Perhaps the indicator has not yet downloaded the required data from the broker. Wait a couple of seconds and click the "Redraw" button on the panel. And it should work.

Also, the indicator may not display anything, or display partially if there is simply no data for calculation. This can happen if you use the indicator on a deep history. This means that your broker's server does not save tick information for this time range.


Comentários 4
Rafael Alfredo Capucho
358
Rafael Alfredo Capucho 2023.08.15 16:02 
 

Hi, it is a veeeery promising Indicator, but there are minor things that I'd suggest as enhancements, the thing that bothers me more is that there is no way to "hide" the rectangle, unless you completely remove the indicator from the Chart, I would like to see a (button?) that enables me to toggle them without having to attach/detach from the chart, Secondly, the support for multi-rectangles would be amazing (even required, I would say). Thank you, even with the pending enhancements, it is going to be probably the best volume profile indicator soon.

Produtos recomendados
Descubra o poder da análise de volume com o nosso indicador de perfil de volume para Metatrader!   /   Versão MT4 O Perfil de Volume Básico é um indicador especificamente concebido para negociadores manuais que procuram otimizar a sua negociação. O indicador de perfil de volume é uma ferramenta essencial para qualquer operador sério que pretenda compreender melhor o comportamento do mercado. Com a nossa solução inovadora, pode visualizar de forma clara e concisa como o volume de transacções es
Forex Volume MT5
KEENBASE SOFTWARE SOLUTIONS
KT Forex Volume exibe o volume de compra e venda de um par de moedas na forma de um histograma colorido. O volume é composto por transações de compra e venda de um ativo. No mercado Forex: Se o volume de compra for maior que o de venda, o preço do par de moedas tende a subir. Se o volume de venda for maior que o de compra, o preço do par de moedas tende a cair. Recursos Evite operações ruins confirmando-as com dados de volume por tick. Ajuda você a operar na direção dos grandes players do merca
Efficient Market Profile Professional Market Profile analysis directly on your MetaTrader 5 charts. Efficient Market Profile allows traders to visualize market structure, fair value zones, and institutional price levels using the powerful Market Profile methodology . The indicator automatically builds TPO-based profiles for each trading session , helping you quickly identify where the market spent the most time and where important price levels are forming. All elements adjust dynamically to your
BoxChart MT5
Evgeny Shevtsov
5 (7)
The market is unfair if only because 10% of participants manage 90% of funds. An ordinary trader has slim changes to stand against these "vultures". This problem can be solved. You just need to be among these 10%, learn to predict their intentions and move with them. Volume is the only preemptive factor that faultlessly works on any timeframe and symbol. First, the volume appears and is accumulated, and only then the price moves. The price moves from one volume to another. Areas of volume accumu
Versão MT4: https://www.mql5.com/en/market/product/166784 Versão MT5: https://www.mql5.com/en/market/product/166785 PERFIL DE LIQUIDEZ O PERFIL DE LIQUIDEZ é uma ferramenta visual de estrutura de mercado que mapeia as zonas de liquidez potenciais no gráfico utilizando um perfil dinâmico em formato de mapa de calor. Este indicador analisa a ação histórica do preço e o volume de ticks, destacando as áreas de preço onde a liquidez está provavelmente concentrada. Ele desenha: Linhas de liquidez
O indicador cria cotações atuais, que podem ser comparadas com as históricas e, com base nisso, fazer uma previsão do movimento dos preços. O indicador possui um campo de texto para navegação rápida até a data desejada. Opções: Símbolo - seleção do símbolo que o indicador exibirá; SymbolPeriod - seleção do período do qual o indicador coletará dados; IndicatorColor - cor do indicador; HorisontalShift - deslocamento das cotações desenhadas pelo indicador pelo número especificado de barras; I
CVD SmoothFlow Pro
Thalles Nascimento De Carvalho
CVD SmoothFlow Pro - Análise de Volume Ilimitada para Qualquer Ativo! O CVD SmoothFlow Pro é a solução definitiva para traders que buscam uma análise de volume precisa e ilimitada. Utilizando o cálculo de Cumulative Volume Delta (CVD) com filtragem avançada de ruídos, a Versão Pro oferece a flexibilidade e precisão necessárias para operar em qualquer ativo financeiro. O que o CVD SmoothFlow Pro oferece? Análise Clara : Filtra ruídos e destaca movimentos de volume significativos em qualquer
This Volume Delta Profile is an advanced MetaTrader 5 indicator that visualizes   volume delta (order flow imbalance)   using a volume profile-style histogram. It shows the difference between buying and selling pressure at specific price levels, helping traders identify supply and demand zones. This indicator provides a unique perspective on market dynamics by visualizing the imbalance between buying and selling pressure, offering insights beyond traditional volume analysis. Core Concept Positiv
Volume Profile Delta
Juan Eduardo Verdala
Stop guessing based on price alone. Visualize true institutional intent by measuring buying and selling pressure in real time. Here’s what you get with Volume Profile Delta: Per-Candle Volume Confirmation: Instantly analyze the volume Delta (Buy vs. Sell) on every single candle to validate trends. Identify Exhaustion and Strength: Detect when a trend is losing steam or when buying/selling power is building up for an imminent move. Clear Visual Signals: An intuitive lower histogram chart for q
FREE
Volume Profile Density V2.40 Mostra a distribuição do volume por nível de preço, revelando áreas de interesse institucional. Diferente do volume clássico (por tempo), mostra onde o volume realmente se concentrou. Conceitos principais: Barras horizontais = volume negociado em cada preço Barra mais longa → maior volume Zonas vermelhas = suportes e resistências fortes Principais usos: Identificar suportes e resistências reais Determinar o POC (Ponto de Controle) Definir a Área de Valor (70 % do vol
FREE
Market Profile Heat indicator  — is a classic Market Profile implementation that can show the price density over time, outlining the most important price levels, value area, and control value of a given trading session. This indicator can be attached to timeframes between M1 and D1 and will show the Market Profile for daily, weekly, monthly, or even intraday sessions. Lower timeframes offer higher precision. Higher timeframes are recommended for better visibility. It is also possible to use a fr
VP hidden
Emr Aljnaby
4.33 (12)
The indicator works to convert normal volume into levels and determine financial liquidity control points. It is very similar in function to Fixed Volume Profile. But it is considered more accurate and easier to use than the one found on Trading View because it calculates the full trading volumes in each candle and in all the brokers present in MetaTrade, unlike what is found in Trading View, as it only measures the broker’s displayed prices. To follow us on social media platforms: telegram
FREE
UPD1 Profile Levels MT5
Vitaliy Kuznetsov
5 (4)
O indicador localiza os níveis de volume máximo e mínimo de preços (perfil do mercado) no histograma de trabalho para o número especificado de barras.   Perfil composto. A altura do histograma é totalmente automática e se adapta a qualquer instrumento e período de tempo. O algoritmo do autor é usado e não repete análogos conhecidos. A altura dos dois histogramas é aproximadamente igual à altura média da vela. Um alerta inteligente irá ajudá-lo a informar sobre o preço relativo ao nível de volume
Dynamic Trend Sniper MT5
Vincent Georges David Ferrier
Trade Like an Institution. Protect Like a Professional. Early Sniper Access: Limited Launch Offer! Get ready to elevate your trading precision. We are offering an exclusive, highly limited launch price for the first Dynamic Trend Sniper users. Our Unbeatable Launch Offer: First 10 Snipers Only: $69 (Full lifetime access + all v1.x updates) Standard Retail Price (After 10 Purchases): $129 Why Act Now? This is not just a discount; it's a strategic entry point. We are committed to rewarding
MA Distance Histogram
Pablo Filipe Soares De Almeida
MA Distance Histogram O MA Distance Histogram é um indicador que mostra, em forma de histograma, a distância entre o preço de fechamento (Close) e uma Média Móvel (Moving Average), permitindo visualizar com clareza a força compradora e vendedora do mercado. Valores positivos (barras verdes) indicam que o preço está acima da média móvel, representando pressão compradora (bulls). Valores negativos (barras vermelhas) indicam que o preço está abaixo da média móvel, representando pressão vendedora (b
Daily & Composite Volume Profile   This is a professional-grade market profile tool designed for MetaTrader 5. It utilizes a   Dual-Profile System   to visualize supply, demand, and liquidity concentrations. Key Features Left Side: Daily Session Profiles Automatically identifies the start and end of every trading day. Generates a unique Volume Profile for each individual day. Allows you to see how value migrated from yesterday to today (e.g., Is today's volume higher or lower than yesterday?).
Title: Smart VP: Buy/Sell Bars + POC Description: Enhance your trading with the Right Anchored Volume Profile. Visualize buy and sell volumes per price level with near-bar numbers and identify the Point of Control (POC) instantly. Perfect for traders who want clear market structure at a glance. Features: Right Anchored Volume Profile Buy/Sell volume bars Near-bar volume numbers POC (Point of Control) line Customizable colors and display settings
Delta Profile Volume
Teresinha Moraes Correia
Descrição Técnica do Indicador – Delta Profile para MetaTrader 5 O Delta Profile é um indicador desenvolvido para o MetaTrader 5 com foco em análise detalhada do fluxo de volume dentro de um intervalo definido de candles. Ele organiza e exibe informações sobre o desequilíbrio de volumes positivos (associados a movimentos de alta) e negativos (associados a movimentos de baixa) em diferentes níveis de preço. O resultado é uma visão clara dos pontos do gráfico onde há maior concentração de negócios
Tick Profile Free
Elia Burstein
5 (3)
This indicator will show a vertical representation of the volume distribution within a selected user range. This is a free version of the full product. It is limited to use on a week old data or older. Find the full product at  https://www.mql5.com/en/market/product/42234 . Main features: This Indicator will create an image that will allow viewing the tick volume per price level in a graphical form. The indicator will work on any range size in any time-frame, limited only by your computer mem
FREE
Intraday Session TPO: Precision Volume Profiling for Day Traders Stop trading blind during the most volatile hours of the day. Standard daily volume profiles blend everything together, masking the true areas of liquidity and institutional interest. The Intraday Session TPO is engineered specifically for session-to-session traders. It empowers you to isolate and profile specific time windows—like the London Open, the New York Killzone, or the Asian range—so you can see exactly where the volume is
Versão MT4: https://www.mql5.com/en/market/product/157433 Versão MT5: https://www.mql5.com/en/market/product/167286 O Volume Imbalance é uma ferramenta de visualização leve de Perfil de Volume + Desequilíbrio Delta, concebida para o ajudar a identificar zonas de preço de alta atividade, pressão direcional e áreas de preço "vazias" dentro de um intervalo de observação configurável. Ao contrário do perfil de volume clássico, que apenas mostra o volume total, este indicador divide cada nível de
KT Volume Profile MT5
KEENBASE SOFTWARE SOLUTIONS
O KT Volume Profile exibe os dados de acumulação de volume como um histograma no eixo Y, permitindo visualizar a atividade de negociação ao longo de determinados períodos e níveis de preço. Ponto de Controle (POC) no Perfil de Volume O POC representa o nível de preço com o maior volume negociado dentro do histograma do perfil de volume. Geralmente, é utilizado como suporte/resistência ou como um nível-chave onde o mercado pode fazer um reteste antes de seguir em uma direção específica. Recurso
The Rally Base Drop SND Pivots indicator uses "Rally", "Base", and "Drop" Candles to determine pivot points at which supply and demand (SND) levels are drawn. (Figure 1)   USAGE Figure 2 Rally, Base, and Drop (RBD) candles create a formula for seeing market structure through a fixed methodology. We are able to use this concept to point out pivot areas where Rallies and Drops directly meet. The RBD SND Pivots are similar to traditionally identified "fractal" pivot points, with one key differ
Dynamic POC MT5
Evgeny Shevtsov
5 (1)
The indicator calculates volume profiles dynamically and displays the result as VAL, VAH and POC curves. Indicator features The indicator uses the historical data of the lower (relative to the current) timeframes for calculations: M1 - for timeframes up to H1, M5 - for timeframe H1, M15 - for timeframe H4, H1 - for timeframe D1, H4 - for timeframe W1, D1 - for timeframe MN. The color of the DPOC curve sections is determined by comparing the volume of the POC levels of all profiles that make up
MarketProfileTPO: Análise TPO no MetaTrader 5 O indicador MarketProfileTPO para MetaTrader 5 é uma ferramenta poderosa projetada para trazer o conceito de Perfil de Mercado ( Market Profile ), baseado na análise de Oportunidade de Tempo e Preço (TPO) , diretamente para a sua janela principal do gráfico. Este indicador calcula e exibe a distribuição de preços ao longo de um período especificado, destacando as áreas-chave de atividade e concentração do mercado. É particularmente otimizado para at
Was: $249  Now: $99   Market Profile defines a number of day types that can help the trader to determine market behaviour. A key feature is the Value Area, representing the range of price action where 70% of trading took place. Understanding the Value Area can give traders valuable insight into market direction and establish the higher odds trade. It is an excellent addition to any system you may be using. Inspired by Jim Dalton’s book “Mind Over Markets”, this indicator is designed to suit the
Blahtech Supply Demand MT5
Blahtech Limited
4.54 (13)
Was: $299  Now: $99  Supply Demand uses previous price action to identify potential imbalances between buyers and sellers. The key is to identify the better odds zones, not just the untouched ones. Blahtech Supply Demand indicator delivers functionality previously unavailable on any trading platform. This 4-in-1 indicator not only highlights the higher probability zones using a multi-criteria strength engine, but also combines it with multi-timeframe trend analysis, previously confirmed swings a
Volume Delta Candles offer a straightforward way to analyze trading activity within each candle, making it easier to see what's happening without needing an extra volume indicator. This tool uses lower timeframe or real-time data to show the percentage of buying and selling volume within a candle as a colored bar. Make sure you understand Volume and Volume Delta before jumping in. If you’re not sure, reach out to me first for a quick rundown. But if you're already familiar, you're good to go! Ke
VolumeProfile MT5
Robert Hess
4.14 (7)
Description: The Volume Profile displays detailed informations of historical trading activities at certain price levels (Market Profile). Locate the areas with the best prices in the market and get an advantage over other market participants. Features: Customizable Market Profile Shows the "fair" Value Area with 70% of all Volume Shows critical low volume zones Shows VPOC, VAL and VAH Points integrated resource management to reduce the load while working with multiple charts Works on all timefr
Zonas de Volume de Oferta/Demanda — Suporte e Resistência Institucionais com Pressão Compradora/Vendedora Supply Demand Volume  é uma ferramenta de precisão projetada para detectar automaticamente zonas-chave de oferta e demanda com base na estrutura de preço, análise de volume e volatilidade em tempo real. Ideal para traders que utilizam níveis precisos de suporte e resistência, fluxo de ordens institucionais, esquemas Wyckoff ou conceitos Smart Money. Principais Recursos: Detecção Automátic
Os compradores deste produto também adquirem
Azimuth Pro
Ottaviano De Cicco
5 (6)
PROMOÇÃO DE LANÇAMENTO O preço do Azimuth Pro está inicialmente definido em 299$ para os primeiros 100compradores. O preço final será de 499$ . A DIFERENÇA ENTRE ENTRADAS RETAIL E INSTITUCIONAIS NÃO É O INDICADOR — É A LOCALIZAÇÃO. A maioria dos traders entra em níveis de preço arbitrários, perseguindo momentum ou reagindo a sinais atrasados. As instituições esperam o preço atingir níveis estruturados onde oferta e demanda realmente mudam. Azimuth Pro mapeia esses níveis automaticamente: VWA
Divergence Bomber
Ihor Otkydach
4.9 (86)
Cada comprador deste indicador recebe adicionalmente, e de forma gratuita: A ferramenta exclusiva "Bomber Utility", que acompanha automaticamente cada operação, define os níveis de Stop Loss e Take Profit e fecha operações de acordo com as regras da estratégia; Arquivos de configuração (set files) para ajustar o indicador em diferentes ativos; Set files para configurar o Bomber Utility nos modos: "Risco Mínimo", "Risco Balanceado" e "Estratégia de Espera"; Um vídeo tutorial passo a passo que aju
Veja qual estrategia realmente funciona no seu simbolo - antes de arriscar dinheiro real. Power Bar detecta barras de preco extremas em qualquer simbolo e qualquer timeframe, e entao faz backtest instantaneo de 3 estrategias de trading diferentes para que voce possa comparar taxas de acerto, fatores de lucro e P&L lado a lado. Tudo em um unico painel interativo. Sem suposicoes. Sem curve-fitting. Apenas dados. O que torna o Power Bar unico? A maioria dos indicadores fornece um sinal e deixa voc
Entry In The Zone and SMC Multi Timeframe is a real-time market analysis tool developed based on Smart Money Concepts (SMC). It is designed to analyze market structure, price direction, reversal points, and key zones across multiple timeframes in a systematic way. The system displays Points of Interest (POI) and real-time No Repaint signals, with instant alerts when price reaches key zones or when signals occur within those zones. It functions as both an Indicator and a Signal System (2-in-1), c
Se você comprar este indicador, receberá meu Gerenciador de Operações Profissional + EA  GRATUITAMENTE. Primeiramente, vale ressaltar que este Sistema de Trading é um Indicador Não Repintado, Não Redesenho e Não Atrasado, o que o torna ideal tanto para o trading manual quanto para o automatizado. Curso online, manual e download de predefinições. O "Sistema de Trading Inteligente MT5" é uma solução completa de trading projetada para traders novos e experientes. Ele combina mais de 10 indicadores
Meridian Pro
Ottaviano De Cicco
5 (1)
Meridian Pro: Matriz Profissional de Tendência Multi-Timeframe para MT5 Visão geral Meridian Pro é uma matriz de tendência multi-timeframe da Merkava Labs que comprime estado direcional, força, condição de momentum e concordância da matriz em um painel compacto. Um motor adaptativo, aplicado consistentemente de M1 a W1. Sem ajuste por símbolo. Sem acúmulo de indicadores. Uma leitura estruturada em todos os ativos e todos os timeframes. Oferta de lançamento — Obtenha o Meridian Pro por USD 99 (in
RelicusRoad Pro: Sistema Operacional Quantitativo de Mercado 70% DE DESCONTO ACESSO VITALÍCIO (TEMPO LIMITADO) - JUNTE-SE A 2.000+ TRADERS Por que a maioria dos traders falha mesmo com indicadores "perfeitos"? Porque eles operam Conceitos Únicos no vácuo. Um sinal sem contexto é uma aposta. Você precisa de CONFLUÊNCIA . RelicusRoad Pro não é um simples indicador de seta. É um Ecossistema Quantitativo de Mercado completo. Ele mapeia a "Estrada do Valor Justo", distinguindo ruído de rupturas estru
FX Trend MT5 NG
Daniel Stein
5 (4)
FX Trend NG: A Nova Geração de Inteligência de Tendência Multi-Mercado Visão Geral FX Trend NG é uma ferramenta profissional de análise de tendências e monitoramento de mercado em múltiplos períodos de tempo. Permite compreender a estrutura completa do mercado em segundos. Em vez de alternar entre vários gráficos, você visualiza instantaneamente quais ativos estão em tendência, onde o momentum está enfraquecendo e onde existe alinhamento forte entre diferentes timeframes. Oferta de Lançamento
Atomic Analyst MT5
Issam Kassas
3.94 (31)
Primeiramente, vale ressaltar que este Indicador de Negociação não repinta, não redesenha e não apresenta atrasos, tornando-o ideal tanto para negociação manual quanto automatizada. Manual do utilizador: configurações, entradas e estratégia. O Analista Atômico é um Indicador de Ação de Preço PA que utiliza a força e o momentum do preço para encontrar uma vantagem melhor no mercado. Equipado com filtros avançados que ajudam a remover ruídos e sinais falsos, e aumentam o potencial de negociação.
Btmm state engine pro
Garry James Goodchild
5 (3)
BTMM State Engine Pro is a MetaTrader 5 indicator for traders who use the Beat The Market Maker approach: Asian session context, kill zone timing, level progression, peak formation detection, and a multi-pair scanner from a single chart. It combines cycle state logic with a built-in scanner dashboard so you do not need the same tool on many charts at once. What it does Draws the Asian session range; session times can follow broker server offset or be set in inputs. Tracks level progression (L
RFI levels PRO MT5
Roman Podpora
3.67 (3)
O indicador mostra com precisão os pontos de reversão e as zonas de retorno de preço onde o   Principais players . Você identifica onde novas tendências estão se formando e toma decisões com máxima precisão, mantendo o controle sobre cada negociação. VERSION MT4     -    Revela seu potencial máximo quando combinado com o indicador   TREND LINES PRO. O que o indicador mostra: Estruturas de reversão e níveis de reversão com ativação no início de uma nova tendência. Exibição dos níveis de   TAKE P
FX Power MT5 NG
Daniel Stein
5 (31)
FX Power: Analise a Força das Moedas para Decisões de Negociação Mais Inteligentes Visão Geral FX Power é a sua ferramenta essencial para compreender a força real das principais moedas e do ouro em quaisquer condições de mercado. Identificando moedas fortes para comprar e fracas para vender, FX Power simplifica as decisões de negociação e revela oportunidades de alta probabilidade. Quer você prefira seguir tendências ou antecipar reversões usando valores extremos de Delta, esta ferramenta adap
OmniSync Projection
Antonio-alin Teculescu
5 (1)
Chronos Fractal Engine is an innovative price projection indicator for MetaTrader 5, designed to transform your technical analysis by intelligently identifying and projecting historical price patterns. Built upon an advanced correlation algorithm and the fractal principles of the market, this powerful tool visualizes potential future price movements, giving you a unique edge in your trading decisions. What is Chronos Fractal Engine? At its core, the Chronos Fractal Engine employs a sophisticat
Trend Screener Pro MT5
STE S.S.COMPANY
4.84 (103)
Desbloqueie o poder da negociação de tendências com o indicador Trend Screener: sua solução definitiva de negociação de tendências, alimentada por lógica difusa e sistema de múltiplas moedas! Eleve sua negociação de tendências com o Trend Screener, o revolucionário indicador de tendências alimentado por lógica difusa. É um poderoso indicador de acompanhamento de tendências que combina mais de 13 ferramentas e recursos premium e 3 estratégias de negociação, tornando-o uma escolha versátil para to
Currency Strength Dashboard Pro Painel profissional de análise de força de moedas em tempo real para MetaTrader 5 . O indicador calcula e exibe a força de 8 moedas principais (EUR, USD, GBP, JPY, CHF, AUD, CAD, NZD) utilizando 28 pares de moedas simultaneamente em múltiplos timeframes. O painel oferece ao trader uma visão completa do mercado em um único olhar — sem cálculos adicionais ou necessidade de alternar entre gráficos. Método de cálculo O indicador é baseado em um método matemático avanç
ARICoins
Temirlan Kdyrkhan
ARICoin is a powerful trading companion designed to generate high-probability entry signals with dynamic TP/SL/DP levels based on volatility. Built-in performance tracking shows win/loss stats, PP1/PP2 hits, and success rates all updated live. Key Features: Buy/Sell signals with adaptive volatility bands Real-time TP/SL/DP levels based on ATR Built-in MA Filter with optional ATR/StdDev volatility Performance stats panel (Success, Profit/Loss, PP1/PP2) Alerts via popup, sound, push, or email Cust
Grabber System MT5
Ihor Otkydach
4.83 (23)
Apresento a você um excelente indicador técnico: Grabber, que funciona como uma estratégia de trading “tudo incluído”, pronta para usar. Em um único código estão integradas ferramentas poderosas de análise técnica de mercado, sinais de entrada (setas), funções de alertas e notificações push. Cada comprador deste indicador também recebe gratuitamente: Utilitário Grabber: ferramenta para gerenciamento automático de ordens abertas Vídeo tutorial passo a passo: como instalar, configurar e operar com
Trend indicator AI mt5
Ramil Minniakhmetov
5 (16)
O indicador Trend Ai é uma ótima ferramenta que irá melhorar a análise de mercado de um trader, combinando a identificação de tendências com pontos de entrada acionáveis e alertas de reversão. Este indicador permite que os usuários naveguem pelas complexidades do mercado forex com confiança e precisão Além dos sinais primários, o indicador Trend Ai identifica pontos de entrada secundários que surgem durante retrações ou retrações, permitindo que os comerciantes capitalizem as correções de preço
LINHAS DE TENDÊNCIA PRO   -   Ajuda a entender onde o mercado está realmente mudando de direção. O indicador mostra inversões de tendência reais e pontos onde os principais participantes retornam ao mercado. Você vê     Linhas BOS   Análise de tendências e níveis-chave em prazos maiores — sem configurações complexas ou ruídos desnecessários. Os sinais não são repintados e permanecem no gráfico após o fechamento da barra. VERSÃO MT4   -   Revela seu potencial máximo quando combinado com o   indic
Quantum TrendPulse
Bogdan Ion Puscasu
5 (22)
Apresentando   Quantum TrendPulse   , a ferramenta de negociação definitiva que combina o poder do   SuperTrend   ,   RSI   e   Stochastic   em um indicador abrangente para maximizar seu potencial de negociação. Projetado para traders que buscam precisão e eficiência, este indicador ajuda você a identificar tendências de mercado, mudanças de momentum e pontos de entrada e saída ideais com confiança. Principais características: Integração SuperTrend:   siga facilmente a tendência predominante do
Bill Williams Advanced
Siarhei Vashchylka
5 (11)
Bill Williams Advanced is designed for automatic chart analysis using Bill Williams' "Profitunity" system. The indicator analyzes four timeframes at once. Manual (Be sure to read before purchasing) Advantages 1. Analyzes the chart using Bill Williams' "Profitunity" system. Signals are displayed in a table in the corner of the screen and on the price chart. 2. Finds all known AO and AC signals, as well as zone signals. Equipped with a trend filter based on the Alligator. 3. Finds "Divergence Bar
Gold Sniper Scalper Pro
Ich Khiem Nguyen
3.78 (9)
Gold Sniper Scalper Pro é um indicador para MetaTrader 5 construído especificamente para detectar padrões de falso rompimento (false breakout) no XAUUSD. Ele identifica a estrutura de armadilha de 4 barras onde o preço rompe o limite de um range, atrai traders de rompimento e então reverte — confirmando que o movimento foi um falso rompimento. O indicador avalia cada setup em 17 fatores de qualidade, processa através de um pipeline de confluência de 4 camadas, verifica contra um motor de consen
CGE Trading Suite
Carl Gustav Johan Ekstrom
5 (1)
CGE Trading Suite delivers the analytical edge typically reserved for professional trading desks. The platform integrates a full suite of analytical tools into one seamless workflow: dynamic grid mapping, liquidity behavior analysis, ECM, trend lines, MIDAS, trade cycles, and directional channel projections. Together, these provide a unified view of market structure and momentum. Directional clarity is further enhanced by the capital flow index, which measures currency basket strength to identif
ARIPoint
Temirlan Kdyrkhan
ARIPoint is a powerful trading companion designed to generate high-probability entry signals with dynamic TP/SL/DP levels based on volatility. Built-in performance tracking shows win/loss stats, PP1/PP2 hits, and success rates all updated live. Key Features: Buy/Sell signals with adaptive volatility bands Real-time TP/SL/DP levels based on ATR Built-in MA Filter with optional ATR/StdDev volatility Performance stats panel (Success, Profit/Loss, PP1/PP2) Alerts via popup, sound, push, or email Cu
Trend Hunter MT5
Andrey Tatarinov
5 (4)
Trend Hunter é um indicador de tendência para trabalhar nos mercados Forex, criptomoeda e CFD. Uma característica especial do indicador é que ele segue a tendência com confiança, sem alterar o sinal quando o preço ultrapassa ligeiramente a linha de tendência. O indicador não é redesenhado; um sinal para entrar no mercado aparece após o fechamento da barra. Ao avançar ao longo de uma tendência, o indicador mostra pontos de entrada adicionais na direção da tendência. Com base nesses sinais, você
Ajuda a determinar se este ponto é adequado para comprar. Ajuda a determinar se este ponto é adequado para vender. Quando os quatro indicadores atingem o fundo ao mesmo tempo, concentre-se nas oportunidades de repique. Quando os quatro indicadores estão simultaneamente no topo, concentre-se nas oportunidades de queda. Este sistema foi desenvolvido com base em tecnologia algorítmica chinesa avançada e em uma estrutura de modelagem matemática de alto nível. Eu uso este indicador principalmente no
PZ Trend Trading MT5
PZ TRADING SLU
3.8 (5)
O Trend Trading é um indicador projetado para lucrar o máximo possível com as tendências que ocorrem no mercado, cronometrando retrocessos e rupturas. Ele encontra oportunidades de negociação analisando o que o preço está fazendo durante as tendências estabelecidas. [ Guia de instalação | Guia de atualização | Solução de problemas | FAQ | Todos os produtos ] Negocie mercados financeiros com confiança e eficiência Lucre com as tendências estabelecidas sem ser chicoteado Reconhecer retrocessos
FX Volume MT5
Daniel Stein
4.79 (24)
FX Volume: Vivencie o Verdadeiro Sentimento de Mercado sob a Perspectiva de um Corretor Visão Geral Rápida Quer aprimorar sua abordagem de trading? FX Volume fornece insights em tempo real sobre como traders de varejo e corretores estão posicionados—bem antes de relatórios atrasados como o COT. Seja para buscar ganhos consistentes ou simplesmente ter uma vantagem mais clara no mercado, FX Volume ajuda você a detectar grandes desequilíbrios, confirmar rompimentos e aperfeiçoar sua gestão de ris
Ultimate SMC Indicator
Hicham Mahmoud Almoustafa
1 (1)
Ultimate SMC PRO – Smart Money Concepts Indicator (Order Blocks, FVG, Liquidity, BOS) for MetaTrader 5    After purchasing the product, you will receive an additional copy for free. Just contact me after your purchase. Ultimate SMC PRO is a professional trading indicator designed to visualize Smart Money Concepts directly on the chart. The indicator combines several institutional trading tools in one system to help traders identify potential high-probability trading zones. ULTIMATE
PZ Day Trading MT5
PZ TRADING SLU
2.83 (6)
Este indicador detecta reversões de preços em zigue-zague, usando apenas análise de ação de preços e um canal donchiano. Ele foi projetado especificamente para negociações de curto prazo, sem repintar ou retroceder. É uma ferramenta fantástica para traders astutos, com o objetivo de aumentar o tempo de suas operações. [ Guia de instalação | Guia de atualização | Solução de problemas | FAQ | Todos os produtos ] Surpreendentemente fácil de negociar Fornece valor em cada período de tempo Impleme
Filtro:
Rafael Alfredo Capucho
358
Rafael Alfredo Capucho 2023.08.15 16:02 
 

Hi, it is a veeeery promising Indicator, but there are minor things that I'd suggest as enhancements, the thing that bothers me more is that there is no way to "hide" the rectangle, unless you completely remove the indicator from the Chart, I would like to see a (button?) that enables me to toggle them without having to attach/detach from the chart, Secondly, the support for multi-rectangles would be amazing (even required, I would say). Thank you, even with the pending enhancements, it is going to be probably the best volume profile indicator soon.

Olexandr Savchuk
465
Resposta do desenvolvedor Olexandr Savchuk 2023.08.15 16:17
Thanks a lot for the review, Rafael. I'm very pleased! Good suggestion for improvement. I will definitely implement it!
Nicolas Dobrovsky
839
Nicolas Dobrovsky 2023.07.17 10:27 
 

when zooming in and out of the chart, the position changes constantly. Some anchoring on the chart would be nice.

Olexandr Savchuk
465
Resposta do desenvolvedor Olexandr Savchuk 2023.07.17 10:32
Thank you very much for your feedback. Yes, this update is planned in the next version, which will be released very soon.
Paul Small
23
Paul Small 2023.07.12 19:47 
 

O usuário não deixou nenhum comentário para sua avaliação

Olexandr Savchuk
465
Resposta do desenvolvedor Olexandr Savchuk 2023.07.12 20:06
thanks you a lot, Paul
ardawan
39
ardawan 2023.07.11 14:50 
 

O usuário não deixou nenhum comentário para sua avaliação

Olexandr Savchuk
465
Resposta do desenvolvedor Olexandr Savchuk 2023.07.11 16:29
Thanks a lot!
Responder ao comentário