MTF ZigZag MT5

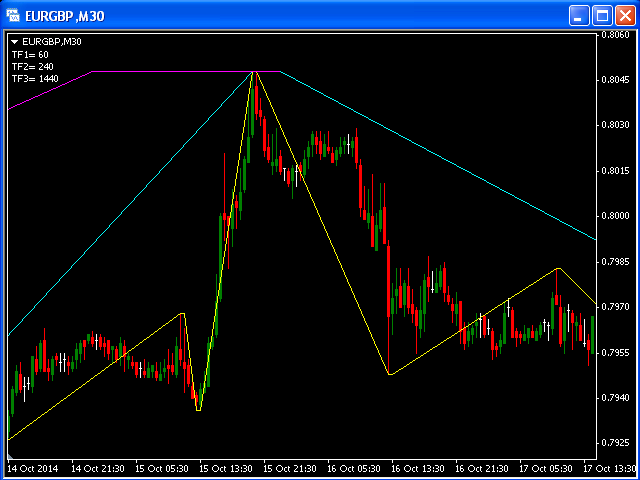
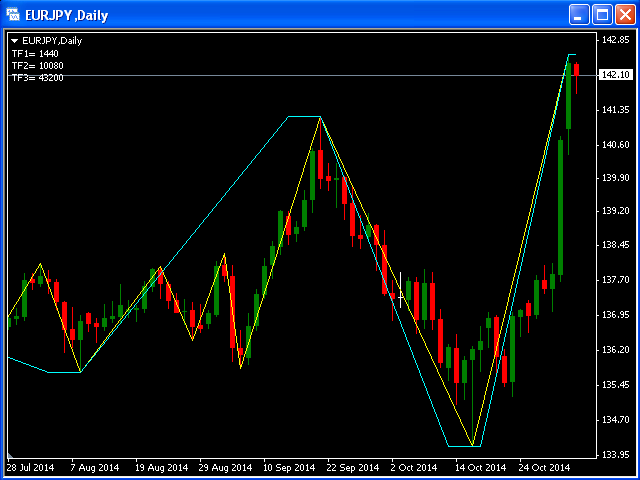
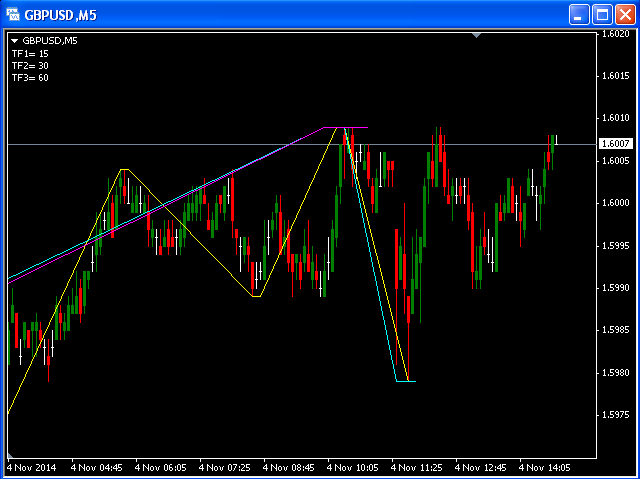
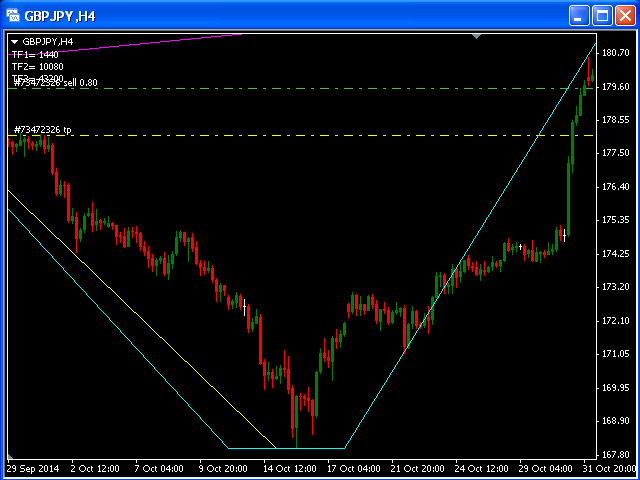
The Zig-Zag indicator is extremely useful for determining price trends, support and resistance areas, and classic chart patterns like head and shoulders, double bottoms and double tops.

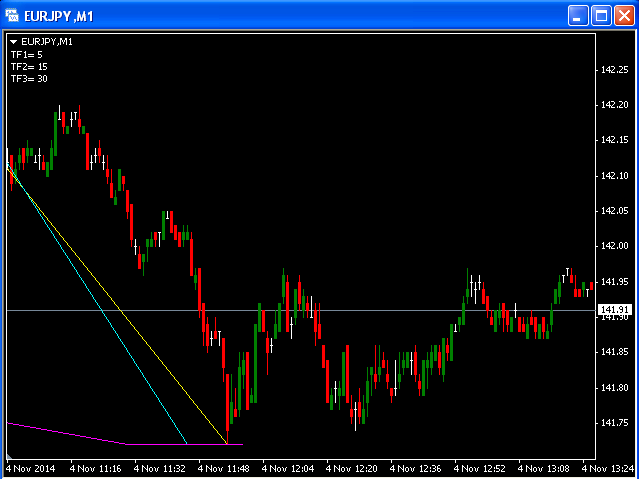
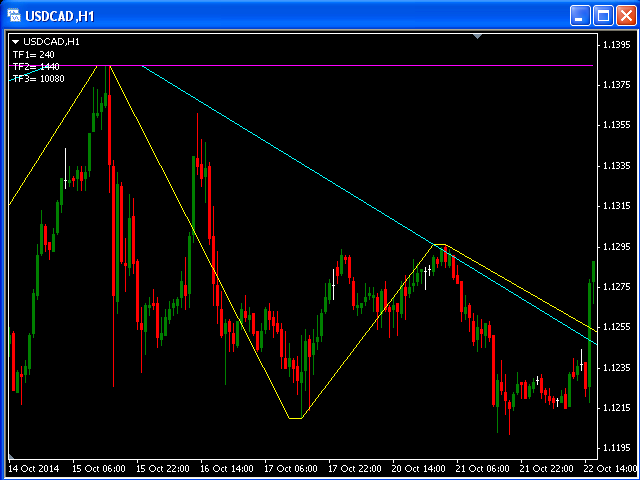
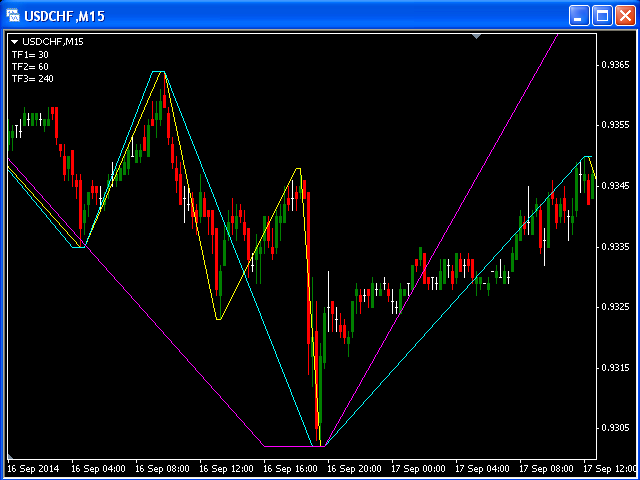
This indicator is a Multi Time Frame indicator.

The indicator is automatically calculate the 3 next available TF and sows ZigZag from those TimeFrames.

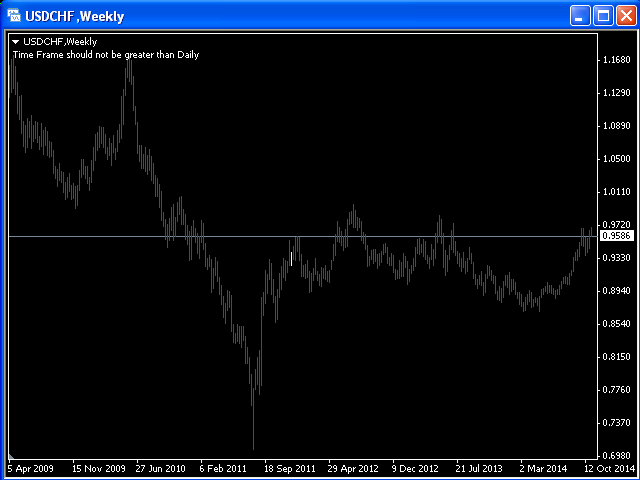
You cannot use this indicator for the TF greater than D1 (daily).

You have to have ZigZag indicator in the Indicators/Examples tab. 

Produtos recomendados
Noize Absorption Index - is the manual trading system that measures the difference of pressure between bears forces and bulls forces. Green line - is a noize free index that showing curent situation. Zero value of index shows totally choppy/flat market.Values above zero level shows how powerfull bullish wave is and values below zero measures bearish forces.Up arrow appears on bearish market when it's ready to reverse, dn arrow appears on weak bullish market, as a result of reverse expectation.
RBreaker
Zhong Long Wu
RBreaker Gold Indicators é uma estratégia de negociação intradiária de curto prazo para futuros de ouro que combina duas abordagens: o seguimento de tendência e as reversões intradiárias. Ela permite capturar lucros durante mercados em tendência e também realizar lucros oportunamente e operar na direção oposta quando o mercado se reverte. Esta estratégia foi classificada por 15 anos consecutivos entre as dez estratégias de negociação mais lucrativas pela revista americana Futures Truth. Ela pos
The RSI Divergence + FVG Signal indicator combines Relative Strength Index (RSI) Divergence with Fair Value Gap (FVG) detection to generate high-probability buy and sell signals based on both momentum shifts and institutional imbalance zones. Core Features: RSI Divergence Detection : Identifies both regular and hidden bullish/bearish divergences between price and RSI. Divergences indicate potential trend reversals or continuation. FVG Zone Recognition : Detects Fair Value Gaps (imbalances caused
Este é sem dúvida o indicador de reconhecimento automático de formação de preço harmônico mais completo que você pode encontrar para a MetaTrader Platform. Ele detecta 19 padrões diferentes, leva as projeções de Fibonacci tão a sério quanto você, exibe a Zona de Reversão Potencial (PRZ) e encontra níveis adequados de stop loss e take-profit. [ Guia de instalação | Guia de atualização | Solução de problemas | FAQ | Todos os produtos ] Detecta 19 formações harmônicas de preços diferentes Traça
O indicador SMC Venom Model BPR é uma ferramenta profissional para os traders que trabalham com o conceito Smart Money (SMC). Identifica automaticamente dois padrões principais no gráfico de preços: FVG   (Fair Value Gap) é uma combinação de três velas, em que existe um gap entre a primeira e a terceira velas. Forma uma zona entre níveis onde não há suporte de volume, o que geralmente leva a uma correção de preço. BPR   (Balanced Price Range) é uma combinação de dois padrões FVG que formam uma
TRI Visualizer
Yoshimi Mon 三 Ura
TRI Visualizer MT5 – Thermodynamic Market Analysis Overview The TRI (Thermal Range Indicator) Visualizer Enhanced is a rare market analysis indicator that goes beyond conventional technical analysis, applying principles of thermodynamics from physics. It interprets market price fluctuations as “thermodynamic energy,” enabling the highly accurate detection of subtle market changes that are often overlooked. Innovative Mechanisms 1. Dual Calculation Engines Classic TRI Mode Formula: |Close
KT Renko Patterns MT5
KEENBASE SOFTWARE SOLUTIONS
O KT Renko Patterns analisa o gráfico Renko tijolo por tijolo para identificar padrões gráficos conhecidos que são amplamente utilizados por traders em diversos mercados financeiros. Em comparação com gráficos baseados em tempo, os gráficos Renko tornam a identificação de padrões muito mais fácil e visualmente clara, graças à sua aparência limpa e objetiva. O KT Renko Patterns possui vários padrões Renko, muitos dos quais são explicados com profundidade no livro "Profitable Trading with Renko
Overview Harmonic Patterns MT5 is a technical analysis indicator designed for the MetaTrader 5 platform. It identifies and displays harmonic price patterns, such as Butterfly, Cypher, Crab, Bat, Shark, and Gartley, in both bullish and bearish directions. The indicator calculates key price levels, including entry, stop loss, and three take-profit levels, to assist traders in analyzing market movements. Visual elements and customizable alerts enhance usability on the chart. Features Detects six ha
Double HMA MTF for MT5
Pavel Zamoshnikov
4 (4)
This is an advanced multi-timeframe version of the popular Hull Moving Average (HMA) Features Two lines of the Hull indicator of different timeframes on the same chart. The HMA line of the higher timeframe defines the trend, and the HMA line of the current timeframe defines the short-term price movements. A graphical panel with HMA indicator data from all timeframes at the same time . If the HMA switched its direction on any timeframe, the panel displays a question or exclamation mark with a tex
Price Magnet — Price Density and Attraction Levels Indicator Price Magnet is a professional analytical tool designed to identify key support and resistance levels based on statistical Price Density. The indicator analyzes a specified historical period and detects price levels where the market spent the most time. These zones act as “magnets,” attracting price action or forming a structural base for potential reversals. Unlike traditional Volume Profile tools, Price Magnet focuses on price-time d
Monster Harmonics Indicator is a harmonic pattern indicator. It recognizes Gartley, Bat, Crab, Butterfly, Cypher, White Swan, Black Swan, Shark and AB=CD patterns. Projected patterns that are not yet completed are recognized, too. Monster even shows the PRZ (Potential Reversal Zone). Users can add their own user defined patterns to Monster. Besides the current pattern, Monster also shows all patterns in the symbols history. Monster will provide alerts for developing patterns. Introduced by H.M.
Terra Infinity is a flat indicator. This improved version of the CalcFlat indicator has three additional lines that significantly increase its effectiveness. Unlike its predecessor with two static levels, Terra Infinity adds three dynamic lines above the main histogram, which are interpreted as follows: base signal line, minimum signal line, maximum signal line. These lines are formed using the additional parameter Avg, which is the average value of the histogram. Averaging produces a line cl
O nível Premium é um indicador único com mais de 80% de precisão nas previsões corretas! Este indicador foi testado pelos melhores Especialistas em Negociação por mais de dois meses! O indicador do autor você não encontrará em nenhum outro lugar! A partir das imagens você pode ver por si mesmo a precisão desta ferramenta! 1 é ótimo para negociar opções binárias com um tempo de expiração de 1 vela. 2 funciona em todos os pares de moedas, ações, commodities, criptomoedas Instruções: Assim
O WaveTrend Oscillator MT5 é um poderoso indicador de trading projetado para aprimorar sua análise de mercado ao identificar mudanças de momentum e potenciais reversões de tendência. Ideal para traders de todos os níveis, essa ferramenta oferece insights valiosos sobre condições de sobrecompra e sobrevenda em vários mercados, incluindo forex, criptomoedas e commodities. Com sua capacidade de gerar sinais de compra e venda precisos, o WaveTrend Oscillator MT5 capacita os traders a tomarem decisõe
**   All Symbols   x   All Timeframes   scan just by pressing scanner button ** Discount: The price is $50$, But now it is just $39, Limited time offer is active. *** Contact me  to send you instruction and add you in "Trend Reversal group" for sharing or seeing experiences with other users. Introduction: Trendlines are the most famous technical analysis in trading . Trendlines continually form on the charts of markets across all the different timeframes providing huge opportunities for traders
Crash 1000 Scalping Indicator for the Crash 1000 Deriv Synthetic Index. Introduction The Crash 1000 Scalping Indicator is a specialized tool designed for the Crash 1000 index on the Deriv Synthetic market. This indicator is particularly useful for scalping on the M1 timeframe, helping traders to identify precise entry and exit points for buy positions. It is designed to be non-repainting, providing clear signals with audible alerts and push notifications, and is compatible with mobile devices th
Cansado de traçar linhas de suporte e resistência? A Resistência de suporte é um indicador de período múltiplo que detecta e plota automaticamente linhas de suporte e resistência no gráfico com um toque muito interessante: conforme os níveis de preços são testados ao longo do tempo e sua importância aumenta, as linhas se tornam mais espessas e mais escuras. [ Guia de instalação | Guia de atualização | Solução de problemas | FAQ | Todos os produtos ] Melhore sua análise técnica da noite para o d
Max Min Delta Indicator - Market Volume Imbalance Analysis Gain Deeper Insights into Market Volume Imbalance with Delta Analysis What is the Max Min Delta Indicator? The Max Min Delta Indicator is a powerful market volume analysis tool that visually represents maximum and minimum delta values using a histogram. It helps traders identify market strength, weakness, absorption, and aggressive buying/selling activity with precision. Key Features Histogram Visualization: Displays Max Delta (Green) an
O indicador DYJ BoS identifica e marca automaticamente os principais elementos das alterações na estrutura do mercado, incluindo: Ruptura da Estrutura (BoS): ocorre quando o preço faz um grande movimento, rompendo o ponto anterior da estrutura. Marca possíveis linhas de tendência de alta e de baixa (UP e DN, ou seja, novos máximos e novos mínimos consecutivos) e, quando o preço rompe essas linhas, marca-as com setas vermelhas (de baixa) e verdes (de alta) . Um BoS ocorre normalmente quando o
Level Volume Pro
John Samfel Bucton Josol
HAT IT DOES   MONTHLY HIGH & LOW — AUTO-DRAWN EVERY MONTH Draws the High and Low of every month for the current year (or any year you set). Each level extends as a horizontal ray into the future so you always see where price is reacting to historical monthly extremes. Color-coded (blue = high, red = low), labeled (JAN HIGH, FEB LOW etc.), fully customizable width and style. Toggle individual months on or off.   WEEKLY HIGH & LOW
Advanced MT5 Indicator: Precision-Powered with Pivot Points, MAs & Multi-Timeframe Logic Unlock the full potential of your trading strategy with this precision-engineered MetaTrader 5 indicator —an advanced tool that intelligently blends Pivot Points , Adaptive Moving Averages , and Multi-Timeframe Analysis to generate real-time Buy and Sell signals with high accuracy.    If you want to test on Real Market, Let me know. I will give the Demo file to run on Real Account.    Whether you're a scal
ATrend
Zaha Feiz
4.83 (18)
ATREND: Como Funciona e Como Usá-lo #### Como Funciona O indicador "ATREND" para a plataforma MT5 é projetado para fornecer aos traders sinais robustos de compra e venda, utilizando uma combinação de metodologias de análise técnica. Este indicador aproveita principalmente o Intervalo Verdadeiro Médio (ATR) para medir a volatilidade, juntamente com algoritmos de detecção de tendências para identificar possíveis movimentos de mercado. Deixe uma mensagem após a compra e receba um brinde especial.
Cumulative delta indicator As most traders believe, the price moves under the pressure of market buying or selling. When someone redeems an offer standing in the cup, the deal is a "buy". If someone pours into the bid standing in the cup - the deal goes with the direction of "sale". The delta is the difference between purchases and sales. A cumulative delta - the difference between the cumulative sum of purchases and sales for a certain period of time. It allows you to see who is currently contr
CosmiCLab SMC FIBO CosmiCLab SMC FIBO is a professional trading indicator designed for traders who use Smart Money Concepts (SMC), market structure analysis and Fibonacci retracement levels. The indicator automatically detects market swings and builds Fibonacci levels based on the latest impulse movement. It also identifies market structure changes such as BOS (Break of Structure) and CHOCH (Change of Character), helping traders understand the current market direction. CosmiCLab SMC FIBO also pr
An indicator of pattern #31 ("Long Island") from Encyclopedia of Chart Patterns by Thomas N. Bulkowski. The second gap is in the opposite direction. Parameters: Alerts - show alert when an arrow appears   Push - send a push notification when an arrow appears (requires configuration in the terminal) GapSize - minimum gap size in points ArrowType - a symbol from 1 to 17 ArrowVShift - vertical shift of arrows in points   ShowLevels - show levels ColUp - color of an upward line ColDn - color of a d
SophieSMC One is a premium Smart Money Concepts indicator designed specifically for XAUUSD (Gold) traders who want a cleaner, more structured and institutional approach to the market. Built around real market structure concepts, SophieSMC One combines multiple Smart Money Concepts tools into one powerful and visually clean trading system for MetaTrader 5. FEATURES: • BOS & CHoCH market structure detection • Fair Value Gap (FVG) identification • Liquidity sweep visualization • Order Block recog
SPECIAL LAUNCH OFFER: $30 (1-Month Rent) Limited time offer to build our community and gather feedback! AmbM GOLD Institutional Scalper A high-precision M5 algorithm for XAUUSD (Gold) , engineered to trade exclusively at Institutional Liquidity Levels ($5/$10 psychological marks). PERFORMANCE DATA (BUY ONLY) • Win Rate: 87.09%. • Safe Growth: +$4,113 profit on $10k (13.75% Max Drawdown). • Extreme Stress Test: Successfully generated +$22,997 in a 5-year stress test (2020-2026), proving
Fit line supports to extrapolation next movement of market, support for buy/sell decision. Indicator using spline algorithm to extrapolation.  You can change number of spline with parameter "PointsNumber" and number of extrapolation point with "ExtrapolateBars". Eextrapolation points will be save into csv format, with prefix in parameter "PointsPrefix", and store in folder File of Data Folder.
Market Shift Levels This indicator detects trend shifts and visualizes key market structure turning points using Hull Moving Average logic. It highlights potential areas of support and resistance where price is likely to react, empowering traders to spot early trend transitions. Market Shift Levels   are horizontal zones that mark the moment of a directional change in market behavior. These shifts are based on crossovers between two smoothed Hull Moving Averages (HMA), allowing the indicator
HAS RSI Signal — Indicador de Tendência Profissional com Cálculo de SL/TP O HAS RSI Signal é uma ferramenta de negociação poderosa que combina clássicos comprovados com algoritmos modernos de filtragem de ruído. O indicador analisa o mercado através das velas Heiken Ashi Smoothed (HAS) e do oscilador RSI , fornecendo sinais de entrada claros em momentos de reversão de tendência ou na saída de zonas de sobrecompra/sobrevenda. Principais Vantagens: Filtragem Dupla: O uso do Heiken Ashi Smoothed pe
Os compradores deste produto também adquirem
Neuro Poseidon MT5
Daria Rezueva
4.97 (32)
Neuro Poseidon is a new indicator by Daria Rezueva. It combines precise trading signals with adaptive TP/SL levels - creating best possible trades as a result! Message me and get  Neuro Poseidon Assistant  as a gift to automize your trading process! What makes it stand out? 1. Proven profitability on all assets and timeframes 2. Only confirmed BUY and SELL signals present on the chart 3. Adaptive TP & SL levels generated by the software for each trade 4. Easy to understand - suitable for al
SuperScalp Pro
Van Minh Nguyen
4.65 (26)
SuperScalp Pro – Sistema avançado de scalping com múltiplos filtros SuperScalp Pro é um indicador avançado de scalping que combina o clássico Supertrend com múltiplos filtros inteligentes de confirmação para ajudar a identificar oportunidades de trading. Funciona de forma eficiente em vários timeframes de M1 até H4, com desempenho otimizado para XAUUSD, BTCUSD e principais pares Forex. O indicador fornece sinais claros de Buy e Sell, juntamente com níveis calculados automaticamente de entrada, S
Vamos ser honestos primeiro. Nenhum indicador sozinho vai te tornar lucrativo. Se alguém te disser o contrário, está te vendendo um sonho. Qualquer indicador que mostre setas perfeitas de compra/venda pode ser feito para parecer impecável — basta dar zoom na parte certa da história e tirar um print das operações vencedoras. Nós não fazemos isso.  SMC Intraday Formula é uma ferramenta. Ela lê a estrutura do mercado para você, identifica as zonas de maior probabilidade de preço e mostra exatament
Entry In The Zone and SMC Multi Timeframe is a real-time 2-in-1 market analysis tool that combines market structure analysis and a No Repaint BUY / SELL signal system into a single indicator, built on Smart Money Concepts (SMC) — a widely adopted framework used by professional traders to understand market structure. This indicator helps you see the market more clearly, make decisions based on structure rather than guesswork, and focus on high-probability zones where price is more likely to react
Divergence Bomber
Ihor Otkydach
4.9 (90)
Cada comprador deste indicador recebe adicionalmente, e de forma gratuita: A ferramenta exclusiva "Bomber Utility", que acompanha automaticamente cada operação, define os níveis de Stop Loss e Take Profit e fecha operações de acordo com as regras da estratégia; Arquivos de configuração (set files) para ajustar o indicador em diferentes ativos; Set files para configurar o Bomber Utility nos modos: "Risco Mínimo", "Risco Balanceado" e "Estratégia de Espera"; Um vídeo tutorial passo a passo que aju
Quantum TrendPulse
Bogdan Ion Puscasu
5 (25)
Apresentando   Quantum TrendPulse   , a ferramenta de negociação definitiva que combina o poder do   SuperTrend   ,   RSI   e   Stochastic   em um indicador abrangente para maximizar seu potencial de negociação. Projetado para traders que buscam precisão e eficiência, este indicador ajuda você a identificar tendências de mercado, mudanças de momentum e pontos de entrada e saída ideais com confiança. Principais características: Integração SuperTrend:   siga facilmente a tendência predominante do
Este produto foi atualizado para o mercado de 2026 e otimizado para as versões mais recentes do MT5. AVISO DE ATUALIZAÇÃO DE PREÇO: Smart Trend Trading System está atualmente disponível por $99 . O preço aumentará para $199 após as próximas 30 compras . OFERTA ESPECIAL: Após comprar o Smart Trend Trading System, envie-me uma mensagem privada para receber o Smart Universal EA GRÁTIS e transformar seus sinais do Smart Trend em operações automatizadas. Smart Trend Trading System é um sistema de tr
SignalTech is an unique fully rule based trading system delivers an Institutional approach for both Independent Traders and Prop Firm Challengers. Never Repaint. Push Notification available. No over-optimization. All the winning trades with chart setups are published on the comments page. 2026-05 4107 Pips (Until 05-29 NY Closed) 2026-04 2243 Pips 2026-03 2165 Pips 2026-02 2937 Pips 2026-01 2624 Pips 2025-12 1174 Pips It can generate signals with Buy/Sell Arrows, Push Notification (To Mobile) an
Power Candles MT5
Daniel Stein
5 (8)
Power Candles V3 - Indicador de força com auto-otimização O Power Candles V3 transforma a força da moeda e do instrumento num plano de negociação prático em todos os gráficos aos quais está associado. Em vez de se limitar a colorir as velas, executa uma otimização automática em tempo real em segundo plano e apresenta-lhe os melhores valores de Stop Loss, Take Profit e limiar de sinal para o símbolo em questão. Basta um clique para o adotar na negociação em tempo real — as linhas de entrada, Stop
PrimeScalping
Temirlan Kdyrkhan
PrimeScalping is a powerful trading companion designed to generate high-probability entry signals with dynamic TP/SL/DP levels based on volatility. Built-in performance tracking shows win/loss stats, PP1/PP2 hits, and success rates — all updated live. Key Features: Buy/Sell signals with adaptive volatility bands Real-time TP/SL/DP levels based on ATR Built-in MA Filter with optional ATR/StdDev volatility Performance stats panel (Success, Profit/Loss, PP1/PP2) Alerts via popup, sound, push, or e
M1 Quantum MT5
Hamed Dehgani
5 (1)
M1 Quantum é um sistema profissional de negociação para M1 que fornece sinais de trading rápidos e precisos, com Stop Loss, Take Profit e gerenciamento inteligente de capital integrados. M1 Quantum inclui um sistema profissional de gerenciamento de capital projetado para aumentar a conta rapidamente, com foco em vitórias consecutivas . Principais recursos do Indicador M1 Quantum Projetado para o time frame M1 e todos os principais pares de moedas Todas as operações possuem Stop Loss e Take Profi
Trend Catcher ind mt5
Ramil Minniakhmetov
5 (5)
INDICADOR TREND CATCHER O Indicador Trend Catcher analisa os movimentos de preços do mercado, utilizando uma combinação de indicadores de análise de tendências adaptativos, proprietários e personalizados pelo autor. Identifica a verdadeira direção do mercado, filtrando o ruído de curto prazo e focando a força do momentum subjacente, a expansão da volatilidade e o comportamento da estrutura de preços. Utiliza também uma combinação de indicadores personalizados de suavização e filtragem de tendê
FX Trend MT5 NG
Daniel Stein
5 (6)
FX Trend NG: A Nova Geração de Inteligência de Tendência Multi-Mercado Visão Geral FX Trend NG é uma ferramenta profissional de análise de tendências e monitoramento de mercado em múltiplos períodos de tempo. Permite compreender a estrutura completa do mercado em segundos. Em vez de alternar entre vários gráficos, você visualiza instantaneamente quais ativos estão em tendência, onde o momentum está enfraquecendo e onde existe alinhamento forte entre diferentes timeframes. Oferta de Lançamento
GoldenX Entry MT5
Kareem Abbas
5 (10)
GoldenX Entry é um indicador para MT5 com um algoritmo adaptativo Smart Entry Trend, um sistema de pontuação de sinais, um detector de regime de mercado e um filtro de volatilidade. Cada sinal inclui um nível de entrada calculado, três níveis de Take-Profit (TP1, TP2, TP3) e um nível de Stop-Loss. Ele é construído sobre múltiplas camadas analíticas projetadas para se adaptar a diferentes condições de mercado, combinando um sistema analítico multicamadas com um otimizador integrado e um sistema d
Gann Made Easy   é um sistema de negociação Forex profissional e fácil de usar, baseado nos melhores princípios de negociação usando a teoria do sr. W. D. Gann. O indicador fornece sinais precisos de COMPRA e VENDA, incluindo níveis de Stop Loss e Take Profit. Você pode negociar mesmo em movimento usando notificações PUSH. Entre em contato comigo após a compra para receber instruções de negociação e ótimos indicadores extras gratuitamente! Provavelmente você já ouviu muitas vezes sobre os método
Meridian Pro
Ottaviano De Cicco
5 (2)
Meridian Pro 2.00: Matriz profissional de tendência multi-timeframe para MT5 Meridian Pro 2.00 é uma matriz de tendência adaptativa profissional para MetaTrader 5. Combina o motor original de tendência Meridian, um ribbon limpo no gráfico, setas de sinal em barra fechada, um dashboard de 8 timeframes, Fuel momentum, consenso ponderado, processamento HTF sintético e linhas de contexto de timeframe superior diretamente no gráfico. O objetivo é simples: ler tendência atual, estrutura multi-timefram
O UZFX {SSS} Scalping Smart Signals MT5 é um indicador de negociação de alto desempenho que não repinta, concebido para scalpers, day traders e swing traders que exigem sinais precisos e em tempo real em mercados em rápida evolução. Desenvolvido pela (UZFX-LABS), este indicador combina a análise da ação do preço, a confirmação de tendências e a filtragem inteligente para gerar sinais de compra e venda de alta probabilidade em todos os pares de moedas e intervalos de tempo. RECOMENDO* OS MELHORE
SmartScalping
Temirlan Kdyrkhan
SmartScalping is a powerful trading companion designed to generate high-probability entry signals with dynamic TP/SL/DP levels based on volatility. Built-in performance tracking shows win/loss stats, PP1/PP2 hits, and success rates — all updated live. Key Features: Buy/Sell signals with adaptive volatility bands Real-time TP/SL/DP levels based on ATR Built-in MA Filter with optional ATR/StdDev volatility Performance stats panel (Success, Profit/Loss, PP1/PP2) Alerts via popup, sound, push, or e
ARIPoint
Temirlan Kdyrkhan
1 (1)
ARIPoint is a powerful trading companion designed to generate high-probability entry signals with dynamic TP/SL/DP levels based on volatility. Built-in performance tracking shows win/loss stats, PP1/PP2 hits, and success rates all updated live. Key Features: Buy/Sell signals with adaptive volatility bands Real-time TP/SL/DP levels based on ATR Built-in MA Filter with optional ATR/StdDev volatility Performance stats panel (Success, Profit/Loss, PP1/PP2) Alerts via popup, sound, push, or email Cu
TrendProMaster
Temirlan Kdyrkhan
MasterTrend Indicator for MT5 A powerful trend-following and signal-evaluation tool MasterTrend   is a custom MT5 indicator that combines Moving Averages and ATR-based risk/reward logic to generate clear buy/sell signals. It visualizes dynamic SL/TP levels, evaluates past trade outcomes, and displays win/loss statistics in a clean on-chart panel. Key features include: Buy/Sell signals based on MA crossovers ATR-based SL/TP1/TP2/TP3 levels with visual lines and labels Signal outcome tracking wit
Reversion King Indicator
Eugen-alexandru Zibileanu
5 (4)
Um novo Rei chegou à cidade - Indicador + Gestão de Ordens (TP1 + TP2 + TP3) + Enviador opcional de sinais para Telegram INCLUÍDO (GRÁTIS) (SISTEMA COMPLETO DE TRADING e SINAIS) Nosso melhor EA para Ouro: Gold Slayer Este indicador inclui uma estratégia avançada, um sistema de trading com gestão de ordens personalizável e um sistema de reversão à média que combina extensões de envelopes, apoiado por múltiplos filtros inteligentes de confirmação, como o RSI, para capturar entradas de reversão de
Atomic Analyst MT5
Issam Kassas
4.26 (35)
Este produto foi atualizado para o mercado de 2026 e otimizado para as versões mais recentes do MT5. AVISO DE ATUALIZAÇÃO DE PREÇO: Atomic Analyst está atualmente disponível por $99 . O preço aumentará para $199 após as próximas 30 compras . OFERTA ESPECIAL: Após comprar o Atomic Analyst, envie-me uma mensagem privada para receber o Smart Universal EA GRÁTIS e transformar seus sinais do Atomic Analyst em operações automatizadas. Atomic Analyst é um indicador de trading de Price Action sem repa
Azimuth Pro
Ottaviano De Cicco
5 (7)
Azimuth Pro V2: Estrutura Fractal Sintética e Entradas Confirmadas para MT5 Visão geral Azimuth Pro é um indicador de estrutura swing multinível da Merkava Labs . Quatro camadas de swing aninhadas, VWAP ancorado em swings, detecção de padrões ABC, filtragem estrutural de três timeframes e entradas confirmadas em barra fechada — um gráfico, um fluxo de trabalho dos micro-swings aos macro-ciclos. Este não é um produto de sinais cegos. É um fluxo de trabalho baseado em estrutura para traders que v
ScalpPoint
Temirlan Kdyrkhan
ScalpPoint is a powerful trading companion designed to generate high-probability entry signals with dynamic TP/SL/DP levels based on volatility. Built-in performance tracking shows win/loss stats, PP1/PP2 hits, and success rates — all updated live. Key Features: Buy/Sell signals with adaptive volatility bands Real-time TP/SL/DP levels based on ATR Built-in MA Filter with optional ATR/StdDev volatility Performance stats panel (Success, Profit/Loss, PP1/PP2) Alerts via popup, sound, push, or emai
Market Structure Order Block Dashboard MT5 é um indicador MT5 projetado para traders que querem ler a estrutura de mercado e as principais zonas de reação do preço diretamente no gráfico. Combina BOS, ChoCH, Order Blocks, Fair Value Gaps (FVG), Liquidez, Kill Zones, Volume Profile e um painel compacto para análise rápida. Este indicador é voltado para traders que usam estrutura de mercado, conceitos ICT e Smart Money como quadro de decisão. Pode ajudar a identificar continuações de tendência, po
FX Power MT5 NG
Daniel Stein
5 (32)
FX Power: Analise a Força das Moedas para Decisões de Negociação Mais Inteligentes Visão Geral FX Power é a sua ferramenta essencial para compreender a força real das principais moedas e do ouro em quaisquer condições de mercado. Identificando moedas fortes para comprar e fracas para vender, FX Power simplifica as decisões de negociação e revela oportunidades de alta probabilidade. Quer você prefira seguir tendências ou antecipar reversões usando valores extremos de Delta, esta ferramenta adap
Crystal Heikin Ashi Signals
Muhammad Jawad Shabir
5 (2)
Crystal Heikin Ashi Signals - Professional Trend & Signal Detection Indicator Advanced Heikin Ashi Visualization with Intelligent Signal System for Manual & Automated Trading Final Price: $149 ---------> Price goes up $10 after every 10 sales . Limited slots available — act fast . Overview Crystal Heikin Ashi Signals is a professional-grade MetaTrader 5 indicator that combines pure Heikin Ashi candle visualization with an advanced momentum-shift detection system. Designed for both manual traders
Apresentando       Quantum Breakout PRO   , o inovador Indicador MQL5 que está transformando a maneira como você negocia Breakout Zones! Desenvolvido por uma equipe de traders experientes com experiência comercial de mais de 13 anos,       Quantum Breakout PRO       foi projetado para impulsionar sua jornada comercial a novos patamares com sua estratégia de zona de fuga inovadora e dinâmica. O Quantum Breakout Indicator lhe dará setas de sinal em zonas de breakout com 5 zonas-alvo de lucro e su
Quant Direction MT5
Georgios Kalomoiropoulos
Quant Direction é uma ferramenta de análise de mercado tridimensional. Ela oferece uma análise de mercado totalmente objetiva, baseada em algoritmos, que calcula simultaneamente desvios percentuais precisos em diversos parâmetros. Desenvolvido com ferramentas avançadas de modelagem com inteligência artificial e rigorosamente testado, o algoritmo foi projetado para interpretar o mercado com precisão sem precedentes. Você pode analisar qualquer par de moedas ou instrumento financeiro em sua plataf
Meravith MT5
Ivan Stefanov
5 (1)
Ferramenta dos market makers. O Meravith irá: Analisar todos os timeframes e exibir a tendência atual em vigor. Destacar zonas de liquidez (equilíbrio de volume) onde o volume comprador e vendedor é igual. Mostrar todos os níveis de liquidez de diferentes timeframes diretamente no seu gráfico. Gerar e apresentar análise de mercado em formato de texto para sua referência. Calcular alvos, níveis de suporte e pontos de stop-loss com base na tendência atual. Calcular a relação risco/retorno das suas
Mais do autor
This indicator is designed for M1 timeframe and shows: Sum of points when the price goes up (Green Histogram). Sum of points when the price goes down (Red Histogram).  In other words, by the number and ratio of bullish points to bearish ones, you can do a technical analysis of the state of the market. If the green histogram prevails over the red one, you can conclude that at the moment the buyers are stronger than the sellers, and vice versa, if the red histogram prevails over the green, the se
This Multi TimeFrame indicator is based on the "Fractals" classical indicator. 2 Inputs: TimeFrame1; TimeFrame2; You can put any available TimeFrame values (from M1 (Period_M1) to MN1 (Period_MN1)) equal or greater ( >= ) than the Period of the current Time Frame. The last Fractals will shown as color lines (Dots Line) of Support and Resistance for the Price moving.
This is a Multi-Time indicator which allows to display RSI and Stochastic indicators from upper timeframes on a single chart. As an example: a single chart EURUSD M5 and RSI (blue line) and Stochastic (yellow line) from H1. Red Histogram is representing Lower trend and Green Histogram is representing Upper trend.
When you put this Multi TimeFrame Parabolic SAR indicator on the chart it will automatically use Parabolic SAR from next available 3 timeframes. Green arrow will show the beginning of Up trend and Red arrow will show the beginning of Down trend. If AlertsEnabled = true, the indicator will show the Alert (message window) with a text like this: "Price going Down on ", Symbol(), " - ", Period(), " min", " price = ", Bid; If eMailEnabled = true the Indicator will send you an eMail with the same text
The zero line is characterized the Flat trend. V-shaped impulse indicates the entrance to the opposite direction. U-shaped impulse = entry orders in the same direction. If AlertsEnabled = true, the indicator will show the Alert (message window) with a text like this: "Price going Down on ", Symbol(), " - ", Period(), " min", " price = ", Bid; If eMailEnabled = true the indicator will send you an eMail with the same text an Alert message with subject: "Trinity-Impolse" (of course you have to chec
The indicator displays the usual Moving Average with input parameters: maPeriod_1; maMethod_1; maAppPrice_1. Then it calculates and displays MA on MA1 with input parameters: maPeriod_2; maMethod_2. Then it calculates and displays MA on MA2 with input parameters: maPeriod_3; maMethod_3. If AlertsEnabled = true the Indicator will show the Alert (message window) with a text like this: "Price going Down on ", Symbol(), " - ", Period(), " min", " price = ", Bid; If eMailEnabled = true the Indicator w
Multi TimeFrame Indicator "MTF CCI Trigger" based on the Commodity Channel Index from the upper TF (input parameter "TimeFrame") yellow line. Aqua line is representing ATR envelopes from the current TF. Green and Red arrows is triggered by CCI and represented UP and DOWN trends accordingly.
The BBImpulse indicator is based on the standard Moving Average indicator. You have MA input parameters: maPeriod - Moving Average period; maMODE - Moving Average mode (0 = MODE_SMA; 1 = MODE_EMA; 2 = MODE_SMMA; 3 = MODE_LWMA); maPRICE - Applied price (0=PRICE_CLOSE; 1=PRICE_OPEN; 2=PRICE_HIGH; 3=PRICE_LOW; 4=PRICE_MEDIAN; 5=PRICE_TYPICAL; 6=PRICE_WEIGHTED). Green Histogram is representing an UP-trend, Red Histogram is representing a Down-trend.
Multi TimeFrame indicator MTF ADX with Histogram shows ADX indicator data from the TF by your choice. You may choose a TimeFrame equal or greater than current TF. Yellow line is representing a price trend from the upper TF. Green line is representing +DI from the upper TF. Red line is representing -DI from the upper TF. Green histogram is displaying an Up-trend. Red histogram is displaying a Down-trend.
This Indicator creates 2 white lines based on Exponential Moving Averag e of High and Low prices. You can regulate how many bars will be involved in the calculation with input parameter HL_Period. Red and Blue arrows are displaying the moment to go Short and Long trades accordingly.
The most common way to interpreting the price Moving Average is to compare its dynamics to the price action. When the instrument price rises above its Moving Average, a buy signal appears, if the price falls below its moving average, what we have is a sell signal. To avoid a spontaneous entries one may use this update from Moving Average Indicator = Stepper-MA.
Envelopes technical Indicator is formed with two Moving Averages one of which is shifted upward and another one is shifted downward. Envelopes define the upper and the lower margins of the price range. Signal to sell appears when the price reaches the upper margin of the band; signal to buy appears when the price reaches the lower margin. To avoid a spontaneous entries one may use this update from Envelopes Indicator = Envelopes-Stepper.
The interpretation of the Bollinger Bands is based on the fact that the prices tend to remain in between the top and the bottom line of the bands. Abrupt changes in prices tend to happen after the band has contracted due to decrease of volatility; If prices break through the upper band, a continuation of the current trend is to be expected; If the pikes and hollows outside the band are followed by pikes and hollows inside the band, a reverse of trend may occur; The price movement that has starte
Fibonacci sequence is defined by integer sequence: 0, 1, 1, 2, 3, 5, 8, 13, 34, 55, 89, 144, ... By definition, it starts from 0 and 1, the next number is calculated as a sum of two previous numbers. Instead of the standard moving average, the indicator uses the caluclation of average price in form: Bar0 + Bar1 + Bar2 + Bar3 + Bar5 + Bar8 + Bar13 +... Input parameters:  FiboNumPeriod (15) - Fibonacci period; nAppliedPrice (0) - applied price (PRICE_CLOSE=0; PRICE_OPEN=1; PRICE_HIGH=2; PRICE_LOW=
This indicator present a main Moving Average line with input parameters maPeriod_1, maMethod_1 and maAppPrice_1. The second line will be a calculation of the Moving Average data of a first line with input parameters maPeriod_2, maMethod_2. The third line will be a calculation of the Moving Average data of a second line with input parameters maPeriod_3, maMethod_3. To avoid a spontaneous entries one may use this indicator-stepper.
This indicator (as almost all others) is based on classical Moving Averages. It shows the Average Bar under the current bar colored in aqua or over the current bar colored in orange. Input Parameters: ma_Period and ma_Method. The Average Bar maybe helpful to predict where the price will move in the nearest future. Of course, this "near future" depends of the current time frame.
Buy when the market is falling and sell when the market is rising. When the market is moving down you start observing and looking for buy signals. When the market is moving up you start looking for sell signals. This indicator points to the moments to Buy (Blue arrow) and to Sell (Orange arrow). Two input parameters: barsNumber and step for optimization (depending on symbol and Time Frame).
This indicator shows: A green light in case the price goes up; A red light in case the price goes down; A yellow light in case there are a sideways trend. A sideways trend is the horizontal price movement that occurs when the forces of supply and demand are nearly equal. This typically occurs during a period of consolidation before the price continues a prior trend or reverses into a new trend
This indicator is created for M1 timeframe. It shows how many ticks has occurred during current minute and ( after the slash) the sum of points Up (aqua color) and Down (orange color). In times of a high trading activity a grow up number of ticks Up and Down will signal of a big move of the price in the near future. In times of a high trading activity a grow up number of sum of points Up and Down will signal of a big move of the price in the near future too.
Two yellow lines. This is similar to classical Envelopes but with automatic deviation. The Envelopes indicator is   a tool that attempts to identify the upper and lower bands of a trading range. Aqua line. This is a classical Commodity Channel Index added to the Envelopes on the chart, not in a separate window. The Commodity Channel Index ( CCI ) is a technical   indicator   that measures the difference between the current price and the historical average price.
Probability deals with the likelihood of an event happening.   Forex   probability indicates a possibility at a specific time. This is because the forex market is highly volatile, and predicting future events affecting it is impossible. This indicator will show a positive number above the current High or negative number under the current Low as a probability of the trend. Higher time frames usually show a higher probability, even more then 100%.
Envelopes is an excellent indicator when the market is trending. Open Long position when the ClosePrice crossed the upper Aqua band. Close Long position when the Price crossed the upper Yellow band moving down. Open Short position when the ClosePrice crossed the lower Aqua band. Close Short position when the Price crossed the lower Yellow band moving up.
Moving Average Bars is a self-explanatory indicator with one input parameter: nPeriod. When the previous Price Close is above the previous indicator Bar, the probability to go Long is very high.   When the previous Price Close is under the previous indicator Bar, the probability to go Short is very high.
This indicator is based on the same idea as https://www.mql5.com/en/market/product/2406 , but instead of Average Bars it uses series or Fibonacci sequence. When the previous Price Close is above the previous indicator Bar, the probability to go Long is very high. When the previous Price Close is under the previous indicator Bar, the probability to go Short is very high.
This indicator is based on two ideas: Correlations between 5 main currency pairs: EURUSD, GBPUSD, USDCHF, USDJPY, USDCAD; US Dollar Index = the value of the United States dollar relative to a basket of foreign currencies. The use of the indicator is the same as classical  Commodity Channel Index  (CCI) indicator. CCI is calculated with the following formula:  (Typical Price - Simple Moving Average) / (0.015 x Mean Deviation) (Typical Price - Simple Moving Average) / (0.015 x Mean Deviation)
A  tick  is a measure of the minimum upward or downward movement in the  price  of a security. A  tick  can also refer to the change in the  price  of a security from one trade to the next trade.  This indicator will show amounts of ticks when the price goes up and down. This indicator is designed for M1 time frame and shows: Sum of points when the price goes up (Green Histogram). Sum of points when the price goes down (Red Histogram). 
This indicator is a combination of 2 classical indicators MA and RVI. The Relative Vigor Index (RVI) is a momentum indicator used in technical analysis that measures the strength of a trend by comparing a security's closing price to its trading range while smoothing the results using a simple moving average   The input parameter  counted_bars  determines how many bars the indicator's lines will be visible. The input parameter MaRviPeriod  is used for MA and RVI calculation.
This indicator is a combination of 2 classical indicators: MA and Force Index. The input parameter  counted_bars  determines on how many bars the indicator lines will be visible. The input parameter  MaForcePeriod  is used for MA and Force calculation. You may go Long if the current price crossed Up the Ribbon (HISTOGRAM)  and you may go Short if the current price crossed Down the Ribbon (HISTOGRAM)
This indicator is a combination of 2 classical indicators: MA and CCI. Two moving averages form Upper and Lower bands. The input parameter  counted_bars  determines on how many bars the indicator's lines will be visible. The input parameter  barsNum  is used for MA and CCI calculation.
This indicator is using 2 classical indicators: Commodity Channel Index from the higher TF (which you may change using input parameter TimeFrame ) and Average True Range from the current TF. The Green ribbon indicates the upper trend and the Red ribbon indicates the down trend. Buy when the Yellow line crosses the Upper bound (Aqua line). Sell when the Yellow line crossover the Lower bound (Aqua line).
Filtro:
Sem comentários
Responder ao comentário