MTF Stochastic RSI

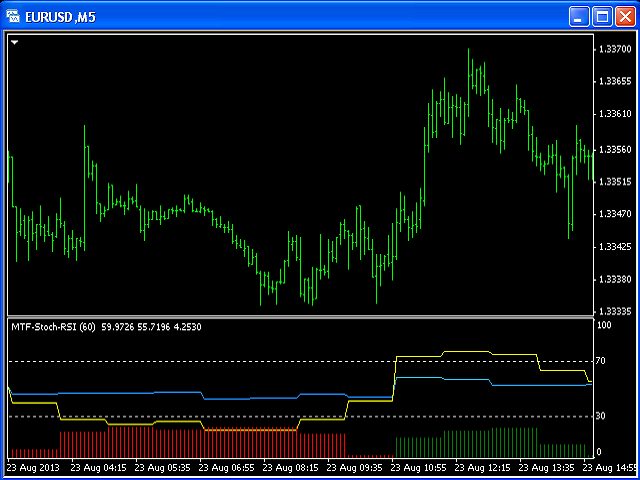
This is a Multi-Time indicator which allows to display RSI and Stochastic indicators from upper timeframes on a single chart.

As an example: a single chart EURUSD M5 and RSI (blue line) and Stochastic (yellow line) from H1.

Red Histogram is representing Lower trend and Green Histogram is representing Upper trend.

Produtos recomendados
Heikin-Ashi-Sniper is a perfect addition to your portfolio. It is meant to be traded on EURUSD on H1 Timeframe. It uses Heikin-Ashi High and Low/High of Monthly timeframe to determine optimal entry signals while having a reasonably low drawdown More EA´s will be published shortly to complete the Portfolio. The EA Trades not very frequently it waits for the right chance and places the order. The rest of the time, your capital is free to be traded on other strategies Please see backtest results i
FREE
RSI Jurik
Augustine Kamatu
Introducing RSI Jurik—an innovative indicator designed to revolutionize your forex trading strategy by combining custom moving averages based on the Relative Strength Index (RSI) with the MetaTrader 4 indicator, RSI. Jurik moving averages are renowned for their accuracy and reliability in analyzing price movements in the forex market. They provide traders with smoother representations of price action, reducing noise and offering clearer signals for identifying trends and potential reversals.
FREE
A top-quality from the famous XSuper Trend indicator. It is completely loyal to the original algorithm, and implements many useful features Which includes Trend Indicators as Filters like MACD,CCI and Alligator. The Chefs Super Trend Plus Indicator is a great way to identify the current market trend. The indicator shows a clear distinction between uptrends and downtrends. The indicators has optional filters for sound signal. Suitable for the following trending pairs: EUR/USD, GBP/USD, USD/JPY,
Summary This indicator is based on RSI and Momentum indicators. It also considers moving averages of these two indicators. The three indicators have adjustable settings. The arrows do not repaint since the indicator only uses confirmed values and waits for the candle to close before painting an arrow. The indicator is also able to alert when arrows appear. There are 3 types of alerts - Popup, Email and Mobile Push Notifications. The arrows can be used in the EA and the inputs can also be optimiz
FREE
The " Multi Kernel Regression " is a versatile trading indicator that provides graphical interpretations of market trends by using different kernel regression methods. It's beneficial because it smoothes out price data, creating a clearer picture of price movements, and can be tailored according to the user's preference with various options. What makes this indicator uniquely versatile is the 'Kernel Select' feature, which allows you to choose from a variety of regression kernel types, such as
FREE
Descubra o poder das tendências de mercado como nunca antes com o Indicador de Tendência Multi-Período 3-HMA. Esta ferramenta confiável é o seu parceiro de confiança no complexo mundo do comércio forex. Foi criada com versatilidade e precisão em mente, tornando-se ideal para traders que entendem a importância de seguir as tendências e desejam aproveitar a reatividade inigualável da Média Móvel de Hull (HMA). A Média Móvel de Hull distingue-se das médias móveis convencionais pela sua notável ca
O painel de alerta RSI / TDI permite monitorar RSIs de uma só vez (selecionável por você) em todos os principais pares que você negocia. Você pode usá-lo de duas maneiras: 1. Selecione vários prazos e o traço mostrará quando houver vários prazos estendidos além das condições normais de negociação. Um ótimo indicador de que o preço aumentou muito recentemente, pois atingiu um nível de sobrecompra ou sobrevenda em vários prazos, de modo que uma retração ou reversão deve ocorrer em breve. 2. U
Multi-Timeframe EMA Momentum Filter — Version 1.0 This indicator is designed to help traders evaluate short-term EMA crossovers in the context of higher timeframe momentum. Its purpose is to reduce noise and highlight setups that align with the broader market trend. How it works: On the main chart, arrows appear when a fast EMA crosses a slow EMA on the current timeframe, provided that higher timeframe momentum confirms the direction. In the subwindow, a histogram displays the difference betwee
FREE
Monitoring of real trading on this system   https://www.mql5.com/ru/signals/632726 Guru Pro Signal does not repaint!  Guru Pro Signal is an original indicator, developed for the work of employees of one of the large funds! It is the best tool that can be added to your chart!  Guru Pro Signal signals about price reversal with the highest degree of accuracy, the best tool for both scalping and position trading. The entry signal is shown by the BUY and SELL arrows. It is possible to receive notif
Japanese Candlesticks Monitor scans Japanese candlesticks. It shows a vertical line and a name of a probable candlestick pattern. The indicator is constantly updated, and new patterns are added. Your feedback is most welcome. I have just started working on the indicator, and your opinions are highly appreciated . The indicator does not work on history data . If the indicator has not been launched at a candle opening, that candle is not considered. This means that the indicator works in real time
Rung
Iurii Tokman
Rung   Indicador de tendência. O indicador identifica e marca em cores diferentes as principais tendências do movimento dos preços, ao mesmo tempo que elimina e não reage ao ruído e aos movimentos dos preços de curto prazo contra a tendência principal. O indicador é uma ferramenta que determina a tendência atual do mercado. Com as configurações padrão, uma tendência de alta ("tendência de alta"), o indicador marca com uma linha verde, uma tendência de baixa ("tendência de baixa") - com uma linha
FREE
TrendSeeker Pro – Painel Definitivo de Tendência e Ponto de Reversão + Detector de Range H4 O Ultimate Trend & Turning Point Dashboard é um sistema completo de decisão de mercado multi-timeframe, projetado para manter o trader sempre do lado correto da tendência, eliminar condições de range de baixa probabilidade e entregar entradas precisas em pontos de reversão com alta confiança. Isso não é apenas um indicador — é um framework completo de trading que responde três perguntas essenciais antes d
Wall of worry
Illia Zhavarankau
Description: The Wall of Worry indicator allows you to assess market sentiment and possible reversals. The indicator represents three lines that are displayed in a separate window. Black line (trend) - the amount of volumes in the candle body. Red line (bears) - the amount of volumes in the upper shadow of the candlestick. Blue line (bulls) - the amount of volumes in the lower shadow of the candle. The idea is based on "Wall of Worry" - this is the periodic tendency of financial markets to
Comfortable MACD
Anton Iudakov
4.75 (4)
Trading with the help of the MACD indicator has become even more convenient. Flexible settings will help you choose what you really need in your trading. Use the strategy that you need - the indicator uses 3 strategies. Download the demo right now! I recommend watching my advisor - Night Zen EA Subscribe to my telegram channel, link in my profile contacts -   my profile See also my other products on mql5.com -   my products Advantages of the indicator: In this indicator, the interpretation of th
FREE
Trends and News
Aleksander Gladkov
5 (1)
With the Trend and News indicator you will always be up to date : News + Trends + Forecast News Displayed on the chart as vertical lines with a description in the form of a tooltip The text displays two news: the previous published and the next expected They have filters: by importance (High, Medium, Low) and time period (Day, 4 days, Week) Full table of news for a given period (T button) Controlling the display of vertical lines on the chart and the sound signal before and after the publicati
Infinity Trend Pro
Yaroslav Varankin
1 (1)
This is a trend indicator without redrawing Developed instead of the binary options strategy (by the color of the Martingale candlestick) Also works well in forex trading When to open trades (binary options) A signal will appear in the place with a candle signaling the current candle It is recommended to open a deal for one candle of the current timeframe M1 and M5 When a blue dot appears, open a deal up When a red dot appears, open a trade down. How to open trades on Forex. When a signal is rec
Versus USD MT4
Vonjinirina Alfred Randrianiaina
Versus USD calcula a variação de preço de cada uma das principais moedas em relação ao USD e exibe uma visão clara e comparativa do seu desempenho para cada período ou barra indexada pelo cursor no Timeframe atual do gráfico com barras de progresso . Adicionalmente, marca uma seta na barra/período em que a moeda em questão experimentou a taxa de mudança mais alta ou baixa em relação ao USD comparada com outras moedas, fornecendo assim uma medida mais precisa do desempenho da moeda. O Dólar Ameri
Reservoir is a reversal indicator and is part of a special category of instruments. The indicator not only analyzes the price movement, but also indicates the points of possible reversals. This contributes to the quick and optimal opening of buy or sell orders (depending on the current situation). In this case, the historical data of the analyzed asset is necessarily taken into account. It is the correct implementation of such actions that in many ways helps traders make the right decision in t
The Trend Line Index is a multi-currency indicator that shows the strength of a currency at the moment or for any period of history data. Description of strategy and operation principle The indicator constantly analyzes 8 currencies or the ones that make up the 28 currency pairs . In the settings you can choose the period to analyze the movement you are interested in. To do this, select the timeframe, the number of the analyzed bars in the settings, as well as the number of the bar to start the
Apresentando o Ichimoku Cloud Strategy Multicurrency EA MT4, uma solução de trading sofisticada projetada para traders que buscam aproveitar o poder do indicador Ichimoku em múltiplos pares de moedas. Este consultor especializado automatiza decisões de trading com base em uma lógica de sinal robusta, tornando-o ideal tanto para traders novatos quanto experientes que desejam otimizar suas estratégias de trading. Este EA fornece uma estrutura de trading abrangente, permitindo que os usuários se be
Femade Indie
Opengates Success International
Femade Indie Vs 1.0 is a simple but multi-currency monitoring Indicator created to instantly notify the trader when an attached currency pair is ready to buy, sell or give signal when such currency pair is getting ready for a big move either up or down. It does this by visual aids on the screen charts, sound and pop-up alerts. If it shows " Medium ", this means that the so called currency signal is almost gone but can still be traded provided the trader will not need a lot of pips which can be b
TrendRange
Olalekan Gisanrin
TrendRange   Indicator works on M1, M5, M15, M30, H1 and H4 timeframes. It indicates real market trend, support and resistance levels. In other words, it confirms trade directions. Scalpers especially,   Intraday, swing, intermediate and  long term traders will especially find this indicator useful. It uses customized show/hide buttons namely: "DRAW", "HILO", and "LEVEL" lines crossings and histograms ("AWOS" for Awesome Oscillator, "BUBE" for Bull Power and Bear Power & "GATO" for Gator Oscilla
Daily Candle Predictor é um indicador que prevê o preço de fechamento de uma vela. O indicador destina-se principalmente ao uso em gráficos D1. Este indicador é adequado tanto para negociação forex tradicional quanto para negociação de opções binárias. O indicador pode ser usado como um sistema de negociação autônomo ou pode atuar como um complemento ao seu sistema de negociação existente. Este indicador analisa a vela atual, calculando certos fatores de força dentro do próprio corpo da vela, be
The UNIVERSAL DASHBOARD indicator will eliminate the need of using dozens of indicators on dozens of charts. From one place you can monitor all the pairs and all the timeframes for each of the following indicators: MACD STOCHASTIC WPR RSI CCI You can also use any Custom indicator in the dashboard as long as it has a readable buffer. With a single click you can quickly navigate between charts, pairs and timeframes. Alerts will provide clear indication about what happens for your favorite pairs on
FREE
Olofofo Fx Scanner
Opengates Success International
Olofofo Fx Scanner is a Custom Indicator created to scan through the currency pair it is being attached to in the market on ALL time frames simultaneously from a Minute to Monthly looking for just 3 things that make Forex trading exciting and worthwhile to invest in. Once these are found, it alerts the User immediately for a timely action on the part of the Trader. This is a self-fulfilling prophecy of the market, meaning that even if you are a newbie, by the time you see the graphical display o
Rsi Aligator
Dmitriy Konogorov
The indicator do have inside two a tehnical its "RSI" and "Aligator" indicators with histogram for technical analysis of the market, currencies, currency pairs, precious metals and oil, and you can also analyze various cryptocurrencies such as Bitcoin and Ethereum. The indicator analyzes quotes and, based on their data, displays its icons on the chart for trading analysis. The indicator works very well, does not freeze and does not slow down even a weak processor in the computer, and is also no
O indicador de seta "Cool volumes" foi criado com base nos volumes de ticks na MT4. O próprio indicador rastreia em um determinado período de tempo (escolha do período de tempo) o número de volumes para comprar ou vender. E quando há um excesso anormal de volumes de vendedores ou compradores, ele emite um sinal de venda ou compra. Na janela inferior, Os gráficos de barras coloridos são desenhados, onde a cor verde mostra a predominância de compradores no momento, o que significa uma possível
Oscillator helps determine the direction of the market Shows the direction of the price movement and is painted in the appropriate color. Allows you to conduct trend and counter trend trading It works on all timeframes, on any currency pairs, metals and cryptocurrency Can be used when working with binary options Distinctive features Does not redraw; Simple and clear settings; It works on all timeframes and on all symbols; Suitable for trading currencies, metals, options and cryptocurrency (Bitco
HTF Candle Plus Timer Upgrade your trading experience with HTF Candle Plus Timer, a smart indicator that displays higher timeframe candles directly on your current chart. It allows you to stay aligned with the bigger market picture while focusing on your preferred trading timeframe. Key Features: Higher Timeframe Candles Plot custom higher timeframe (HTF) candles such as H1, H4, D1, W1, or MN directly on lower timeframe charts for a clearer market overview. Current Candle Timer A live countdown
Quantum DivDash — Multi-Indicator Divergence Dashboard for MetaTrader 4 Quantum DivDash is a technical analysis indicator for MetaTrader 4. It is designed to help traders detect and monitor regular and hidden divergences directly on the chart through a clean dashboard interface. The indicator analyzes price pivots and compares them with selected technical indicators to identify possible bullish and bearish divergence structures. It can work with several popular indicators, including MACD, MACD H
FREE
Os compradores deste produto também adquirem
Gann Made Easy
Oleg Rodin
4.83 (162)
Gann Made Easy é um sistema de negociação Forex profissional e fácil de usar, baseado nos melhores princípios de negociação usando a teoria do sr. W. D. Gann. O indicador fornece sinais precisos de COMPRA e VENDA, incluindo níveis de Stop Loss e Take Profit. Você pode negociar mesmo em movimento usando notificações PUSH. Entre em contato comigo após a compra para receber instruções de negociação e ótimos indicadores extras gratuitamente! Provavelmente você já ouviu muitas vezes sobre os métodos
M1 Sniper
Oleg Rodin
5 (22)
O M1 SNIPER é um sistema indicador de negociação fácil de usar. É um indicador de seta projetado para o período M1. O indicador pode ser usado como um sistema independente para scalping no período M1 e pode ser usado como parte do seu sistema de negociação existente. Embora este sistema de negociação tenha sido projetado especificamente para negociação no M1, ele também pode ser usado em outros períodos. Originalmente, desenvolvi este método para negociar XAUUSD e BTCUSD. Mas considero-o útil ta
Scalper Inside PRO
Alexey Minkov
4.74 (69)
Scalper Inside PRO – Since 2020. An exclusive indicator that utilizes an innovative algorithm to swiftly and accurately determine the market trend. The indicator automatically calculates opening, closing, and profit levels, providing detailed trading statistics. With these features, you can choose the most appropriate trading instrument for the current market conditions. Additionally, you can easily integrate your own arrow indicators into Scalper Inside Pro to quickly evaluate their statistics
O sistema PRO Renko é um sistema de negociação altamente preciso especialmente concebido para a negociação de gráficos RENKO. Trata-se de um sistema universal que pode ser aplicado a vários instrumentos de negociação. O sistema neutraliza eficazmente o chamado ruído de mercado, dando-lhe acesso a sinais de inversão precisos. O indicador é muito fácil de usar e tem apenas um parâmetro responsável pela geração de sinal. Você pode facilmente adaptar a ferramenta a qualquer instrumento de negocia
Auto Optimized Parabolic RSI: Avançado Motor de Momentum 3D A maioria dos indicadores de varejo falha porque depende de parâmetros estáticos que quebram no momento em que a volatilidade do mercado muda. O Auto Optimized Parabolic RSI resolve o problema de "obsolescência do indicador" recalculando continuamente a sua própria vantagem matemática, trazendo uma adaptação quantitativa de nível institucional diretamente para o seu terminal MT5. A Vantagem Principal: Otimização 3D em Memória Personaliz
Quantum Breakout Indicator PRO
Bogdan Ion Puscasu
4.96 (26)
Apresentando       Quantum Breakout PRO   , o inovador Indicador MQL5 que está transformando a maneira como você negocia Breakout Zones! Desenvolvido por uma equipe de traders experientes com experiência em negociação de mais de 13 anos,   o Quantum Breakout PRO   foi projetado para impulsionar sua jornada comercial a novos patamares com sua estratégia inovadora e dinâmica de zona de rompimento. O Quantum Breakout Indicator lhe dará setas de sinal em zonas de breakout com 5 zonas-alvo de lucro
Market Makers
Mohamed Hassan
5 (4)
After purchase, contact me privately to receive 1 month of free testing with EA Forex Proton! This advanced MT4 trading robot automatically executes signals from any MT4 indicator, including Market Makers. The latest version also includes AI integration, allowing each trade signal to be analyzed using Artificial Intelligence. Live Signal with EA Forex Proton: Click here Market Makers is a powerful price action trading system designed to identify high-probability Buy and Sell opportunities based
Apex Edge No Repaint Indicador de negociação profissional sem repintura para MT4 O Apex Edge No Repaint é uma ferramenta de negociação premium, clara e fiável, concebida para traders de forex e criptomoedas que procuram sinais claros e sem a frustração de setas que repintam. Principais Características: 100% Sem Repintura – Os sinais permanecem fixos assim que aparecem no gráfico Sistema de sinal duplo: sinais RAW para oportunidades iniciais e sinais CONF para entradas confirmadas de alta pro
Se você comprar este indicador, receberá meu Gerenciador de Operações Profissional   + EA  GRATUITAMENTE. Primeiramente, vale ressaltar que este Sistema de Trading é um Indicador Não Repintado, Não Redesenho e Não Atrasado, o que o torna ideal tanto para o trading manual quanto para o automatizado. Curso online, manual e download de predefinições. O "Sistema de Trading Inteligente MT5" é uma solução completa de trading projetada para traders novos e experientes. Ele combina mais de 10 indicador
Este indicador foi projetado para se integrar com a teoria das Ondas de Elliott, oferecendo dois métodos distintos de operação: Trabalho Automático: Nesse modo, o indicador opera autonomamente detectando todas as cinco ondas motrizes no gráfico de acordo com a teoria das Ondas de Elliott. Ele oferece previsões e identifica zonas potenciais de reversão. Além disso, possui a capacidade de gerar alertas e mensagens de push para notificar os traders sobre desenvolvimentos significativos. Essa funcio
PZ Harmonacci Patterns
PZ TRADING SLU
3.17 (6)
Este é sem dúvida o indicador de reconhecimento automático de formação de preço harmônico mais completo que você pode encontrar para a MetaTrader Platform. Ele detecta 19 padrões diferentes, leva as projeções de Fibonacci tão a sério quanto você, exibe a Zona de Reversão Potencial (PRZ) e encontra níveis adequados de stop loss e take-profit. [ Guia de instalação | Guia de atualização | Solução de problemas | FAQ | Todos os produtos ] Detecta 19 formações harmônicas de preços diferentes Traça
Please send me Direct message on MQL5 CHAT after purchasing the Indicator for Training and Installation Support There are some additional files that is important to use with the Indicator . So be sure to contact me after purchasing the Indicator So that I can add you for training and support . If you find any difficulty with installation then send me Direct message here So that I can connect with you via Anydesk or Teamview for the product installation. " Smart Order Block Indicator " to find m
Sinal de tendência GoldRush Arrow O indicador Sinal de tendência GoldRush Arrow fornece uma análise precisa e em tempo real das tendências, adaptada para scalpers de alta velocidade e curto prazo em XAU/USD. Criada especificamente para o intervalo de tempo de 1 minuto, esta ferramenta exibe setas direcionais para pontos de entrada claros, permitindo que os scalpers naveguem em condições de mercado voláteis com confiança. O indicador consiste em setas de alerta PRIMÁRIAS e SECUNDÁRIAS. Os sin
O indicador " Dynamic Scalper System " foi desenvolvido para o método de scalping, operando dentro de ondas de tendência. Testado nos principais pares de moedas e ouro, é possível a compatibilidade com outros instrumentos de negociação. Fornece sinais para a abertura de posições de curto prazo ao longo da tendência, com suporte adicional para o movimento dos preços. O princípio do indicador: As setas grandes determinam a direção da tendência. Um algoritmo para gerar sinais de scalping sob a fo
PZ Trend Trading
PZ TRADING SLU
4.8 (5)
O Trend Trading é um indicador projetado para lucrar o máximo possível com as tendências que ocorrem no mercado, cronometrando retrocessos e rupturas. Ele encontra oportunidades de negociação analisando o que o preço está fazendo durante as tendências estabelecidas. [ Guia de instalação | Guia de atualização | Solução de problemas | FAQ | Todos os produtos ] Negocie mercados financeiros com confiança e eficiência Lucre com as tendências estabelecidas sem ser chicoteado Reconhecer retrocessos
GOLD Impulse with Alert
Bernhard Schweigert
4.67 (12)
Este indicador é uma super combinação dos nossos 2 produtos Advanced Currency IMPULSE with ALERT  +   Currency Strength Exotics . Funciona para todos os períodos de tempo e mostra graficamente impulso de força ou fraqueza para as 8 principais moedas mais um Símbolo! Este Indicador é especializado para mostrar a aceleração da força da moeda para quaisquer símbolos como Ouro, Pares Exóticos, Commodities, Índices ou Futuros. É o primeiro do seu género, qualquer símbolo pode ser adicionado à 9ª
Advanced Supply Demand
Bernhard Schweigert
4.91 (300)
Atualmente com 40% de desconto! A melhor solução para qualquer Trader Novato ou especialista! Este indicador é uma ferramenta de negociação exclusiva, de alta qualidade e acessível porque incorporamos uma série de recursos proprietários e uma nova fórmula. Com esta atualização, você poderá mostrar fusos horários duplos. Você não só será capaz de mostrar um TF mais alto, mas também mostrar ambos, o TF do gráfico, MAIS o TF mais alto: MOSTRANDO ZONAS ANINHADAS. Todos os traders de Oferta e Demanda
Gold Scalper Super
Aleksandr Makarov
5 (2)
Gold Scalper Super is an easy-to-use trading system. The indicator can be used as a standalone scalping system on the M1 time frame, as well as part of your existing trading system. Bonus: when purchasing an indicator, Trend Arrow Super is provided free of charge, write to us after purchase. The indicator 100% does not repaint!!! If a signal appears, it does not disappear! Unlike indicators with redrawing, which lead to the loss of a deposit, because they can show a signal and then remove it.
CRT Candle Range Theory HTF MT4.   Ultimate CRT Indicator: Advanced ICT Concepts and Malaysian SnR Trading System Discounted   Price   $50  !!     Secure your lifetime access   now   before it switches to   subscription-only ! Master the Market Maker's Footprints with the Most Advanced Candle Range Theory Indicator Unlock the true power of   Smart Money Concepts (SMC)   and trade precisely like the institutions with the   Ultimate CRT Indicator . Built exclusively for serious traders, this indic
Este indicador examina a estrutura de preços de fractais de diferentes períodos para determinar possíveis pontos de reversão no mercado, proporcionando tempo aos traders posicionais que já possuem um modelo de avaliação fundamental ou técnico. Diferentemente de seu irmão mais novo, Reversal Fractals , esse indicador não perde reversões por causa do período selecionado e encontra fractais de reversão em zigue-zague, ignorando as reversões que não possuem impulso suficiente para iniciar um movime
PZ Support Resistance
PZ TRADING SLU
3.33 (3)
Cansado de traçar linhas de suporte e resistência? A Resistência de suporte é um indicador de período múltiplo que detecta e plota automaticamente linhas de suporte e resistência no gráfico com um toque muito interessante: conforme os níveis de preços são testados ao longo do tempo e sua importância aumenta, as linhas se tornam mais espessas e mais escuras. [ Guia de instalação | Guia de atualização | Solução de problemas | FAQ | Todos os produtos ] Melhore sua análise técnica da noite para o d
They say history repeats itself. What if you could prove it in real-time? The Propfolio Ghost Pattern is an advanced algorithmic pattern-matching engine. It empowers you to select any current price action structure on your chart and instantly scan thousands of historical candles to find the exact moment in the past where the market did the exact same thing. Once it finds the highest probability match, it projects the historical outcome into the future as "Ghost Candles"—giving you a highly calcu
ACTUALMENTE COM 26% DE DESCONTO!! Este indicador é uma super combinação dos nossos dois principais indicadores ( Advanced Currency Strength 28   &  Advanced Currency IMPULSE with ALERT ). Mostra valores de Força da Moeda para TICK-UNITS e sinais de alerta para 28 pares de Forex. Podem ser usadas 11 Tick-Units diferentes. Estas são 1, 2, 3, 4, 5, 6, 10, 12, 15, 20, e 30 segundos. A barra de Tick-Unit na sub-janela será mostrada e deslocada para a esquerda quando houver pelo menos 1 tick dentro
Atomic Analyst
Issam Kassas
5 (5)
Primeiramente, vale ressaltar que este Indicador de Negociação não repinta, não redesenha e não apresenta atrasos, tornando-o ideal tanto para negociação manual quanto automatizada. Manual do utilizador: configurações, entradas e estratégia. O Analista Atômico é um Indicador de Ação de Preço PA que utiliza a força e o momentum do preço para encontrar uma vantagem melhor no mercado. Equipado com filtros avançados que ajudam a remover ruídos e sinais falsos, e aumentam o potencial de negociação.
Entre em contato comigo após a compra para obter um EA de bônus baseado neste indicador. A Self Optimizing Double MA Strategy é uma ferramenta de trading de nível profissional projetada para eliminar a adivinhação na escolha de parâmetros. Impulsionada por um motor de auto-otimização integrado, adapta-se continuamente às mudanças nas condições do mercado, simulando milhares de combinações de parâmetros em segundo plano para manter uma vantagem estatística. Em vez de depender de configurações es
ACTUALMENTE COM 40% DE DESCONTO A melhor solução para qualquer novato ou comerciante especializado! Este Indicador é uma ferramenta comercial única, de alta qualidade e acessível, porque incorporámos uma série de características proprietárias e uma nova fórmula. Com apenas UM gráfico, pode ler a força da moeda para 28 pares de Forex! Imagine como a sua negociação irá melhorar porque é capaz de apontar o ponto exacto do gatilho de uma nova tendência ou oportunidade de escalada? Manual do util
Um indicador técnico que estrutura gráficos e identifica movimentos cíclicos de preços. Pode funcionar em qualquer gráfico. Vários tipos de notificações. Existem setas adicionais no próprio gráfico. Sem redesenhar a história, trabalha no fecho da vela. TF recomendado a partir de M5 e superior. Parâmetros fáceis de utilizar e configurar. Ao utilizar 2 indicadores com parâmetros diferentes, pode utilizá-los sem outros indicadores. Tem 2 parâmetros de entrada Ciclicidade e duração do sinal Estes
KuKl
IGOR KIRIANEN
The indicator is built on a non-standard Zig Zag, it draws accumulations after which if the price leaves this zone and a test of this zone occurs, then a sound signal is given and an arrow appears - after the test candle closes.The indicator does not redraw its signals, it is very easy to use, there are only three settings 1- this is the zig zag parameter 2- this is the minimum price exit from the zone 3- this is the maximum price exit from the zone. The lower the parameter for Zig Zag, the more
Day Trader Master é um sistema de negociação completo para day traders. O sistema é composto por dois indicadores. Um indicador é um sinal de seta para comprar e vender. É o indicador de seta que você obtém. Eu fornecerei o segundo indicador gratuitamente. O segundo indicador é um indicador de tendência especialmente projetado para ser usado em conjunto com essas setas. OS INDICADORES NÃO SE REPETEM E NÃO SE ATRASAM! A utilização deste sistema é muito simples. Você só precisa seguir os sinais de
ZigZag Lines MTF
Taras Slobodyanik
4.38 (13)
Indicador ZigZag de vários períodos de tempo. Ele exibe as linhas horizontais de suporte/resistência e seus rompimentos, bem como desenha as metas atuais do mercado. Também pode exibir linhas do indicador Fractais e velas de outros períodos (até Trimestral). Indicador – conecta máximas e mínimas importantes para mostrar linhas de tendência. O indicador redesenha o último ponto (atual) e, em alguns casos, pode alterar os últimos 2-3 pontos. Todas as linhas são desenhadas como objetos ( não buf
Mais do autor
This indicator is designed for M1 timeframe and shows: Sum of points when the price goes up (Green Histogram). Sum of points when the price goes down (Red Histogram).  In other words, by the number and ratio of bullish points to bearish ones, you can do a technical analysis of the state of the market. If the green histogram prevails over the red one, you can conclude that at the moment the buyers are stronger than the sellers, and vice versa, if the red histogram prevails over the green, the se
This Multi TimeFrame indicator is based on the "Fractals" classical indicator. 2 Inputs: TimeFrame1; TimeFrame2; You can put any available TimeFrame values (from M1 (Period_M1) to MN1 (Period_MN1)) equal or greater ( >= ) than the Period of the current Time Frame. The last Fractals will shown as color lines (Dots Line) of Support and Resistance for the Price moving.
When you put this Multi TimeFrame Parabolic SAR indicator on the chart it will automatically use Parabolic SAR from next available 3 timeframes. Green arrow will show the beginning of Up trend and Red arrow will show the beginning of Down trend. If AlertsEnabled = true, the indicator will show the Alert (message window) with a text like this: "Price going Down on ", Symbol(), " - ", Period(), " min", " price = ", Bid; If eMailEnabled = true the Indicator will send you an eMail with the same text
The zero line is characterized the Flat trend. V-shaped impulse indicates the entrance to the opposite direction. U-shaped impulse = entry orders in the same direction. If AlertsEnabled = true, the indicator will show the Alert (message window) with a text like this: "Price going Down on ", Symbol(), " - ", Period(), " min", " price = ", Bid; If eMailEnabled = true the indicator will send you an eMail with the same text an Alert message with subject: "Trinity-Impolse" (of course you have to chec
The indicator displays the usual Moving Average with input parameters: maPeriod_1; maMethod_1; maAppPrice_1. Then it calculates and displays MA on MA1 with input parameters: maPeriod_2; maMethod_2. Then it calculates and displays MA on MA2 with input parameters: maPeriod_3; maMethod_3. If AlertsEnabled = true the Indicator will show the Alert (message window) with a text like this: "Price going Down on ", Symbol(), " - ", Period(), " min", " price = ", Bid; If eMailEnabled = true the Indicator w
Multi TimeFrame Indicator "MTF CCI Trigger" based on the Commodity Channel Index from the upper TF (input parameter "TimeFrame") yellow line. Aqua line is representing ATR envelopes from the current TF. Green and Red arrows is triggered by CCI and represented UP and DOWN trends accordingly.
The BBImpulse indicator is based on the standard Moving Average indicator. You have MA input parameters: maPeriod - Moving Average period; maMODE - Moving Average mode (0 = MODE_SMA; 1 = MODE_EMA; 2 = MODE_SMMA; 3 = MODE_LWMA); maPRICE - Applied price (0=PRICE_CLOSE; 1=PRICE_OPEN; 2=PRICE_HIGH; 3=PRICE_LOW; 4=PRICE_MEDIAN; 5=PRICE_TYPICAL; 6=PRICE_WEIGHTED). Green Histogram is representing an UP-trend, Red Histogram is representing a Down-trend.
Multi TimeFrame indicator MTF ADX with Histogram shows ADX indicator data from the TF by your choice. You may choose a TimeFrame equal or greater than current TF. Yellow line is representing a price trend from the upper TF. Green line is representing +DI from the upper TF. Red line is representing -DI from the upper TF. Green histogram is displaying an Up-trend. Red histogram is displaying a Down-trend.
This Indicator creates 2 white lines based on Exponential Moving Averag e of High and Low prices. You can regulate how many bars will be involved in the calculation with input parameter HL_Period. Red and Blue arrows are displaying the moment to go Short and Long trades accordingly.
The most common way to interpreting the price Moving Average is to compare its dynamics to the price action. When the instrument price rises above its Moving Average, a buy signal appears, if the price falls below its moving average, what we have is a sell signal. To avoid a spontaneous entries one may use this update from Moving Average Indicator = Stepper-MA.
Envelopes technical Indicator is formed with two Moving Averages one of which is shifted upward and another one is shifted downward. Envelopes define the upper and the lower margins of the price range. Signal to sell appears when the price reaches the upper margin of the band; signal to buy appears when the price reaches the lower margin. To avoid a spontaneous entries one may use this update from Envelopes Indicator = Envelopes-Stepper.
The interpretation of the Bollinger Bands is based on the fact that the prices tend to remain in between the top and the bottom line of the bands. Abrupt changes in prices tend to happen after the band has contracted due to decrease of volatility; If prices break through the upper band, a continuation of the current trend is to be expected; If the pikes and hollows outside the band are followed by pikes and hollows inside the band, a reverse of trend may occur; The price movement that has starte
Fibonacci sequence is defined by integer sequence: 0, 1, 1, 2, 3, 5, 8, 13, 34, 55, 89, 144, ... By definition, it starts from 0 and 1, the next number is calculated as a sum of two previous numbers. Instead of the standard moving average, the indicator uses the caluclation of average price in form: Bar0 + Bar1 + Bar2 + Bar3 + Bar5 + Bar8 + Bar13 +... Input parameters:  FiboNumPeriod (15) - Fibonacci period; nAppliedPrice (0) - applied price (PRICE_CLOSE=0; PRICE_OPEN=1; PRICE_HIGH=2; PRICE_LOW=
This indicator present a main Moving Average line with input parameters maPeriod_1, maMethod_1 and maAppPrice_1. The second line will be a calculation of the Moving Average data of a first line with input parameters maPeriod_2, maMethod_2. The third line will be a calculation of the Moving Average data of a second line with input parameters maPeriod_3, maMethod_3. To avoid a spontaneous entries one may use this indicator-stepper.
This indicator (as almost all others) is based on classical Moving Averages. It shows the Average Bar under the current bar colored in aqua or over the current bar colored in orange. Input Parameters: ma_Period and ma_Method. The Average Bar maybe helpful to predict where the price will move in the nearest future. Of course, this "near future" depends of the current time frame.
Buy when the market is falling and sell when the market is rising. When the market is moving down you start observing and looking for buy signals. When the market is moving up you start looking for sell signals. This indicator points to the moments to Buy (Blue arrow) and to Sell (Orange arrow). Two input parameters: barsNumber and step for optimization (depending on symbol and Time Frame).
This indicator shows: A green light in case the price goes up; A red light in case the price goes down; A yellow light in case there are a sideways trend. A sideways trend is the horizontal price movement that occurs when the forces of supply and demand are nearly equal. This typically occurs during a period of consolidation before the price continues a prior trend or reverses into a new trend
This indicator is created for M1 timeframe. It shows how many ticks has occurred during current minute and ( after the slash) the sum of points Up (aqua color) and Down (orange color). In times of a high trading activity a grow up number of ticks Up and Down will signal of a big move of the price in the near future. In times of a high trading activity a grow up number of sum of points Up and Down will signal of a big move of the price in the near future too.
Two yellow lines. This is similar to classical Envelopes but with automatic deviation. The Envelopes indicator is   a tool that attempts to identify the upper and lower bands of a trading range. Aqua line. This is a classical Commodity Channel Index added to the Envelopes on the chart, not in a separate window. The Commodity Channel Index ( CCI ) is a technical   indicator   that measures the difference between the current price and the historical average price.
Probability deals with the likelihood of an event happening.   Forex   probability indicates a possibility at a specific time. This is because the forex market is highly volatile, and predicting future events affecting it is impossible. This indicator will show a positive number above the current High or negative number under the current Low as a probability of the trend. Higher time frames usually show a higher probability, even more then 100%.
Envelopes is an excellent indicator when the market is trending. Open Long position when the ClosePrice crossed the upper Aqua band. Close Long position when the Price crossed the upper Yellow band moving down. Open Short position when the ClosePrice crossed the lower Aqua band. Close Short position when the Price crossed the lower Yellow band moving up.
Moving Average Bars is a self-explanatory indicator with one input parameter: nPeriod. When the previous Price Close is above the previous indicator Bar, the probability to go Long is very high.   When the previous Price Close is under the previous indicator Bar, the probability to go Short is very high.
This indicator is based on the same idea as https://www.mql5.com/en/market/product/2406 , but instead of Average Bars it uses series or Fibonacci sequence. When the previous Price Close is above the previous indicator Bar, the probability to go Long is very high. When the previous Price Close is under the previous indicator Bar, the probability to go Short is very high.
This indicator is based on two ideas: Correlations between 5 main currency pairs: EURUSD, GBPUSD, USDCHF, USDJPY, USDCAD; US Dollar Index = the value of the United States dollar relative to a basket of foreign currencies. The use of the indicator is the same as classical  Commodity Channel Index  (CCI) indicator. CCI is calculated with the following formula:  (Typical Price - Simple Moving Average) / (0.015 x Mean Deviation) (Typical Price - Simple Moving Average) / (0.015 x Mean Deviation)
A  tick  is a measure of the minimum upward or downward movement in the  price  of a security. A  tick  can also refer to the change in the  price  of a security from one trade to the next trade.  This indicator will show amounts of ticks when the price goes up and down. This indicator is designed for M1 time frame and shows: Sum of points when the price goes up (Green Histogram). Sum of points when the price goes down (Red Histogram). 
This indicator is a combination of 2 classical indicators MA and RVI. The Relative Vigor Index (RVI) is a momentum indicator used in technical analysis that measures the strength of a trend by comparing a security's closing price to its trading range while smoothing the results using a simple moving average   The input parameter  counted_bars  determines how many bars the indicator's lines will be visible. The input parameter MaRviPeriod  is used for MA and RVI calculation.
This indicator is a combination of 2 classical indicators: MA and Force Index. The input parameter  counted_bars  determines on how many bars the indicator lines will be visible. The input parameter  MaForcePeriod  is used for MA and Force calculation. You may go Long if the current price crossed Up the Ribbon (HISTOGRAM)  and you may go Short if the current price crossed Down the Ribbon (HISTOGRAM)
This indicator is a combination of 2 classical indicators: MA and CCI. Two moving averages form Upper and Lower bands. The input parameter  counted_bars  determines on how many bars the indicator's lines will be visible. The input parameter  barsNum  is used for MA and CCI calculation.
This indicator is using 2 classical indicators: Commodity Channel Index from the higher TF (which you may change using input parameter TimeFrame ) and Average True Range from the current TF. The Green ribbon indicates the upper trend and the Red ribbon indicates the down trend. Buy when the Yellow line crosses the Upper bound (Aqua line). Sell when the Yellow line crossover the Lower bound (Aqua line).
This is a self-explanatory indicator - do nothing when the current price in the "fence" (flat) mode. Definition of a flat market: A market price that is neither Up nor Down. The input parameter  counted_bars  determines on how many bars the indicator's lines will be visible starting from the current Bar backward. The input parameter  barsNum  is used as a Period for aqua "fence" calculation.
Filtro:
Sem comentários
Responder ao comentário