DYJ Trend analyst MT5
- Indicadores
-
Daying Cao
 Olá! Eu sou um engenheiro de software tem vindo a desenvolver durante muitos years.have seu próprio sistema de negociação exclusivo, tem uma riqueza de EA experiência comercial. A moeda principal é EUR / USD, GBP / USD. USD / JPY, AUD / USD, USD / CAD, ouro, EUR / NZD moeda cruzada. EA correndo para
 - Versão: 1.52
- Atualizado: 7 novembro 2019
- Ativações: 5
Dynamic Market Insights for Smart Trading
Our goal is to provide seamless, high-quality services that empower market participants, traders, and analysts with real-time market insights and key indicators for informed decision-making.
Advanced & User-Friendly Trend Analysis
This is a cutting-edge, highly robust, and easy-to-use dynamic trend analysis indicator.
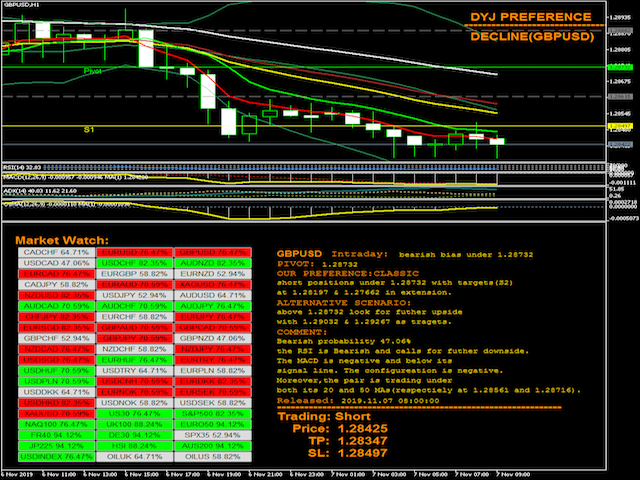
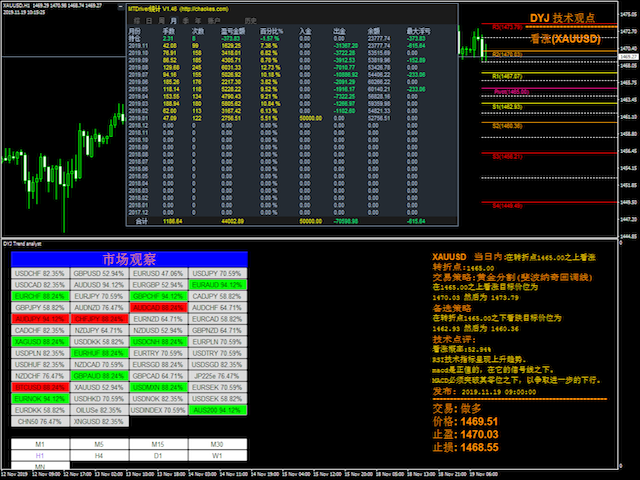
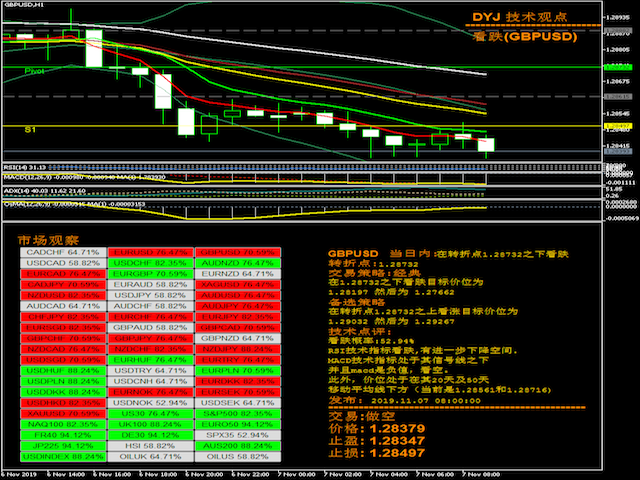
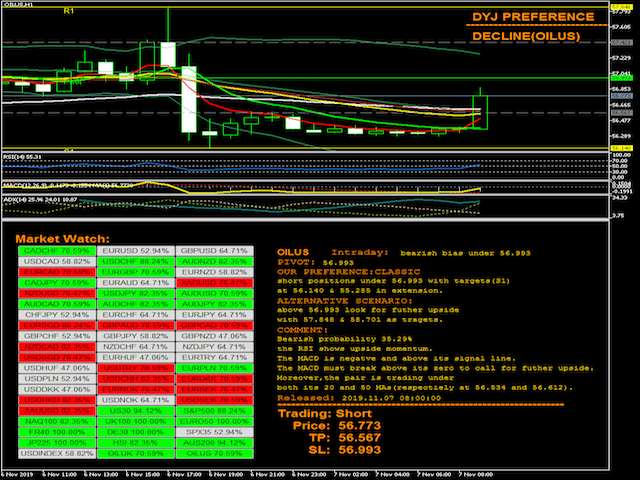
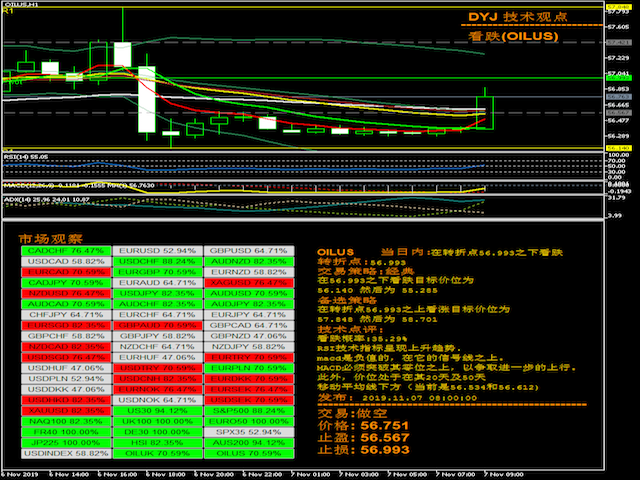
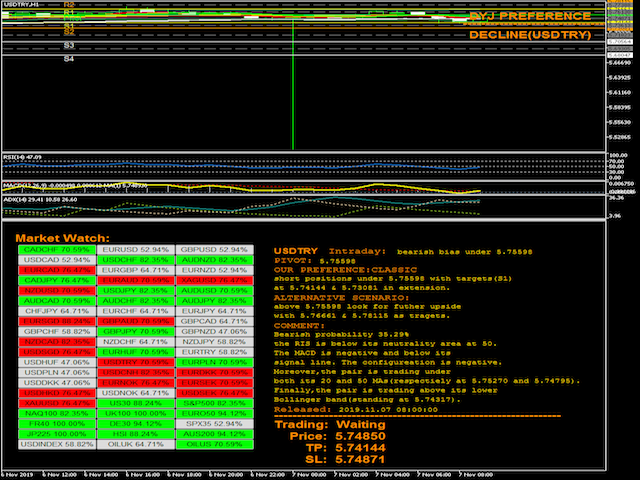
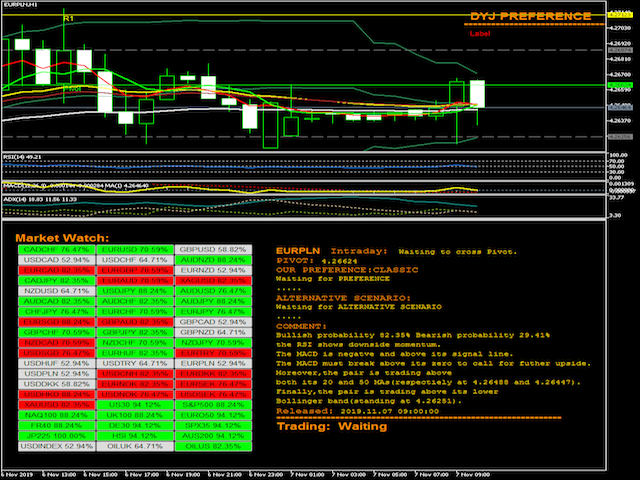
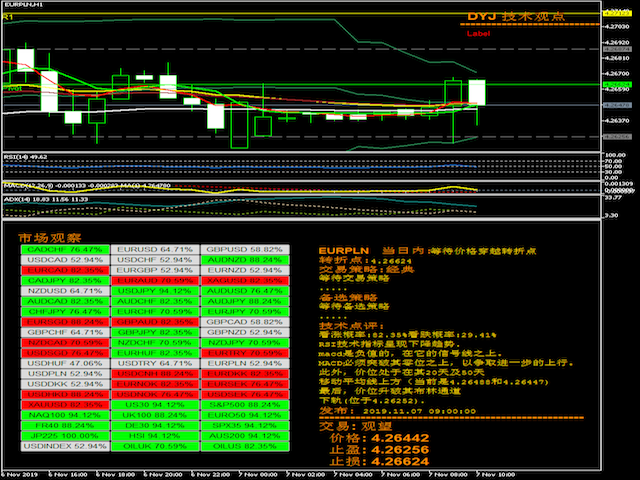
The DYJ Market Watch Indicator evaluates market bullish and bearish strength using two distinct methods—each designed to measure different aspects of market sentiment.
- TheBearish Index assesses the market's strength in a downward trend.
- TheBullish Index gauges the market's strength in an upward trend.
Pivot Indicator: A Smart Trading Edge
An additional feature of the Market Watch Indicator is Pivot, which includes six strategies:
Classic, Camarilla, Invincible, Fibonacci, Grid Layout, and Golden Ratio.
To enhance accuracy, Pivot integrates multiple auxiliary indicators such as RSI, MACD, MA, Bollinger Bands,and more to filter out false signals.
Unparalleled Market Predictions
OurPivot Indicator, powered by advanced algorithms, calculates pivot points, support, and resistance levels with remarkable precision.
It provides incredibly accurate predictions of key future price levels and potential market reversals.
Versatile & Universal
This indicator is suitable for all markets—including Forex, commodities, stocks, indices, and more—across all timeframes.
Features
- Monitors all pairs at the same time.
- The indicator monitors the MaekingWatch pairs by default.
- It runs only from a graph (M1 to MN).
Parameter:
- InpLanguage = English -- English or Chinese
- InpEntryPercent = Min_70 -- Trend percentage requirements 70% or more.
- Wait_Mins_For_Next_Signal = 30 -- The next signal occurs 30 minutes later
- InpMaxCol = 5 -- Buttons in a horizontal column
Notes:
- Please download the template attachment(DYJ Trend analyst for MT5.tpl) in the comments.