DYJ Trend analyst MT5
- Indicadores
-
Daying Cao
 ¡Hola! Soy un ingeniero de software ha estado desarrollando durante muchos years.have su propio sistema de comercio único, tiene una riqueza de EA experiencia comercial. La moneda principal es EUR / USD, GBP / USD. USD / JPY, AUD / USD, USD / CAD, oro, EUR / NZD moneda cruzada. EA corriendo para
 - Versión: 1.52
- Actualizado: 7 noviembre 2019
- Activaciones: 5
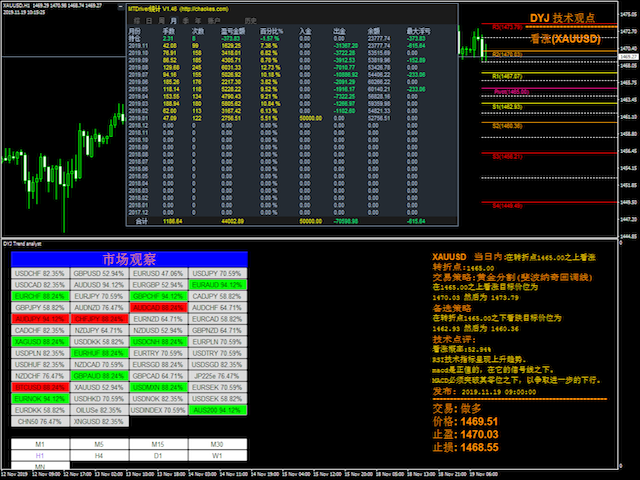
Información dinámica sobre el mercado para una negociación inteligente
Nuestro objetivo es ofrecer servicios fluidos y de alta calidad que proporcionen a los participantes en el mercado, operadores y analistas información sobre el mercado en tiempo real e indicadores clave para una toma de decisiones informada.
Análisis de tendencias avanzado y fácil de usar
Se trata de un indicador dinámico de análisis de tendencias de última generación, muy sólido y fácil de usar.
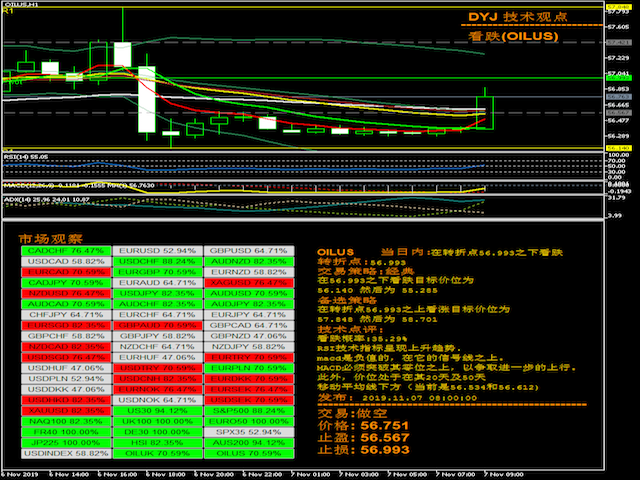
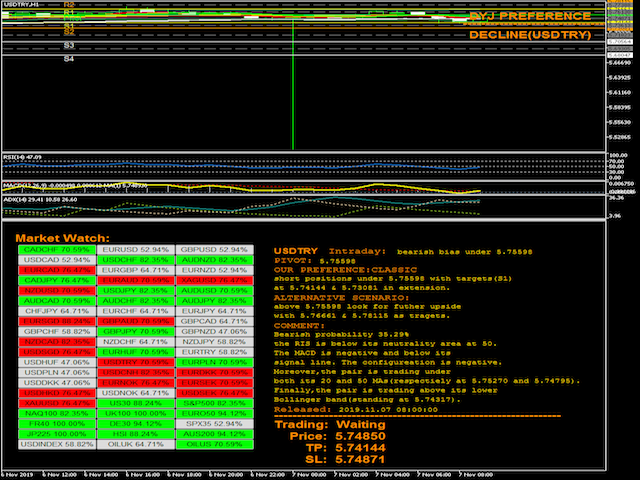
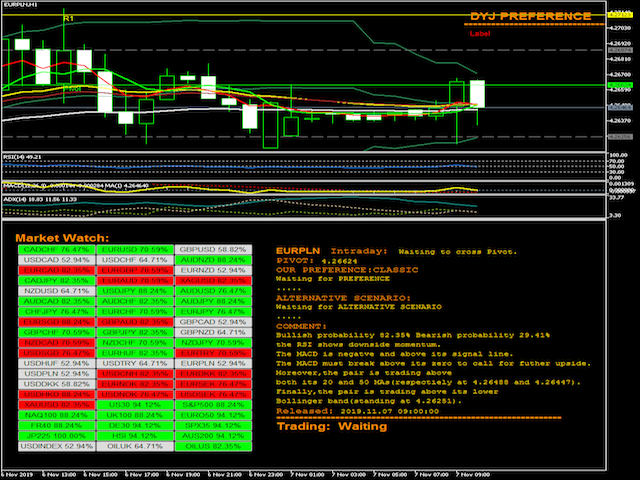
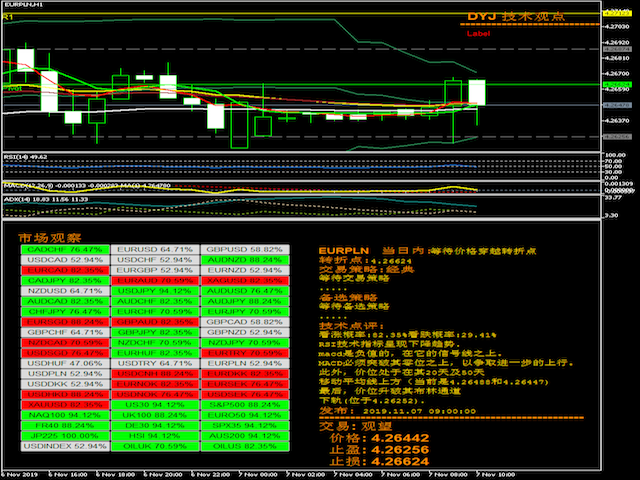
El indicador DYJ Market Watch evalúa la fortaleza alcista y bajista del mercado utilizando dos métodos distintos, cada uno diseñado para medir diferentes aspectos del sentimiento del mercado.
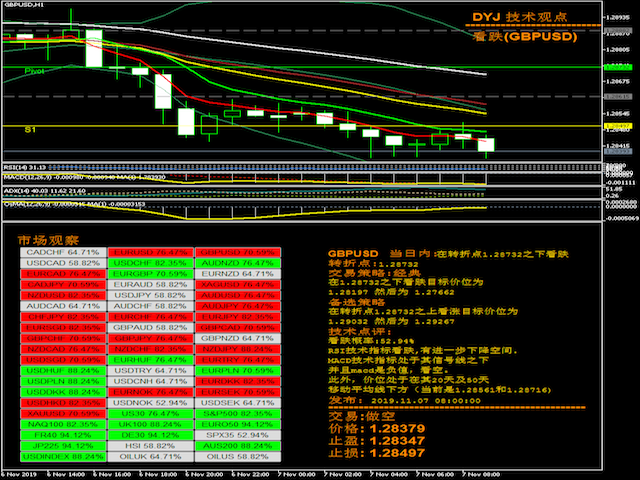
- ElÍndiceBearish evalúa la fortaleza del mercado en una tendencia bajista.
- ElBullishIndex evalúa la fortaleza del mercado en una tendencia alcista.
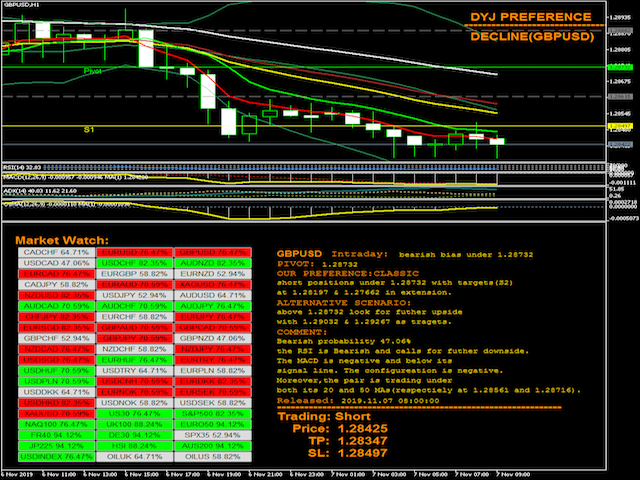
Indicador Pivot: Una ventaja para operar con inteligencia
Una función adicional del indicador Market Watch es Pivot, que incluye seis estrategias:
Classic, Camarilla, Invincible, Fibonacci, Grid Layout y Golden Ratio.
Para mejorar la precisión, Pivot integra múltiples indicadores auxiliares como RSI, MACD, MA, Bandas de Bollinger, etc. para filtrar las señales falsas.
Predicciones de mercado sin precedentes
Nuestroindicador Pivot, basado en algoritmos avanzados, calcula los puntos de pivote y los niveles de soporte y resistencia con una precisión extraordinaria.
Proporciona predicciones increíblemente precisas de los niveles de precios futuros clave y de los posibles retrocesos del mercado.
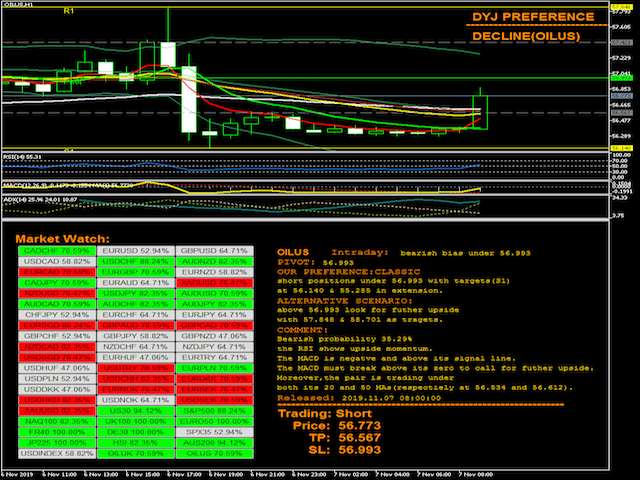
Versátil y Universal
Este indicador es adecuado para todos los mercados, incluyendo Forex, materias primas, acciones, índices y más, en todos los marcos de tiempo.
Características
- Monitoriza todos los pares al mismo tiempo.
- El indicador monitorea los pares MaekingWatch por defecto.
- Se ejecuta sólo desde un gráfico (M1 a MN).
Parámetros:
- InpLanguage = English -- Inglés o Chino
- InpEntryPercent = Min_70 -- Requisitos de porcentaje de tendencia 70% o más.
- Wait_Mins_For_Next_Signal = 30 -- La siguiente señal se produce 30 minutos después
- InpMaxCol = 5 -- Botones en una columna horizontal
Notas:
- Por favor, descargue la plantilla adjunta(DYJ Trend analyst for MT5.tpl) en los comentarios.