Fibonacci Expansion and Retracement For 5
- Indicadores
- Versão: 1.4
- Ativações: 5

Fibonacci Expansion and Retracement PRO
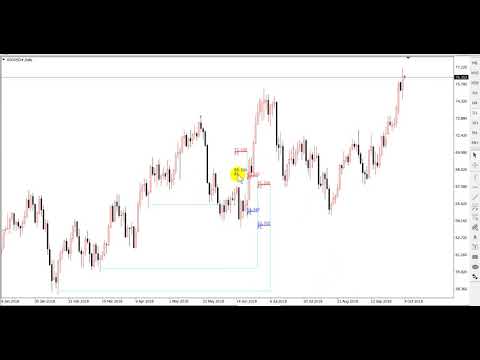
Fibonacci retracing and extended line tools for the MT5 platform, ideal for traders who use the Golden Section trading
The main function:
1. You can draw multiple sets of Fibonacci retracements directly, and the relationship between important return points is clear at a glance.
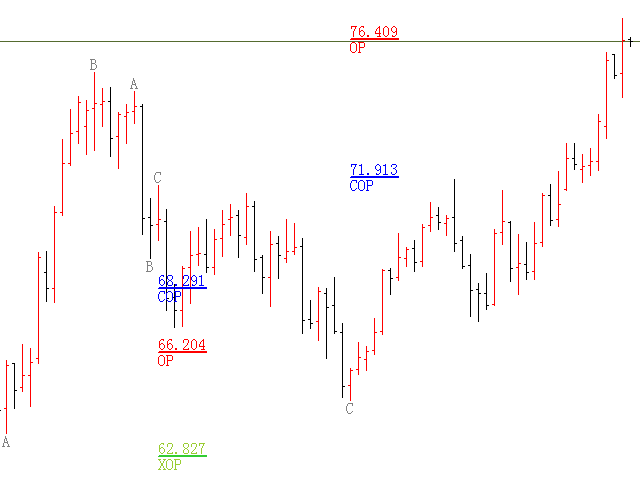
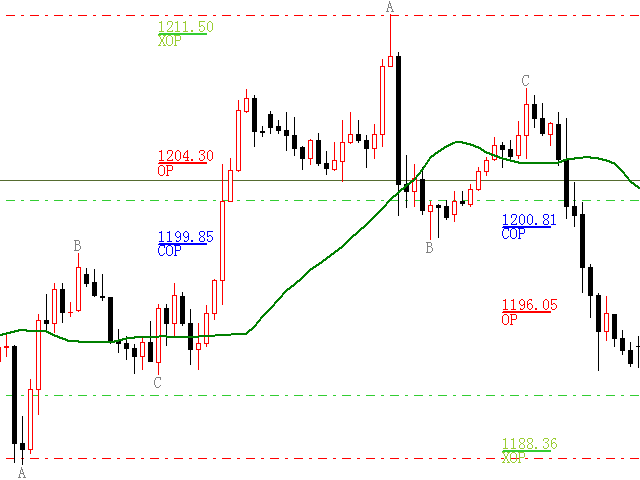
2. Can draw Fibonacci extensions
3. The Fibonacci foldback and extension of the line can be moved left and right for easy observation and numerical display.
4. The chart shows very refreshing
5. The cycle can be switched by the number keys
Function key:
1. Press [Draw Back, draw on demand, fold up to 8 groups
2. Press ] to draw extension
3. Press \ to delete all extensions and folds under the current cycle
4. Move, delete foldbacks and expand
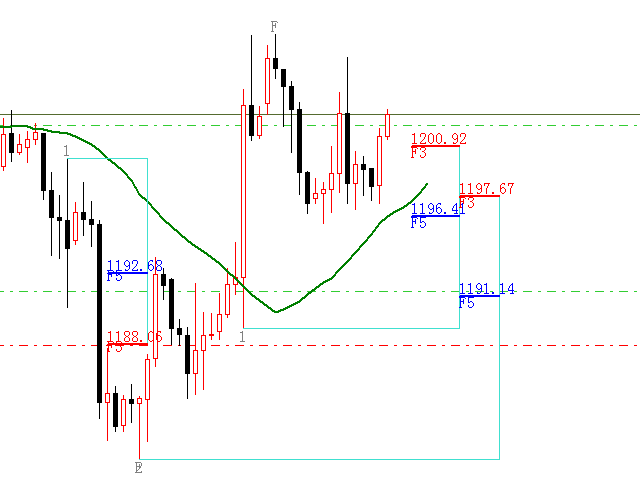
(1) Click on the F5 line of the first set of foldbacks.
Click once (turns yellow) and press Delete on the keyboard to delete the focus of the focus.
Click 2 times (restore color) to move back to the appropriate position
(2) Click on the line of COP
Click once (turns yellow), press DELETE on the keyboard to turn the group back
Click 2 times (restore color) to move to the appropriate location
5. Modify the foldback and extension:
(1) Select the focus F or the rebound point number (F or the rebound point font becomes larger and turns yellow) and move the mouse.
(2) Select one of the three ABC points (the font becomes larger and turns yellow) and move the mouse.