EFW Pattern Trader MT4
- Indicadores
-
Young Ho Seo
 Harmonic Pattern Indicator - Repainting + Japanese Candlestick Pattern Scanner + Automatic Channel + Many more
https://www.mql5.com/en/market/product/4488 - Versão: 5.6
- Atualizado: 2 março 2022
- Ativações: 5
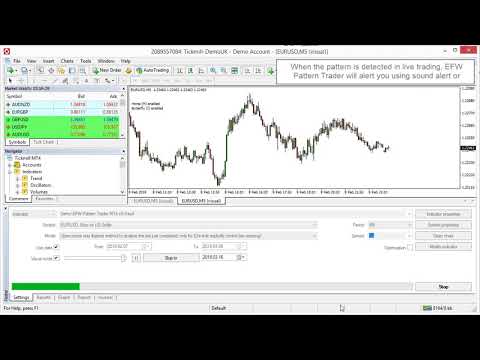
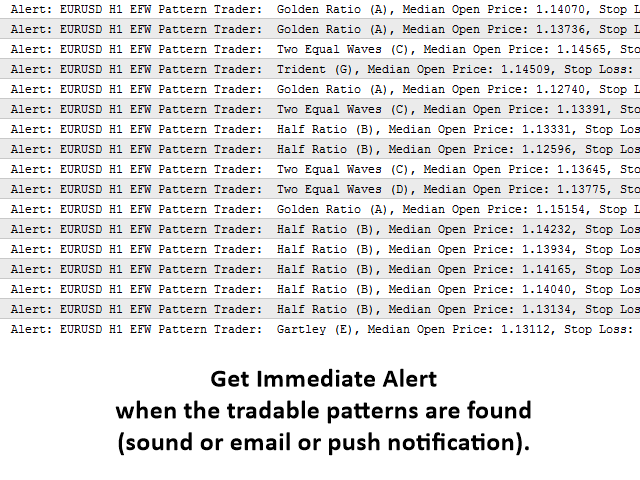
EFW Pattern Trader is a powerful pattern scanner for Forex and Stock trading. The pattern detection in EFW Pattern Trader uses the Fractal Wave Theory, which captures the endless up and down movement of the market. Therefore, EFW Pattern Trader can be considered as the robust price action indicator. Any patterns in EFW Pattern Trader can be backtested visually in your strategy tester. Visual backtesting with pattern will show you how pattern will likely behave in the live trading. Therefore, you can build the rational and confidence before your trading. Each pattern will generate different performance for different market. Therefore, run each pattern in your strategy tester and then choose which patterns you want to trade for the specific currency pairs to maximize your profit. Of course, you can trade multiple patterns for single currency pairs. You can use sound alert, push notification and email (Push notification is preferred way for remote signal.). After backtesting, to synchronize your backtesting results to your live accounts, use EFE Pattern Trader for your live trading only.
How to Trade
In general, each detected pattern will show you which direction to trade. Therefore, trading is really simple. Using this software requires at least some knowledge on risk and reward management in the financial trading. Check the performance of each pattern with your own eyes in your MetaTrader strategy tester before buying. Typically the pattern traders uses second confirmation to confirm the trading direction with patterns. The typical second confirmation can include fundametals and other technical indicators.
For your information, tradable Patterns in EFW Pattern Trader:
- are not repainting
- are not recalculating
- provide stop loss and take profit target for your trading.
List of Tradable Patterns
All the patterns are powerful here but you might like some patterns more than the others might. Do not forget to backtest each pattern before trading. Backtesting will run faster in smaller timeframe when you use every tick mode. You might use open price mode at your own risk.
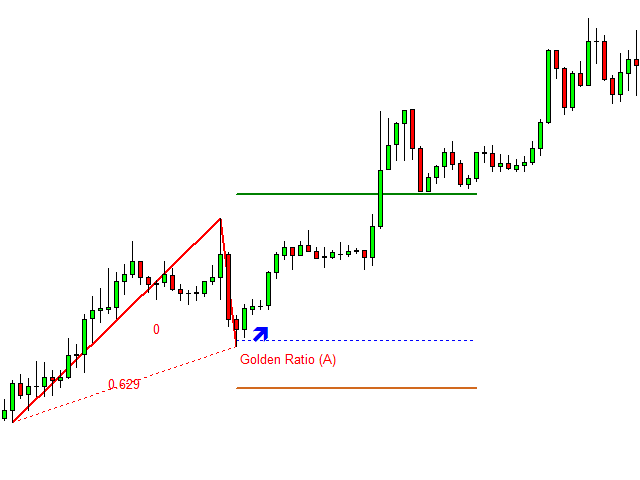
A. Golden Ratio 0.618 (1 EFW)
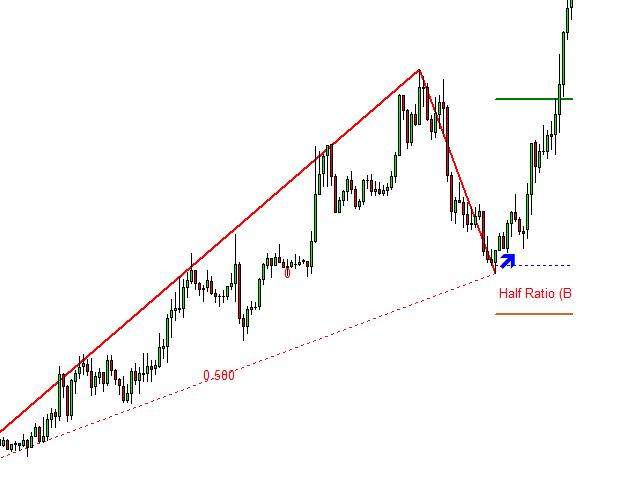
B. Half Ratio 0.500 (1 EFW)
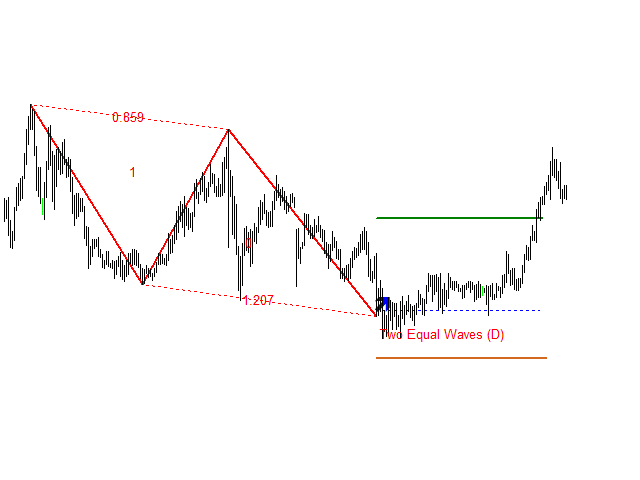
C. Two Equal Waves Pattern (2 EFWs: 1.618-0.618)
D. Two Equal Waves Pattern (2 EFWs: 1.272-0.786)
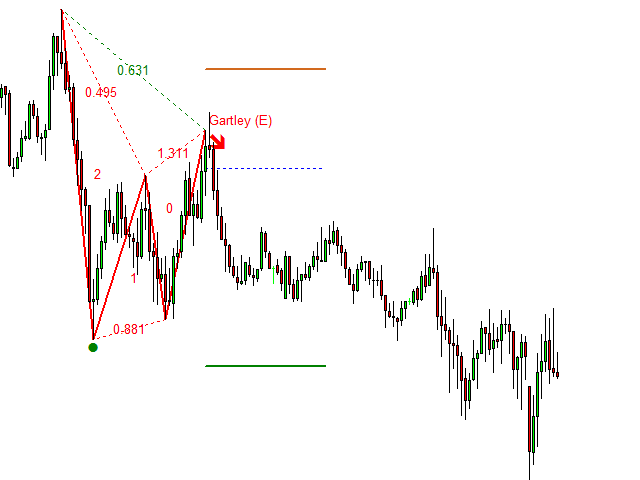
E. Gartley (3 EFWs)
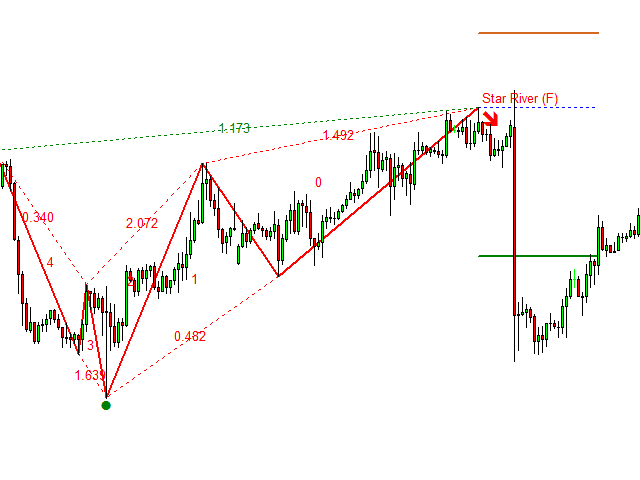
F. Star River Pattern (5 EFWs, introduced by Young Ho, Seo)
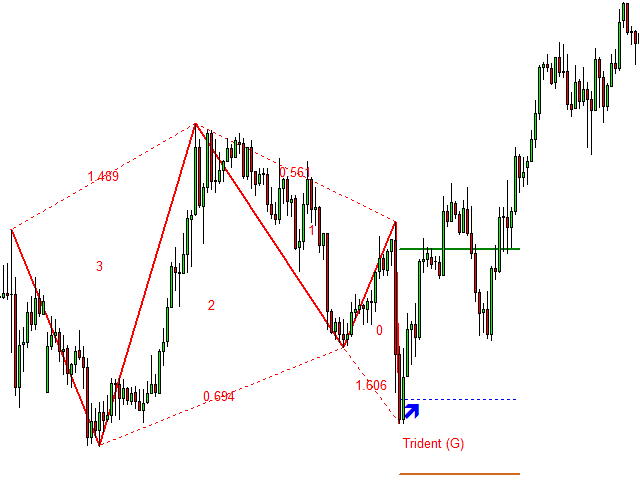
G. Trident Pattern (4 EFWs, introduced by Young Ho, Seo)
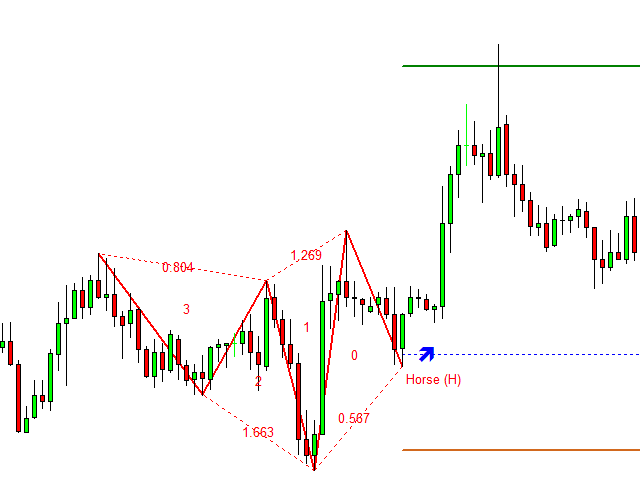
H. Horse Pattern (4 EFWs, introduced by Young Ho, Seo)
I. Butterfly (3 EFWs)
Input 1 - EFW Setting
- EFW Iteration: 3 to 100 only (choose higher number for more patterns but it requires more time to complete backtesting)
- EFW Line Color: Color of wave lines
- EFW Line Color for overlapping wave: Color of overlapping wave lines
- EFW Line Width: Width of wave line
- EFW Text Color: color for ratio text
- EFW Text Size: Size of text
- EFW Ratio Text Format: Ratio format to display
- EFW Arrow Up Color: Buy arrow color
- EFW Arrow Down Color: Sell arrow color
- EFW Arrow Width: buy and sell arrow size
Input 2 - General Setting
- Bars To Scan: choose higher number for more computation
- Use White Background Chart: true or false only
- Enable sound alert: true or false only
- Send email Alert
- Send notification alert
Input 3 - Alert Setting
- Delete Previous Patterns on new alert: set true to delete previous patterns on new pattern arrival
- Min Pattern Size in Bar: filter the pattern by number of candle bar size
- Search Pattern A: set to true to use the pattern A
- Search Pattern B: set to true to use the pattern B
Important Note
This product is the off the shelf product in the store. Therefore, we do not take any personal modification or personal customization request. For our products, we do not provide any code library or any support for your coding.


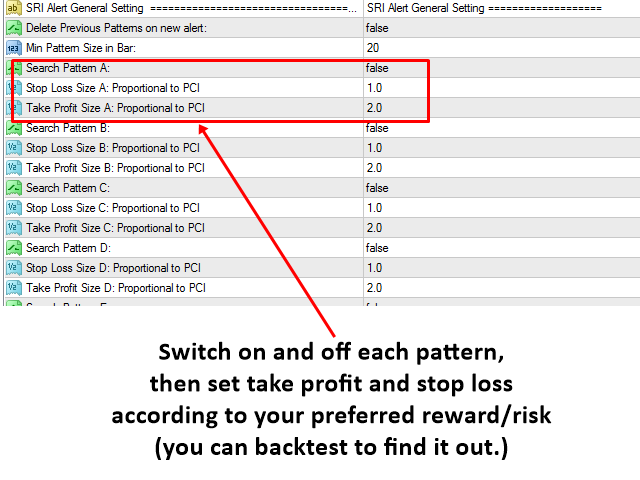
With this indicator you will not miss any pattern. You decide... it makes TP and SL easy for you