MacroStructure

*** 1 MONTH FREE ***


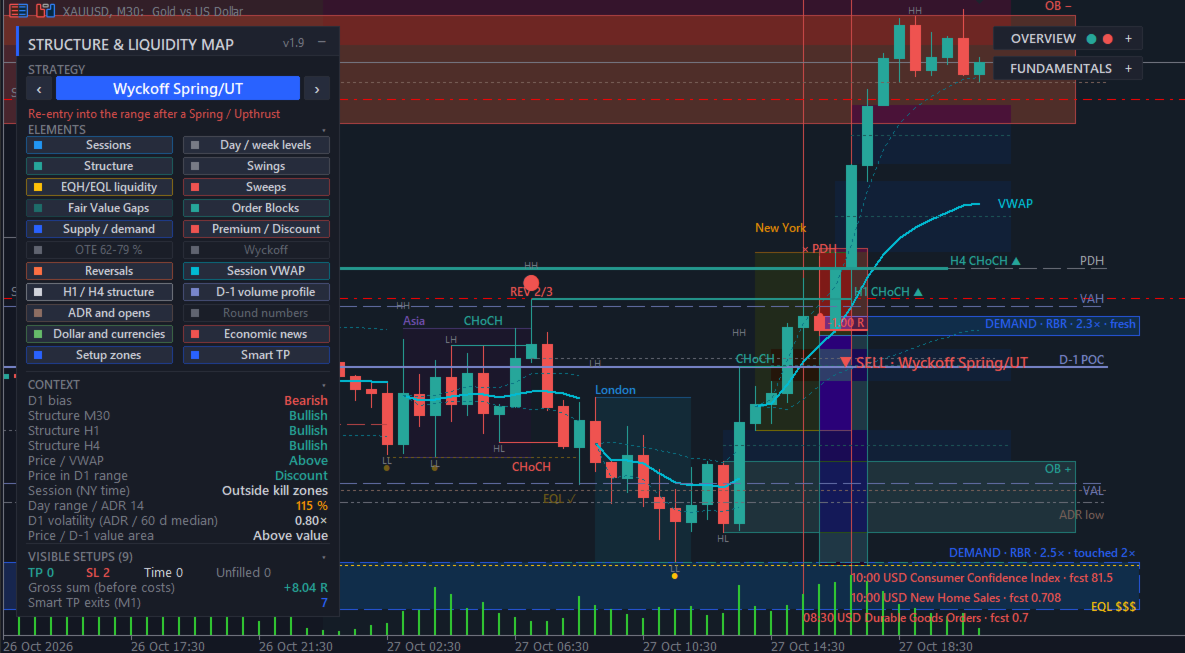
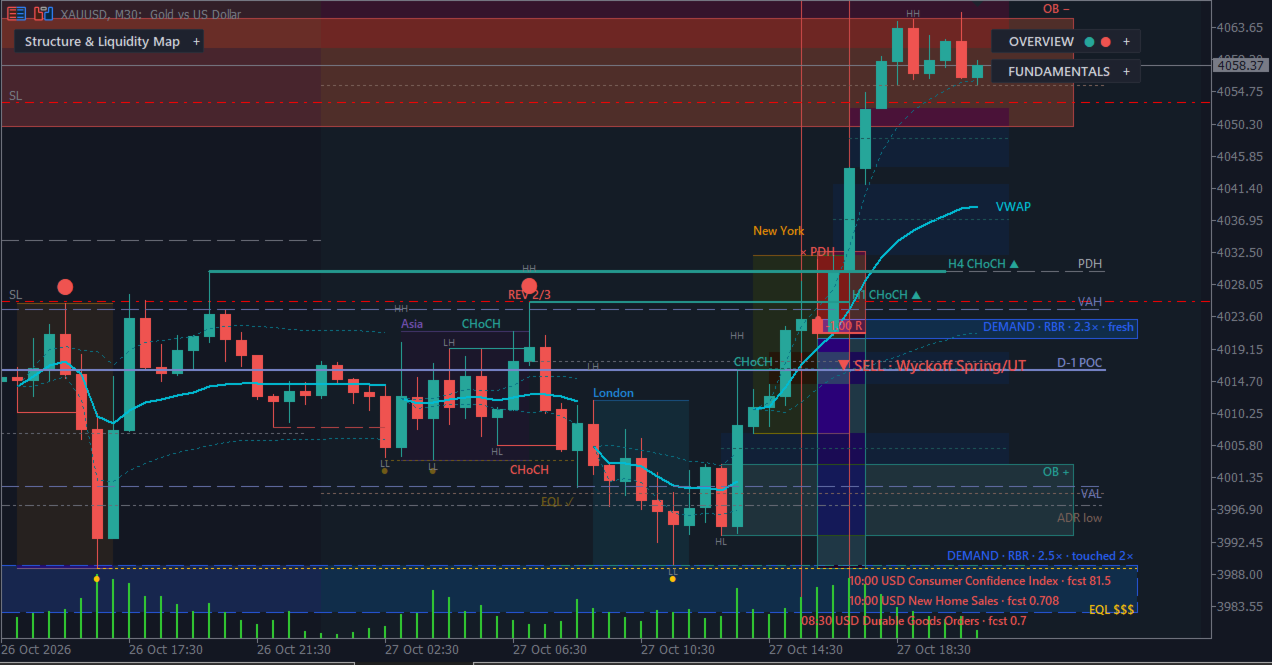
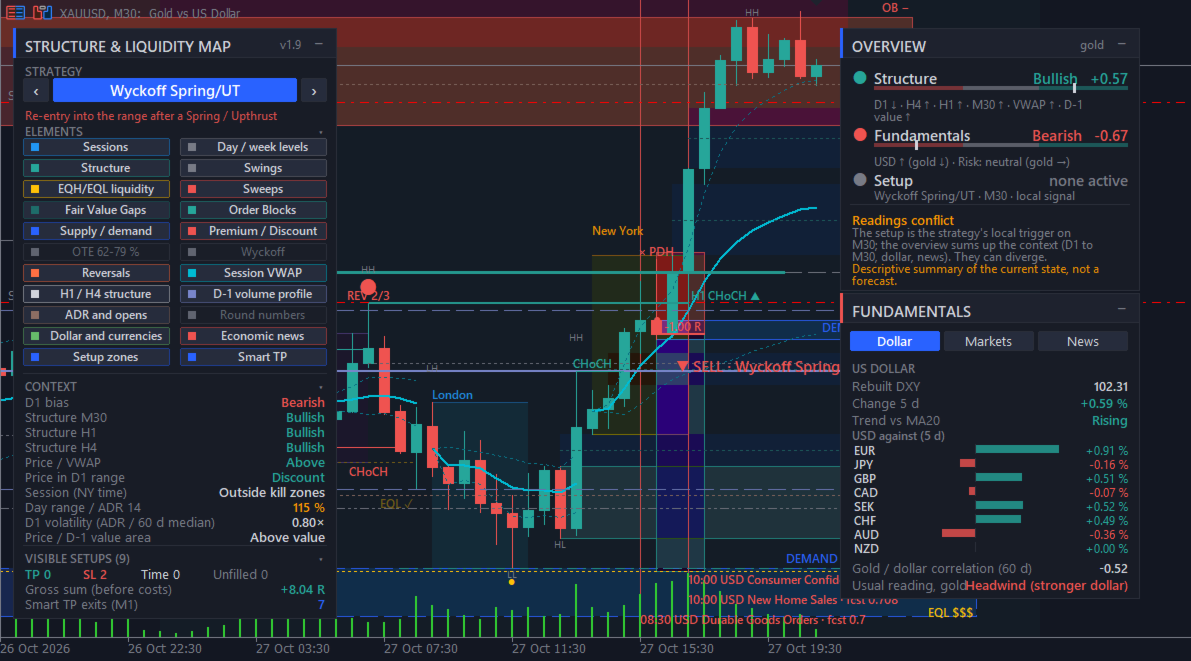
MacroStructure puts market structure, liquidity, session levels and the macro context of MetaTrader 5 on one chart. It draws documented, rule-based elements (Break of Structure, Change of Character, Fair Value Gaps, Order Blocks, liquidity sweeps, Wyckoff events), reference levels, and a fundamental panel with a rebuilt dollar index and the MT5 economic calendar. It is a visual analysis tool: it places, modifies and closes no orders.


WHY ONE INDICATOR

Discretionary traders who follow Smart Money Concepts, ICT-style sessions or Wyckoff often keep several tools open at the same time: one indicator for structure and zones, manual lines for sessions and previous highs and lows, a separate VWAP or volume profile, a dollar index chart, a currency strength table and an economic calendar website. MacroStructure gathers these readings in one chart and one panel, with the same colours, the same time reference (New York time) and the same rules everywhere.

Every element follows a written rule. Hover over any object to read its tooltip: type, price, time and, for setups, entry, stop, target and outcome. Nothing is hidden behind an unexplained score.


HOW TO START

1. Attach MacroStructure to a chart. It is designed for gold (XAUUSD) and the Nasdaq 100 index (NAS100) from M1 to H1, and it works on any symbol and timeframe.
2. Set the input "Server time minus New York time (h)". For a broker server at GMT+2 in winter and GMT+3 in summer, the value is usually 7. To check it, compare the 9:30 New York candle with the opening of the US stock index. If this value is wrong, sessions, kill zones, the midnight open and the session-based strategies are shifted.
3. Use the left panel to choose a strategy view and to show or hide each of the 22 elements with one click. Your choice is saved per chart and restored when the chart is reopened.
4. Read the fundamental panel on the right (Dollar, Markets, News tabs) and the summary dial.


MARKET STRUCTURE AND LIQUIDITY

Market structure
- A Break of Structure (BOS) is marked when a candle closes beyond the last fractal swing in the direction of the trend.
- A Change of Character (CHoCH) is marked when a candle closes beyond the last fractal swing against the trend.
- Swing size is set by the number of fractal bars on each side (2 by default).

Swings
- Higher high (HH), higher low (HL), lower high (LH) and lower low (LL) labels on confirmed fractals.

Equal highs and equal lows
- Two highs or two lows within 0.10 Average True Range (ATR) are marked as resting liquidity.

Liquidity sweeps
- A sweep is marked when price trades beyond a swing or beyond the previous-day high or low, then closes back inside.

Reversals
- A Change of Character is scored out of 3: the CHoCH itself, a liquidity sweep before it, and an RSI divergence. The score is shown on the chart.

Wyckoff events
- Trading range detection.
- Spring (false break below the range) and Upthrust (false break above the range).
- Test or Last Point of Support on lesser volume.
- Jump Across the Creek (JAC) or Sign of Weakness (SOW) when price leaves the range.
- An optional volume filter can be applied. MT5 mostly provides broker tick volume.


ZONES

Fair Value Gaps (FVG)
- The gap between the wicks of candle 1 and candle 3 of a three-candle move.
- A dotted line marks the 50 percent level (consequent encroachment).
- A minimum size in ATR filters small gaps; filled gaps are hidden by default and can be shown.

Order Blocks (OB)
- The last opposite candles before a Break of Structure.

Supply and demand zones
- A tight base followed by a departure of at least 2 ATR: rally-base-rally, drop-base-rally, drop-base-drop and rally-base-drop.
- The tooltip counts how many times price returned into the zone.

Premium and discount
- The daily reference range is split in two: the upper half is premium, the lower half is discount.

Optimal Trade Entry (OTE)
- The 62 to 79 percent retracement band of the last leg.


LEVELS AND SESSIONS

Sessions (New York time, adjustable)
- Asian range 20:00 to 24:00.
- London kill zone 02:00 to 05:00.
- New York kill zone 07:00 to 10:00.
- Midnight open line.

Day and week levels
- Previous-day high and low (New York day).
- Previous-week high and low.

Session VWAP
- Volume-weighted average price reset at each session, with standard deviation bands.

Higher timeframes
- Structure trend of two higher timeframes (H1 and H4 by default), ignored when lower than the chart timeframe.

Previous-day volume profile
- Point of control (POC), value area high (VAH) and value area low (VAL).
- Untouched points of control from earlier days.

Average daily range and opens
- 14-day average daily range (ADR) projected from the day's low and from the day's high.
- Week open and month open.

Round numbers
- An automatic step of about half the average daily range. Off by default.


FUNDAMENTAL PANEL

Dollar tab
- Dollar index rebuilt from the broker's currency pairs with the ICE formula, or the broker's own DXY symbol if you enter it.
- Change over a chosen number of days and trend against its moving average.
- Change of the dollar against 8 currencies.
- Correlation of daily returns between gold and the dollar. This correlation is measured on the same days; it describes the past relationship and does not predict the next move.

Markets tab
- Equity index, VIX, silver, oil and the US 10-year yield, when your broker offers these symbols.
- Gold to silver ratio and a risk-on or risk-off reading.
- Usual readings are shown in plain words, for example: equities down and VIX up point to safe-haven demand; higher yields raise the opportunity cost of holding gold.

News tab and chart lines (MT5 economic calendar)
- A vertical line at the exact release time, with an optional band of plus or minus N minutes around it. Many proprietary trading firms restrict trading around high-impact releases; the band helps you see these windows. Check the rules of your own firm.
- Next releases with a countdown.
- Once published: actual versus forecast, and the size of the surprise scaled by a robust deviation of that release's past surprises.
- The chart symbol's past reaction to the same release.
- Currencies and minimum importance are selectable.
- Optional alert N minutes before a release.
- Release names follow the display language.

Summary dial
- A structural side: weighted reading of chart structure, higher timeframes, premium or discount, and recent sweeps.
- A fundamental side: weighted reading of the dollar, related markets and the latest releases.
- Each item is listed with its weight, so you can see why the dial points where it does.
- The dial describes the current context. It is not a forecast. A local setup on the chart timeframe can disagree with the wider context; the dial shows both so that you decide.


STRATEGY VIEW

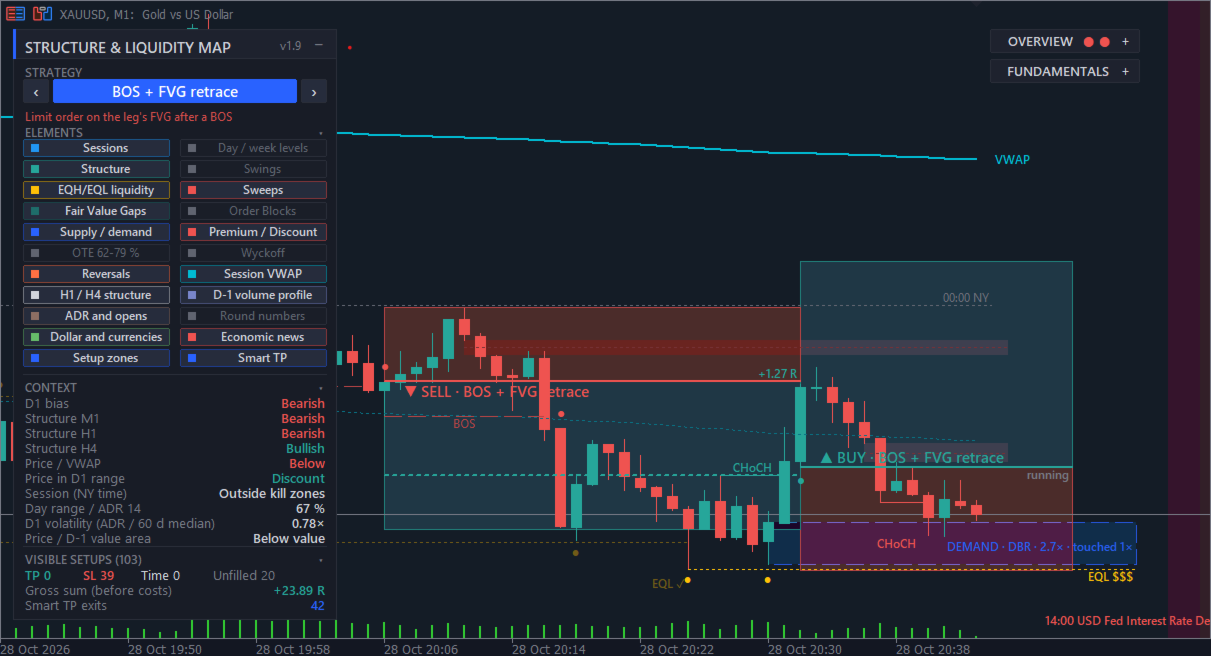
Choose one strategy, or all of them, in the panel. Each setup is drawn as a position box: entry, stop (red) and target (green). The tooltip shows the prices, the time and the outcome on the chart.

- 2022 Model: liquidity raid, market structure shift, then entry on the fair value gap, in the direction of the daily bias.
- Previous-day sweep: sweep of the previous-day high or low, then reversal.
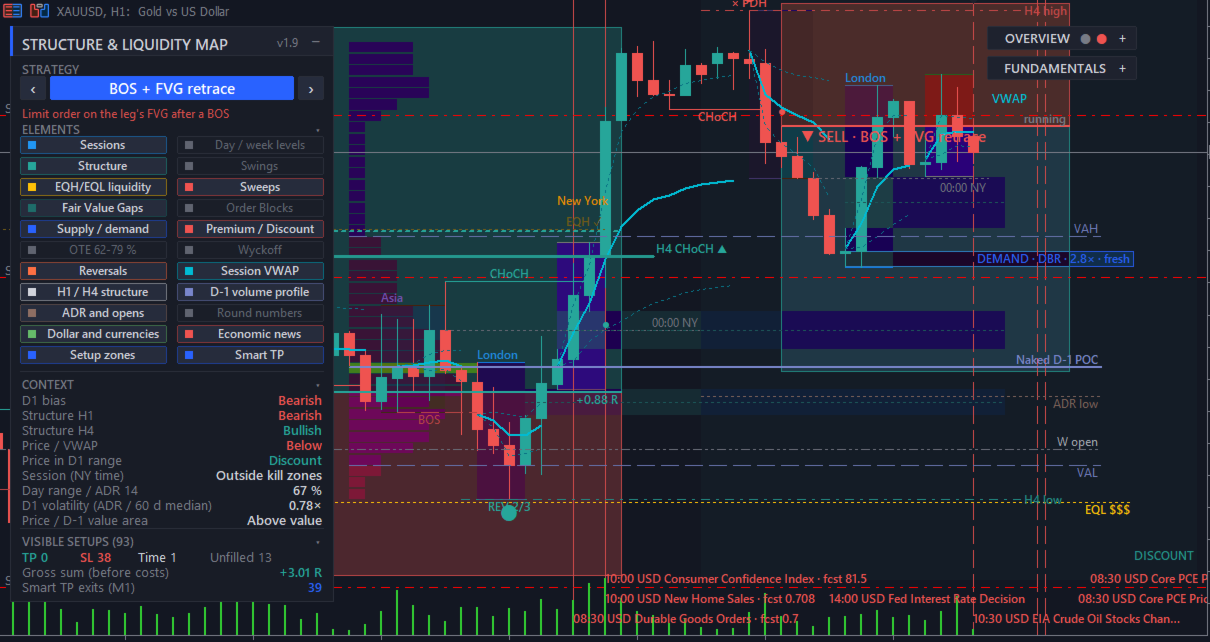
- BOS and FVG: limit order on the fair value gap of the leg that broke structure.
- Wyckoff: re-entry into the range after a Spring or an Upthrust, with an optional low-volume filter.
- Judas swing: false break of the Asian range, then reversal.
- Reversal: Change of Character scored with sweep and RSI divergence.
- News surprise: see below.

The target in R and the time limits are adjustable.

The panel counts the visible setups (target reached, stop reached, time exits, unfilled orders, Smart TP exits) and their sum in R. These counts are gross: they do not include spread, commission or slippage, and they use the small sample visible on your chart. They describe what happened on the chart; they do not measure an edge and do not predict future results.


NEWS SURPRISE STRATEGY

For each past release of the selected currencies with a known actual and forecast value:

1. Surprise = (actual minus forecast) divided by a robust deviation of that release's past surprises (1.4826 times the median absolute deviation, with at least 5 past values).
2. The surprise is significant when its absolute value reaches the threshold you set (0.5 by default). Smaller surprises are ignored.
3. Direction: the usual effect of the release on its currency, taken from the MetaQuotes impact history or from keywords, then converted to the chart symbol. For gold, a positive US surprise that strengthens the dollar gives a sell zone.
4. Entry at the close of the release minute (M1). Protective stop in chart ATR (1 by default), target in R, and a time exit N minutes after the release (30 by default).

The tooltip shows the release name, its New York time, the actual and forecast values and the surprise in deviations. This view works on gold and on currency pairs that contain a calendar currency. On an index such as NAS100, no zone is drawn and the panel says so.

Please note: most of the price reaction to a release often happens within the first minute, before this entry, and spreads usually widen around releases. Judge these zones after your own costs.


SMART TP (OPTIONAL DYNAMIC EXIT)

Tick "Smart TP" in the panel to replace the fixed exit of every strategy with a dynamic exit. Untick it to return to the fixed stop and target.

After the entry is filled, the indicator follows price minute by minute on M1 bars:
1. Stop: if a bar trades through the current stop, the trade exits at the stop, or at the bar's open if price gapped through it.
2. Activation: once the trade has gained the chosen amount (1 R by default), the stop moves to break-even.
3. Trailing: the stop then follows each new M1 swing formed after the fill, only in the trade's favour.
4. Time exit: if nothing is hit, the trade closes at the strategy's usual time limit.

Three modes:
- Trail M1 swings, no fixed target: the target is ignored and the trade runs until the trailing stop is hit.
- Keep target, exit early on M1 reversal: the fixed target stays; the trailing stop only closes the trade earlier on a reversal.
- At target, keep running: trailing starts when the target is reached, with the stop locked one R below the target.

On the chart, a dashed line marks the Smart TP exit price and a dotted line shows the current trailing stop of a running trade.

Notes:
- Up to 120 days of M1 history are loaded. Older setups, or charts where M1 data is not available, use the chart's own bars, which is less precise. The panel shows when M1 data was used.
- Inside the fill bar, the order of price moves is unknown, so trailing starts on the next bar.
- A dynamic exit changes the shape of results (more small winners, a few larger ones, fewer full targets). It does not by itself create an edge.


CONTROL AND CUSTOMISATION

- 22 elements, each switched on or off with one button, saved per chart.
- Display languages: English (default), French, Spanish, Russian and Chinese for all text on the chart.
- Dark theme, light theme, or keep your current chart colours. The original chart colours are restored when the indicator is removed.
- All colours are adjustable.
- The panels can be moved and collapsed.
- Optional alerts on each new setup or reversal, and before economic releases.
- Lookback depth adjustable (1,500 bars by default).

Inputs are grouped by topic: General, Appearance, Elements shown at start, Sessions, Structure / FVG / OB, Supply and demand zones, Liquidity, Reversals, Session VWAP, Multi-timeframe structure, Volume profile / ADR / round numbers, Summary, Fundamentals (dollar and currencies, related markets, economic calendar), Wyckoff, Setups, News surprise strategy, Smart TP, Colors.


FOR DEVELOPERS: iCustom BUFFERS

- Buffers 0 and 1: setup entry prices (buy, sell).
- Buffers 2 and 3: reversals (buy, sell).
- Buffers 4 to 9: session VWAP and its bands (two alternating series per session).


IMPORTANT INFORMATION

- MacroStructure is a visual analysis tool. It places, modifies and closes no orders. It is not a signal service and not investment advice.
- Each rule is documented, but no rule shown here is presented as profitable. Past setup outcomes on a chart do not predict future results. Judge the tool on your own charts, in demo first, and after your own trading costs.
- Fractals and fair value gaps are confirmed one or two bars after they form, as with any swing-based tool. An element can therefore appear with a short delay.
- MT5 mostly provides broker tick volume, which can differ from exchange volume. Volume-based elements (VWAP, volume profile, Wyckoff volume filter) use this data.
- The MT5 economic calendar is not available in the Strategy Tester. In the tester, the fundamental panel shows "Calendar unavailable in the tester" and the calendar features are inactive. All other elements can be viewed in the tester's visual mode. Calendar features work on a live chart.
- Related-market readings appear only for the symbols your broker offers.
- Everything is recomputed on each new bar. On M1 with more than 5,000 bars of lookback, the display can slow down. Smart TP with M1 data adds some load on higher timeframes.
- The fundamental panel can cover the last candles at the top right: collapse it or move it with the panel margin input.


SUPPORT

Questions, bug reports and suggestions are welcome in the comments of this product page or by private message on MQL5. Please mention your broker, symbol and timeframe, and attach a screenshot of the panel when reporting an issue.
Produtos recomendados
Important Lines
Terence Gronowski
4.88 (24)
This indicator displays Pivot-Lines, preday high and low, preday close and the minimum and maximum of the previous hour. You just have to put this single indicator to the chart to have all these important lines, no need to setup many single indicators. Why certain lines are important Preday high and low : These are watched by traders who trade in a daily chart. Very often, if price climbs over or falls under a preday low/high there is an acceleration in buying/selling. It is a breakout out of a
FREE
Pivot MT5
Dmitrij Isaenko
O indicador desenha linhas de suporte e resistência diárias no gráfico, bem como o nível de Pivot (nível de pivô). Adaptado para trabalhar em MT5 Parâmetros do indicador: DayBack - o número de dias para marcação de linhas; PPcolor - cor da linha Pivô; Espessura de espessura de linha PP; PPstyle - estilo de linha Pivot; Supp-color de linhas de suporte; Sstyle - estilo de linha de suporte; Swidth - espessura das linhas de suporte; Resistir - cor das linhas de resistência; Rstyle - estilo de lin
FREE
Free automatic Fibonacci is an indicator that automatically plots a Fibonacci retracement based on the number of bars you select on the BarsToScan setting in the indicator. The Fibonacci is automatically updated in real time as new highest and lowest values appears amongst the selected bars. You can select which level values to be displayed in the indicator settings. You can also select the color of the levels thus enabling the trader to be able to attach the indicator several times with differe
FREE
Raymond Cloudy Day Indicator for MT5 – Pivot-Based Reversal and Trend Levels Raymond Cloudy Day Indicator is a pivot-based level indicator for MetaTrader 5 (MT5). It was developed by Ngo The Hung based on Raymond’s original idea and is designed to give a structured view of potential reversal zones, trend extensions and support/resistance levels directly on the chart. The default settings are optimised for XAUUSD on the H1 timeframe, but the indicator can be tested and adjusted for other symbols
FREE
Follow The Line MT5
Oliver Gideon Amofa Appiah
4.6 (35)
This indicator obeys the popular maxim that: "THE TREND IS YOUR FRIEND" It paints a GREEN line for BUY and also paints a RED line for SELL. (you can change the colors). It gives alarms and alerts of all kinds. IT DOES NOT REPAINT and can be used for all currency pairs and timeframes. Yes, as easy and simple as that. Even a newbie can use it to make great and reliable trades. NB: For best results, get my other premium indicators for more powerful and reliable signals. Get them here: https://www.m
FREE
JT360 DNA Mini PnL Pointer V1.04 Public Compacto. Claro. Sempre à vista. O JT360 DNA Mini PnL Pointer é um indicador leve para MetaTrader 5 que apresenta o lucro ou prejuízo flutuante agregado de todas as posições abertas no símbolo do gráfico atual. O seu design compacto combina o PnL baseado no risco, expresso em R, uma pequena barra visual e uma matriz de cores configurável. As cores características da JT360 — turquesa e magenta — destacam os valores extremos e facilitam a identificação rápid
FREE
PZ Penta O MT5
PZ TRADING SLU
3.8 (5)
The Penta-O is a 6-point retracement harmonacci pattern which usually precedes big market movements. Penta-O patterns can expand and repaint quite a bit. To make things easier this indicator implements a twist: it waits for a donchian breakout in the right direction before signaling the trade. The end result is an otherwise repainting indicator with a very reliable trading signal. The donchian breakout period is entered as an input. [ Installation Guide | Update Guide | Troubleshooting | FAQ | A
FREE
Donchian Breakout And Rsi
Mattia Impicciatore
4.5 (2)
Descrição geral Este indicador é uma versão aprimorada do Canal Donchian clássico, enriquecida com funções práticas para o trading real. Além das três linhas padrão (máxima, mínima e linha do meio), o sistema detecta breakouts e os mostra visualmente com setas no gráfico, exibindo apenas a linha oposta à direção da tendência atual para uma leitura mais limpa. O indicador inclui: Sinais visuais : setas coloridas nos breakouts Notificações automáticas : alerta pop-up, push e e-mail Filtro RSI : pa
FREE
RSI abcd
Francisco Gomes Da Silva
3.75 (4)
RSI ABCD Pattern Finder: Estratégia Técnica 1. Como o Indicador Funciona Combina o RSI clássico com detecção automática de padrões harmônicos ABCD . Componentes Principais RSI Padrão (período ajustável) Marcações de Topos e Fundos (setas) Padrões ABCD (linhas verdes/vermelhas) Filtros de Overbought (70) e Oversold (30) 2. Configuração no MT5 period = 14 ; // Período do RSI size = 4 ; // Tamanho máximo do padrão OverBought = 70 ; // Nível de sobrecompra OverSold = 30 ; // Nível de sobrevenda Filt
FREE
LT Donchian Channel
Thiago Duarte
4.86 (7)
Donchian Channel (ou canal de Donchian) é um indicador criado por  Richard Donchian. Ele é  formado tomando a máxima mais alta e a mais baixa mais baixa do último período especificado em velas. A área entre alta e baixa é o canal para o período escolhido. Sua configuração é simples. É possível ter a média entre a linha superior e inferior além de alertas quando o preço atinge um dos lados. Se tiver alguma dúvida ou encontrar alguma falha, me contate. Faça bom uso!
FREE
Automatic Trendlines
Pasi Hakamaki
4.69 (51)
O indicador desenha linhas de tendência no gráfico. Este indicador possui seis entradas. O usuário pode especificar rótulos alternativos para ambas as linhas. Se várias instâncias do indicador forem usadas, os rótulos devem ser diferentes. O usuário pode definir a largura e a cor das linhas e a profundidade que especifica quais picos significativos devem ser usados. Por exemplo, Depth = 10 define as linhas de tendência usando os picos e vales atuais que têm pelo menos 10 barras à direita e à esq
FREE
# DAILY SUPPORT AND RESISTANCE LEVELS - SEO OPTIMIZED DESCRIPTION ## SHORT DESCRIPTION (160 characters max) ``` Free pivot points indicator with daily support resistance levels for MT5. Perfect for intraday forex day trading and scalping strategies. ``` **Character count:** 159 **Keywords included:** pivot points, support, resistance, MT5, forex, day trading, scalping, free --- ## FULL DESCRIPTION (HTML Formatted for MQL5) ### Main Title **Daily Support and Resistance Levels - Free Pivot
FREE
VFI Quantum
Nikita Berdnikov
5 (1)
Introducing VFI (Volume Flow Indicator) – a trading indicator that analyzes the relationship between volume and price movement to identify key trading opportunities. The indicator displays the strength and direction of volume flow, providing clear signals about potential entry and exit points. Signals are formed based on zero line crossovers, crossovers between the VFI line and its exponential moving average (EMA), and when the indicator exits overbought and oversold zones. Attention! This stra
FREE
Dynamic Key Levels
Rodrigo Ivan Ahumada Pena
Key Levels S/R — Dynamic Support & Resistance Structure Key Levels S/R is a precise and reliable indicator that identifies true Support and Resistance levels based on confirmed swing structure. Instead of guessing or repainting, it waits for market validation before marking any level — giving traders clean, trustworthy zones to work with. This tool is ideal for breakout traders, pullback traders, and anyone who uses pending orders at structurally meaningful price levels. How the Logic Works The
FREE
CandlePro X
Murtadha Majid Jeyad Al-Khuzaie
CandlePro X — Free Professional Candle Visualizer for MetaTrader 5 CandlePro X is a free chart visualization indicator for MetaTrader 5, designed to make candlestick charts cleaner, sharper, and easier to read. If you find it difficult to quickly distinguish bullish and bearish candles, especially on busy charts, CandlePro X helps solve this problem by giving your candles stronger colors, clearer contrast, and a more professional appearance. CandlePro X does not generate trading signals, pred
FREE
Easy Correlations Indicator The Easy Correlations Indicator is designed to help traders analyze the relationship between two correlated instruments. By monitoring the distance between their Relative Strength Index (RSI) values, the indicator highlights situations where one instrument has moved significantly further than the other. This creates potential trading opportunities: Sell the stronger instrument (overstretched RSI) Buy the weaker instrument (lagging RSI) Because the positions are opened
FREE
Daily Pivot Point Levels
Maria Luisa Aparecida Vicentim
Daily Pivot Point Levels Identifique níveis diários de suporte e resistência com clareza, precisão matemática e simplicidade. Daily Pivot Point Levels é um indicador para MetaTrader 5 que calcula e exibe automaticamente o Pivot Point central (P) e os níveis de suporte (S) e resistência (R), utilizando os preços do período diário anterior. Desenvolvido para traders que valorizam referências objetivas de preço, organização visual e flexibilidade, o indicador oferece diferentes métodos de cálculo
FREE
PROMETHEUS TECHNICAN VERSION Free | By THE SONS A gift from The Sons — no strings, no trial, no expiry. Every trader deserves access to professional-grade market intelligence. That belief is why Prometheus Technical Version exists, and why it costs nothing. Consider it our handshake to the trading community. What You're Getting This is not a simplified tool dressed up as a gift. Prometheus Technican Version is a fully built, institutional-quality technical analysis indicator running a dual-model
FREE
MACD Enhanced
Nikita Berdnikov
4 (4)
Introducing the MACD  Enhanced – an advanced MACD (Moving Average Convergence Divergence) indicator that provides traders with extended capabilities for trend and momentum analysis in financial markets. The indicator uses the difference between the fast and slow exponential moving averages to determine momentum, direction, and strength of the trend, creating clear visual signals for potential entry and exit points. Attention! To achieve the best results, it is recommended to adapt the indicator
FREE
Aurum Pivot Point Breakout Free é um Expert Advisor gratuito de rompimento para MetaTrader 5. Ele opera rompimentos dos níveis clássicos de pivô diário R1 e S1 com ordens stop, um stop baseado em ATR e uma saída com trailing. O tamanho da posição é uma porcentagem fixa do saldo atual, portanto o volume (lot) aumenta e diminui conforme a conta. Lógica Calcula os pivôs clássicos de piso do dia anterior (P, R1, S1). Coloca uma ordem buy stop acima de R1 e uma sell stop abaixo de S1. Cada nível é ne
FREE
KMB Smart Pattern Analyzer PRO
Karwan Msto Mohammed Mohammed
Visão geral do produto KMB Smart Pattern Analyzer PRO é um indicador avançado de análise técnica desenvolvido para detectar e classificar padrões de mercado com alto nível de compatibilidade dentro de uma área do gráfico definida pelo usuário. O indicador combina vários mecanismos de análise em uma única ferramenta profissional: Análise de padrões de candlestick Reconhecimento de padrões gráficos clássicos Detecção de estruturas harmônicas Análise inteligente de estrutura de mercado / SMC Em vez
FREE
Girassol Sunflower MT5 Indicator
Saullo De Oliveira Pacheco
3.86 (7)
Este é o famoso indicador Girassol para Metatrader5. Este indicador marca possíveis topos e fundos nos gráficos dos preços. O indicador identifica topos e fundos no historico de preços do ativo, tenha em mente que o girassol atual, do ultimo candle repinta, pois não é possivel identificar um topo até que o mercado reverta e também não é possivel identificar um fundo sem que o mercado para de cair e comece a subir. Se você estiver procurando por um programador profissional para Metatrader5, entre
FREE
Reversal Composite Candles
MetaQuotes Ltd.
3.69 (16)
A ideia do sistema é a identificação de padrões de reversão utilizando o cálculo de candles compostos. Os padrões de reversão são semelhantes aos padrões "Martelo" e o " Homem Enforcado " da análise candlestick Japonesa, porém ele usa candles compostos em vez de uma única barra e não precisa do pequeno corpo numa composição para confirmar a reversão. Os parâmetros de entrada: Range - número máximo de barras, utilizada no cálculo de composição dos candles compostos . Minimum - tamanho mínimo dos
FREE
Indicator Description 4 Hull MA Color + Envelopes is a powerful trend-following indicator for MetaTrader 5 that combines four Hull Moving Averages (HMA) with Moving Average Envelopes to clearly identify market direction, trend strength, and potential reversal or pullback zones. This indicator is designed to reduce noise, react quickly to price movement, and provide a clean visual structure for professional trading.   Key Features   4 Hull Moving Averages (20, 50, 100, 200) Automatic color change
FREE
High Low Open Close
Alexandre Borela
4.98 (46)
Se você gosta deste projeto, deixe uma revisão de 5 estrelas. Este indicador desenha os preços abertos, altos, baixos e finais para o especificado período e pode ser ajustado para um fuso horário específico. Estes são níveis importantes olhados por muitos institucional e profissional comerciantes e pode ser útil para você saber os lugares onde eles podem ser mais activa. Os períodos disponíveis são: Dia anterior. Semana anterior. Mês anterior. Quarto anterior. Ano anterior. Ou: Dia atual. Seman
FREE
Haven Key Levels PDH PDL
Maksim Tarutin
4.92 (12)
O indicador   "Haven Key Levels PDH PDL"   ajuda os traders a visualizar os níveis-chave no gráfico. Ele marca automaticamente os seguintes níveis: DO (Daily Open)   — o nível de abertura diária. NYM (New York Midnight)   — o nível da meia-noite de Nova Iorque. PDH (Previous Day High)   — o máximo do dia anterior. PDL (Previous Day Low)   — o mínimo do dia anterior. WO (Weekly Open)   — o nível de abertura semanal. MO (Monthly Open)   — o nível de abertura mensal. PWH (Previous Week High)   — o
FREE
Dynamic Pivot Zones
Vincent Jose Proenca
Dynamic Pivot Zones – Your Level Assistant on the Chart This indicator is a bit like a GPS for your trading . It shows you where the price likes to hang out, where it gets nervous, and where it flies through. No more calculating pivots by hand or guessing support and resistance levels. What it does: Automatically plots H1, H4, and D1 pivots . Shows support and resistance zones : R1, R2, S1, S2. Lines are colored and easy to read , so you can instantly see what’s hot or cold. Why you’ll love it:
FREE
FibRetrace Zones Zonas de retração de Fibonacci do último movimento FibRetrace Zones é o complemento visual gratuito do Expert Advisor FibRetrace. Ele desenha os níveis de retração de Fibonacci e destaca a zona de recuo do último movimento, para que você veja onde as entradas se alinham antes de operar. A zona é colorida pela direção: verde para configurações de alta, vermelho para configurações de baixa. Funciona em qualquer símbolo e qualquer tempo gráfico. PRINCIPAIS RECURSOS Detecção automát
FREE
Support and Resistance Levels with Breaks is a MetaTrader 5 indicator designed to detect important support and resistance levels based on pivot points and identify price breaks with volume confirmation. The indicator analyzes price movements around key market levels and highlights breakouts only when the volume condition is satisfied. This helps traders distinguish stronger price movements from low-volume level breaks. There are even better indicators—get them here. https://www.mql5.com/en/users
FREE
Are you tired of drawing trendlines every time you're analyzing charts? Or perhaps you would like more consistency in your technical analysis. Then this is for you. This indicator will draw trend lines automatically when dropped on a chart. How it works Works similar to standard deviation channel found on mt4 and mt5. It has 2 parameters: 1. Starting Bar 2. Number of bars for calculation The   starting bar   is the bar which drawing of the trend lines will begin, while the   number of bars for c
FREE
Os compradores deste produto também adquirem
Trend Sniper X
Sarvarbek Abduvoxobov
4.86 (43)
Trend Sniper X é um indicador de acompanhamento de tendência para múltiplos tempos gráficos no MetaTrader 5 que ajuda os traders a identificar a direção da tendência e potenciais pontos de reversão com clareza e precisão. para MT4: https://www.mql5.com/en/market/product/193245 Informações sobre o preço: O preço atual é promocional e está sujeito a alterações à medida que novas atualizações e funcionalidades forem lançadas. Oferta Bônus: Para obter o Auto-Trade Assistant EA GRATUITO para este in
Um novo Rei chegou à cidade - Indicador + Gestão de Ordens (TP1 + TP2 + TP3) + Enviador opcional de sinais para Telegram INCLUÍDO (GRÁTIS) (SISTEMA COMPLETO DE TRADING e SINAIS) Nosso melhor EA para Ouro: Gold Slayer Este indicador inclui uma estratégia avançada, um sistema de trading com gestão de ordens personalizável e um sistema de reversão à média que combina extensões de envelopes, apoiado por múltiplos filtros inteligentes de confirmação, como o RSI, para capturar entradas de reversão de
Smart Trend Trading System — MetaTrader 5 Após a compra, envie-me uma mensagem no MQL5 para receber Smart Universal Expert Advisor GRÁTIS, além do curso online, do manual em PDF e do acesso ao grupo privado. O STTS reúne a direção da tendência, sinais de entrada e saída, zonas de reversão e níveis de preço importantes diretamente no seu gráfico. Siga o sistema manualmente ou conecte um EA compatível separado para executar operações automaticamente com as configurações que você escolher. UM SISTE
Zoryk Gold
Reda El Koutbane
4.76 (17)
O desconto termina em 24 horas — próximo preço $ 69 ZORYK — Sistema avançado de sinais para XAUUSD no MetaTrader 5 Você conhece essa sensação. Você passa muito tempo analisando o ouro. Espera pela entrada certa. Finalmente abre a operação e o preço começa imediatamente a se mover contra você. Você fecha cedo demais, move o Stop Loss ou hesita por alguns segundos. Depois disso, o mercado alcança exatamente o destino que você esperava originalmente, mas sem você dentro da operação. O problema ne
Tenha sua vantagem no trading à vista! M5 Sniper é um novo indicador da MeanFX. Ele combina sinais de trading precisos com níveis adaptativos de TP/SL — criando, como resultado, as melhores operações estatísticas possíveis! O preço aumenta a cada 5 compras, o próximo preço é de 69$ Envie-me uma mensagem após a compra para receber dicas/guia e um EA bônus O que o faz se destacar? Desempenho estatístico comprovado no Gold XAUUSD ( funciona em praticamente todos os ativos , com foco em dominar um ú
SuperScalp Pro
Van Minh Nguyen
4.54 (37)
SuperScalp Pro - Professional Multi-Layer Confluence Scalping System O SuperScalp Pro é um indicador avançado de scalping que aprimora o Supertrend clássico com vários filtros inteligentes de confirmação. Ele ajuda a identificar oportunidades de Buy/Sell com maior probabilidade de sucesso, reduzindo significativamente os sinais falsos. Setas claras de Buy e Sell aparecem diretamente no gráfico, juntamente com os níveis de Stop Loss e Take Profit baseados em ATR, calculados automaticamente em tem
SMC Intraday Formula
VividMind Digital Solutions
5 (26)
Vamos ser honestos primeiro. Nenhum indicador sozinho vai te tornar lucrativo. Se alguém te disser o contrário, está te vendendo um sonho. Qualquer indicador que mostre setas perfeitas de compra/venda pode ser feito para parecer impecável — basta dar zoom na parte certa da história e tirar um print das operações vencedoras. Nós não fazemos isso.  SMC Intraday Formula é uma ferramenta. Ela lê a estrutura do mercado para você, identifica as zonas de maior probabilidade de preço e mostra exatament
A lenda está de volta: Entry Points Pro 10. O relançamento do lendário indicador que se manteve por 3 anos no Top-3 do MQL5 Market. Mais de 600 avaliações nas duas versões, milhares de traders operam com ele todos os dias, mais de 28.000 downloads da versão demo   MT4+MT5 . Li cada avaliação de vocês ao longo de cinco anos — e, em vez de promessas, coloquei as respostas dentro da versão 10. Do autor que está no mercado desde 1999 e valoriza a honestidade, a própria reputação e os seus clientes .
GoldenX Entry MT5
VividMind Digital Solutions
5 (17)
GoldenX Entry é um indicador para MT5 com um algoritmo adaptativo Smart Entry Trend, um sistema de pontuação de sinais, um detector de regime de mercado e um filtro de volatilidade. Cada sinal inclui um nível de entrada calculado, três níveis de Take-Profit (TP1, TP2, TP3) e um nível de Stop-Loss. Ele é construído sobre múltiplas camadas analíticas projetadas para se adaptar a diferentes condições de mercado, combinando um sistema analítico multicamadas com um otimizador integrado e um sistema d
Auto Optimized SpeedAngle é um sistema de vetorização de momentum de nível institucional que elimina o sobreajuste ( curve-fitting ) por meio da otimização contínua de avanço ( Walk-Forward Optimization , WFO). Em vez de depender de entradas estáticas que se degradam quando os regimes de mercado mudam, o indicador recalibra dinamicamente seus parâmetros utilizando validação fora de amostra ( Out-of-Sample , OOS), garantindo que os sinais exibidos representem vantagens estatísticas genuínas e não
ARIPoint
Temirlan Kdyrkhan
1 (4)
ARIPoint is a powerful trading companion designed to generate high-probability entry signals with dynamic TP/SL/DP levels based on volatility. Built-in performance tracking shows win/loss stats, PP1/PP2 hits, and success rates all updated live. Key Features: Buy/Sell signals with adaptive volatility bands Real-time TP/SL/DP levels based on ATR Built-in MA Filter with optional ATR/StdDev volatility Performance stats panel (Success, Profit/Loss, PP1/PP2) Alerts via popup, sound, push, or email Cu
Gann Made Easy   é um sistema de negociação Forex profissional e fácil de usar, baseado nos melhores princípios de negociação usando a teoria do sr. W. D. Gann. O indicador fornece sinais precisos de COMPRA e VENDA, incluindo níveis de Stop Loss e Take Profit. Você pode negociar mesmo em movimento usando notificações PUSH. Entre em contato comigo após a compra para receber instruções de negociação e ótimos indicadores extras gratuitamente! Provavelmente você já ouviu muitas vezes sobre os método
M1 Sniper MT5
Oleg Rodin
5 (7)
O   M1 SNIPER   é um sistema indicador de negociação fácil de usar. É um indicador de seta projetado para o período M1. O indicador pode ser usado como um sistema independente para scalping no período M1 e pode ser usado como parte do seu sistema de negociação existente. Embora este sistema de negociação tenha sido projetado especificamente para negociação no M1, ele também pode ser usado em outros períodos. Originalmente, desenvolvi este método para negociar XAUUSD e BTCUSD. Mas considero-o úti
Adaptive Price Action Engine Compre um indicador, ganhe o EA de graça Análise Auto-Otimizada de Tendências e Padrões de Candlestick em Múltiplos Timeframes Os mercados estão em constante mudança, e nem todos os padrões de Price Action têm o mesmo valor em todas as condições de mercado. O Adaptive Price Action Engine foi desenvolvido para se adaptar às mudanças nas condições do mercado, combinando estrutura de tendência, análise Multi-Timeframe, padrões de candlestick e otimização estatística em
Power Candles MT5
Daniel Stein
4.58 (12)
Power Candles V3 - Indicador de força com auto-otimização O Power Candles V3 transforma a força da moeda e do instrumento num plano de negociação prático em todos os gráficos aos quais está associado. Em vez de se limitar a colorir as velas, executa uma otimização automática em tempo real em segundo plano e apresenta-lhe os melhores valores de Stop Loss, Take Profit e limiar de sinal para o símbolo em questão. Basta um clique para o adotar na negociação em tempo real — as linhas de entrada, Stop
Próxima Atualização — Versão 2.52 em Breve! [NOVO] Prepare-se para 4 Grandes Novos Recursos Projetados para Aprimorar sua Análise de Mercado e seu Fluxo de Trabalho de Trading Estamos levando a análise de mercado a um novo nível com 4 novos recursos desenvolvidos para atender às suas necessidades de trading. Apresentamos: 1. TRADE OVERVIEW DASHBOARD 2. CONFLUENCE AT ZONE 3. STRONG & WEAK HIGH/LOW 4. OTE 1. TRADE OVERVIEW DASHBOARD Um painel que ajuda você a compreender mais facilmente o panoram
Boba Analysis Suite
Trade Ready Solutions LLC
5 (2)
Boba Analysis Suite O Boba Analysis Suite é um indicador de análise para o MetaTrader 5. Reúne a estrutura do mercado, as zonas de preço relevantes e o contexto geral do mercado numa única visualização do gráfico. Desenvolvido a partir da experiência prática como trader e formador de traders, apoia um processo de análise estruturado: avaliar a direção do mercado, identificar níveis importantes e analisar vários períodos gráficos em conjunto. Análise em contexto O significado de cada sinal depend
Gold Entry Sniper
Tahir Mehmood
5 (21)
Gold Entry Sniper – Painel ATR Multi-Tempo Profissional para Scalping e Swing Trading em Ouro Gold Entry Sniper é um indicador avançado para MetaTrader 5 projetado para fornecer sinais de compra/venda precisos para XAUUSD e outros ativos, com base na lógica de Trailing Stop ATR e análise multi-tempo . Ideal tanto para scalpers quanto para swing traders. Principais Recursos e Vantagens Análise Multi-Tempo – Veja a tendência de M1, M5 e M15 em um único painel. Trailing Stop Baseado em ATR – Níveis
FiboSniper Pro
Van Minh Nguyen
5 (4)
FiboSniper Pro – Multi-Filter Fibonacci System with Auto SL/TP and Control Panel FiboSniper Pro é um indicador técnico que combina Fibonacci Envelopes dinâmicos com vários filtros de confirmação para gerar sinais seletivos de Buy e Sell. Os níveis de Fibonacci são calculados com base em Moving Average e ATR e, em seguida, filtrados por ADX, EMA, RSI, ATR, Volume, Time e estrutura das velas. O indicador exibe diretamente no gráfico os níveis automáticos de Stop Loss e Take Profit baseados em ATR,
Tokyo mt5 Indicator
Vasiliy Strukov
5 (12)
O Tokyo Indicator oferece uma visão geral visual clara da direção da tendência, de possíveis sinais de negociação e das condições de mercado. Sua linha de tendência em degraus e codificada por cores distingue as fases de alta (azul) das fases de baixa (magenta). Setas direcionais correspondentes destacam possíveis oportunidades de compra e venda quando a tendência exibida muda. Um painel integrado reúne o sinal atual, o viés de mercado, o momentum, a volatilidade e a qualidade do sinal em uma v
Trend Catcher ind mt5
Ramil Minniakhmetov
5 (18)
INDICADOR TREND CATCHER O Indicador Trend Catcher analisa os movimentos de preços do mercado, utilizando uma combinação de indicadores de análise de tendências adaptativos, proprietários e personalizados pelo autor. Identifica a verdadeira direção do mercado, filtrando o ruído de curto prazo e focando a força do momentum subjacente, a expansão da volatilidade e o comportamento da estrutura de preços. Utiliza também uma combinação de indicadores personalizados de suavização e filtragem de tendê
Gold Trend Coach MT5
Cristhian Alexander Gaibor Cuasquer
5 (2)
Gold Trend Coach é um indicador de tendência para ouro (XAUUSD) no MetaTrader 5 com sinais de compra e venda, stop loss e três alvos de take profit, confirmados no fechamento da vela, um painel coach multi-timeframe e alertas no seu celular e no Telegram. Feito para scalping em M5 e intraday em M15 durante as sessões de Londres e Nova York. Gold Trend Coach: sinais de tendência para o ouro XAUUSD com entrada, stop e três alvos. Preço de lançamento $39 para as primeiras 20 cópias, depois $59. Es
Quantum TrendPulse
Bogdan Ion Puscasu
5 (26)
Apresentando   Quantum TrendPulse   , a ferramenta de negociação definitiva que combina o poder do   SuperTrend   ,   RSI   e   Stochastic   em um indicador abrangente para maximizar seu potencial de negociação. Projetado para traders que buscam precisão e eficiência, este indicador ajuda você a identificar tendências de mercado, mudanças de momentum e pontos de entrada e saída ideais com confiança. Principais características: Integração SuperTrend:   siga facilmente a tendência predominante do
Neuro Poseidon MT5
Daria Rezueva
4.75 (52)
Neuro Poseidon is a new indicator by Daria Rezueva. It combines precise trading signals with adaptive TP/SL levels - creating best possible trades as a result! Message me and get  Neuro Poseidon Assistant  as a gift to automize your trading process! What makes it stand out? 1. Proven profitability on all assets and timeframes 2. Only confirmed BUY and SELL signals present on the chart 3. Adaptive TP & SL levels generated by the software for each trade 4. Easy to understand - suitable for al
Azimuth Pro
Ottaviano De Cicco
5 (7)
Azimuth Pro V2: Estrutura Fractal Sintética e Entradas Confirmadas para MT5 Visão geral Azimuth Pro é um indicador de estrutura swing multinível da Merkava Labs . Quatro camadas de swing aninhadas, VWAP ancorado em swings, detecção de padrões ABC, filtragem estrutural de três timeframes e entradas confirmadas em barra fechada — um gráfico, um fluxo de trabalho dos micro-swings aos macro-ciclos. Este não é um produto de sinais cegos. É um fluxo de trabalho baseado em estrutura para traders que v
Apresentando       Quantum Breakout PRO   , o inovador Indicador MQL5 que está transformando a maneira como você negocia Breakout Zones! Desenvolvido por uma equipe de traders experientes com experiência comercial de mais de 13 anos,       Quantum Breakout PRO       foi projetado para impulsionar sua jornada comercial a novos patamares com sua estratégia de zona de fuga inovadora e dinâmica. O Quantum Breakout Indicator lhe dará setas de sinal em zonas de breakout com 5 zonas-alvo de lucro e su
Indicador multimoedas de força e momentum MT5 Dynamic Forex28 Navigator é a evolução dos nossos indicadores populares de longa data e reúne a potência de três ferramentas numa só: Advanced Currency Strength28 Indicator (700 avaliações) Advanced Currency IMPULSE with ALERT (530 avaliações) CS28 Combo Signals (bónus atual) Os dois indicadores anteriores somam mais de 1.200 avaliações no MQL5 Market e são uma referência na comunidade MT4 desde 2016. O Dynamic Forex28 Navigator MT5 continua com a me
O Scalper Vault é um sistema de negociação poderoso e completo, projetado para traders que buscam consistência em operações intraday. Este indicador de alta precisão funciona como um sistema de negociação autônomo, oferecendo análises de nível institucional tanto para o mercado Forex quanto para Opções Binárias. ENTRE EM CONTATO COMIGO APÓS A COMPRA PARA RECEBER DICAS DE NEGOCIAÇÃO E UM BÔNUS EXCLUSIVO! Ao eliminar suposições e análises manuais complexas, o Scalper Vault permite que você foque
Volatility Master for MetaTrader is a real-time dashboard tool that scans up to  50 symbols  to identify high-volatility , trending markets instantly. With bullish/bearish signals, customizable alerts, and a user-friendly interface, it helps you avoid range-bound conditions and focus on high-probability trades. Clarity leads to confidence. Trade confidently and protect your capital effectively with this powerful dashboard. We don't offer free or bonus indicators in exchange of reviews from you.
O   SR Liquidity   é um indicador de trading projetado para revelar as zonas ocultas onde a liquidez do mercado se concentra e o preço reage com maior intensidade. Essas áreas específicas de liquidez funcionam como níveis poderosos de suporte e resistência, oferecendo um mapa claro de onde é mais provável que o mercado reverta. Em vez de traçar linhas comuns de Suporte e Resistência, o SR Liquidity analisa o comportamento real dos preços para detectar as zonas onde se acumulam pressões de compra
Mais do autor
OhMyGold
Nathan Allane Philippe Keliby
OHMYGOLD Multi-Strategy XAUUSD Expert Advisor for MetaTrader 5 5 Trading Systems. 1 Gold Market. OHMYGOLD is a multi-strategy Expert Advisor designed specifically for XAUUSD / Gold trading on MetaTrader 5 . It combines five distinct rule-based breakout systems , each operating on a different trading horizon and market structure. Every system can be enabled or disabled independently and assigned its own position-sizing and risk settings. Run a single system, combine several systems, or operate al
Filtro:
Sem comentários
Responder ao comentário