Trade Radar Scan SMC Scanner All Pair Timeframe
- Indicadores
- Versão: 3.40
- Ativações: 5

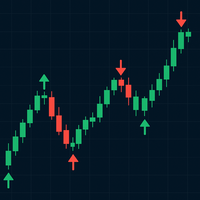
1. GENERAL OVERVIEW AND ARCHITECTURAL PHILOSOPHY. TradeRadar LITE V3.4 represents an advanced, quantitative analytical multi-symbol and multi-timeframe scanner indicator engineered exclusively for the MetaTrader 5 platform. The overarching architectural philosophy behind this software is to eliminate subjective chart reading by translating standard Price Action and Smart Money Concepts (SMC) into a strict, mathematically driven algorithmic scoring model. Unlike conventional indicators that rely on singular mathematical formulas such as basic oscillators or moving averages, this tool acts as a comprehensive market condition evaluator. It processes real-time data arrays through a complex 10-component algorithmic engine, assessing historical probability, volatility metrics, liquidity distribution, structural breaks, and trend alignment simultaneously. The primary objective of this software is to provide traders and MQL5 developers with objective, data-backed setup scores and statistical probability metrics. It serves as a highly robust foundational tool for technical analysis and decision-making rather than a standalone automated trading robot. The software does not execute trades automatically; instead, it functions as a visual dashboard, a statistical engine, a multi-pair scanner, and a signal generator designed to assist manual traders in structural analysis. Furthermore, it provides standard indicator data buffers for developers who wish to build automated Expert Advisors (EAs) based on its quantitative output.
2. CORE OPERATING PRINCIPLE, ALGORITHMIC LOGIC, AND STRICT NON-REPAINTING MECHANICS. The foundational operating principle of TradeRadar LITE V3.4 revolves around strict closed-bar confirmation processing, mathematically designated as the Bar 1 index in MQL5 array structures. The indicator is deliberately programmed to categorically reject any signal generation, zone drawing, or statistical calculation on the active, fluctuating current candle (Bar 0). All technical conditions—ranging from fractal swing detection to moving average slope normalization—are strictly evaluated only after the broker's server time registers the complete closure of the current timeframe's candle. Consequently, the indicator is mathematically bound to a 100% non-repainting framework. Once the algorithmic engine calculates the final adaptive score, prints a Buy or Sell signal arrow, or plots an Entry and Stop Loss zone on the chart, that graphical object and its underlying data buffer will remain permanently fixed at that specific timestamp and price level. The data will never shift, vanish, or dynamically recalculate if the market reverses in the future. The core logic engine evaluates bullish and bearish conditions independently. It computes a Bullish Raw Score and a Bearish Raw Score by checking the boolean state of 10 specific structural events. If a directional score exceeds the user-defined minimum threshold and outpaces the opposing direction's score, a valid setup state is triggered. The underlying mathematics utilize dynamic arrays (MqlRates) and custom functions to calculate True Range and Exponential Moving Averages, ensuring that all data is synchronized perfectly with the MT5 execution environment.
3. DETAILED BREAKDOWN OF THE 10-COMPONENT SCORING ENGINE. The final algorithmic score is an aggregation of 10 independent technical modules, each targeting a specific aspect of market microstructure. COMPONENT 1 (Higher Timeframe Alignment Bias): The engine retrieves data from a user-specified Higher Timeframe using the CopyRates function. It calculates three Exponential Moving Averages (Fast, Medium, and Slow). A bullish alignment is validated only if EMA Fast is greater than EMA Medium, which in turn must be greater than EMA Slow on the closed HTF bar, ensuring micro-setups do not fight macro-trends. COMPONENT 2 (Market Regime and Slope Normalization): On the execution timeframe, the software calculates the slope of the Fast EMA by subtracting the previous bar's value from the current bar's value. This slope is normalized by dividing it by the current Average True Range (ATR), preventing false strong trend readings during periods of low volatility but high visual slope. COMPONENT 3 (Liquidity Sweeps): This module utilizes a highly sensitive fractal detection formula scanning backward and forward by the InpSwingLookback parameter to establish valid Swing Highs (Buy-Side Liquidity) and Swing Lows (Sell-Side Liquidity). A sweep is mathematically confirmed if the current candle pierces the swing level but closes back within the structural range, provided the rejection wick constitutes a minimum percentage of the total candle range defined by InpSweepWickRatio. COMPONENT 4 (Break of Structure): A BOS is validated when the closing price of the signal candle completely eclipses the previously established fractal Swing point, indicating committed volume. COMPONENT 5 (Algorithmic Price Displacement): To filter out weak price action, this calculates the average absolute body size of historical candles. A valid displacement requires the signal candle's body to be strictly larger than this average, and its total high-to-low range must exceed the ATR multiplied by InpDisplacementATR. COMPONENT 6 (Fair Value Gaps): The algorithm checks a three-candle sequence to detect structural pricing imbalances, confirmed if the Low of the current candle is strictly higher than the High of the candle three periods ago. COMPONENT 7 (Tick Volume Expansion): Evaluates the broker's tick volume data stream, requiring the signal candle's volume to be at least 20% higher than the historical moving average of volume. COMPONENT 8 (Trading Session Synchronization): Checks the server time against defined London and New York session parameters, assigning higher scores during high-liquidity overlaps. COMPONENT 9 (Structural Risk-to-Reward Profiling): Measures the exact pip distance from Entry to Invalidation (Stop Loss) and from Entry to the opposing liquidity pool. If the theoretical target distance is at least twice the invalidation distance (RR >= 2.0), it adds points to the score. COMPONENT 10 (Micro Momentum): A simple filter requiring the current candle to close bullish and strictly higher than the previous candle's close, ensuring immediate short-term directional alignment.
4. THE MACHINE LEARNING ADAPTIVE SCORING MODULE AND HISTORICAL VIRTUAL BACKTESTING. One of the most complex technical features of this software is its Adaptive Scoring Engine. Market conditions are in a constant state of flux; a setup variable that performed exceptionally well during a strong trending quarter may perform poorly during a ranging quarter. To account for this, the indicator abandons static scoring weights and utilizes an adaptive historical lookback mechanism. The algorithm executes a virtual backtester loop scanning historical data up to the InpAdaptiveLookback limit. It identifies past instances where specific components were triggered and measures the maximum favorable excursion (MFE) and maximum adverse excursion (MAE) against the historical ATR. It iterates through forward bars (up to InpBacktestBars) to check if the asset theoretically reached a 1:1 target before hitting a structural stop loss. Based on the historical win rate of each specific component on that specific symbol and timeframe, the algorithm dynamically adjusts the component's weight multiplier using the V3ApplyWeight function. To prevent extreme skewing or mathematical overflow, the adjusted weight is clamped between the InpAdaptiveMinWeight (0.50x) and InpAdaptiveMaxWeight (1.50x) limits. Through this recursive mechanism, the indicator learns which technical components are currently the most reliable for the specific asset being analyzed, intelligently allocating higher score distributions to setups that align with historically proven structural behaviors while dynamically punishing underperforming technical patterns.
5. MULTI-SYMBOL AND MULTI-TIMEFRAME SCANNER MECHANICS AND GRAPHICAL USER INTERFACE. The TradeRadar scanner is a highly optimized graphical interface that prevents the need for traders to open dozens of physical charts simultaneously. The scanner runs an iterative loop across all symbols specified in the input string and all configured timeframes. For every symbol-timeframe combination, it silently loads the historical arrays (MqlRates, EMAs, ATR) in the background memory without launching new windows. The scanner panel projects the computed data into an organized visual matrix utilizing OBJ_LABEL elements, displaying the Symbol, Timeframe, Adaptive Score, Raw Score, Setup Probability, Reaction Rate, and Current State. Users can interact directly with the GUI using programmatic header buttons that capture CHARTEVENT_OBJECT_CLICK events. The SORT button cycles through sorting algorithms: Highest Score descending, Highest Probability, alphabetical Symbol order, or filtering to push Active Signals to the top. The FLT button toggles a visual filter that hides all WAIT states, ensuring the scanner only displays actionable data rows. Furthermore, clicking the OPEN button next to any data row invokes the ChartSetSymbolPeriod function, instantly switching the current chart's symbol and timeframe to match the selected asset for immediate deep-dive analysis. The interface is meticulously designed using absolute pixel coordinates and Monospace fonts (Consolas) to ensure perfect tabular alignment across all screen resolutions without utilizing resource-heavy canvas rendering.
6. ON-CHART STATISTICAL INTELLIGENCE AND AUTOMATIC ZONE GENERATION. Beyond generating signals, the indicator computes a massive amount of historical backtest data to provide transparency regarding the mathematical edge of the setups. The Statistics Panel displays the Setup Probability, representing the percentage of historical setups meeting the minimum score threshold that successfully reached a 1:1 target before hitting invalidation. It calculates the Liquidity Reaction Rate, measuring how often price actually bounced after sweeping a liquidity level within a strict reaction window. It also displays Session Continuation Rates and simulated Backtest Metrics, including Profit Factor (PF), total Net Return in R-multiples, and Maximum Drawdown over the defined lookback period. When a valid signal is detected on the current bar, the indicator utilizes MetaTrader's graphical object engine to draw operational zones directly on the chart. The Entry Zone is rendered as an OBJ_RECTANGLE extending from the closing price, buffered vertically by InpEntryATRBuffer. The Invalidation Line (Stop Loss) is placed exactly at the protective fractal swing point and extended further out by InpSLATRBuffer to mathematically protect against spread widening and slippage spikes. Take Profit targets are projected automatically using exact risk-multipliers (InpTP1R, InpTP2R, InpTP3R), providing the user with immediate, objective, and fully calculated exit coordinates without requiring manual measurement tools.
7. COMPLETE AND EXHAUSTIVE INPUT PARAMETERS DOCUMENTATION. CORE SETTINGS: InpSwingLookback (Integer, Default 3) defines the required number of strictly lower highs or higher lows on both the left and right sides of a specific focal candle to mathematically classify it as a confirmed fractal swing point within the structural array. InpATRPeriod (Integer, Default 14) dictates the rolling window length utilized to calculate the Average True Range for all volatility-based displacement and buffer calculations. InpAvgBodyPeriod (Integer, Default 20) is the lookback array length utilized to determine the arithmetic mean of absolute candle body sizes. InpDisplacementATR (Double, Default 1.20) is the multiplier applied to the current ATR; a candle's total high-to-low range must exceed this product to be flagged as a valid momentum displacement. InpSweepWickRatio (Double, Default 0.35) is the minimum threshold ratio; to confirm a liquidity rejection, the wick protruding through the liquidity line must be at least this percentage of the candle's total range. InpMinScore (Double, Default 70.0) is the absolute minimum aggregated Adaptive Score out of 100 points that a directional bias must achieve to trigger visual arrows, draw zones, and send terminal alerts. MULTI-SYMBOL & SCANNER SETTINGS: InpSymbols (String, Default EURUSD,GBPUSD,USDJPY,USDCHF,USDCAD,AUDUSD,NZDUSD) is a comma-separated array of instrument names resolved against the broker's Market Watch. InpTimeframes (String, Default M15,M30,H1,H4,D1) specifies the standard MetaTrader timeframes the scanner must iterate through. InpShowScanner (Boolean, Default true) toggles the rendering phase of the GUI scanner panel. InpScannerSortBy (Enum, Default SORT_SCORE_DESC) dictates the initial array sorting method. InpScannerFilterOnly (Boolean, Default false) instructs the scanner to internally skip rendering any matrix row that does not possess an active BUY or SELL state. InpScannerMaxRows (Integer, Default 8) is a graphical constraint limiting physical Y-axis rows. InpScannerBars (Integer, Default 500) is the maximum depth of the historical array copied into RAM for scanner calculations; lowering this improves CPU performance. InpScannerX (Integer, Default 320) and InpScannerY (Integer, Default 20) are the exact pixel coordinates anchoring the scanner GUI. TREND & SMC FEATURES: InpEMA_Fast (Integer, Default 20), InpEMA_Mid (Integer, Default 50), and InpEMA_Slow (Integer, Default 200) define the periods for the Exponential Moving Averages used strictly in Regime determination. InpHTF (Enum, Default PERIOD_H1) selects the Higher Timeframe queried to determine overarching directional bias. InpUseLiquidity (Boolean, Default true) enables the mapping of historical fractal swing highs and lows. InpUseSweep (Boolean, Default true) allocates score weight if price delivery sweeps and rejects a mapped liquidity level. InpUseBOS (Boolean, Default true) allocates score weight if price delivery closes past a mapped liquidity level. InpUseDisplacement (Boolean, Default true) enables the comparative body size and ATR expansion module. InpUseFVG (Boolean, Default true) enables the three-bar array check to score Fair Value Gaps. InpUseVolume (Boolean, Default true) commands the algorithm to read the tick_volume property and compare it against the rolling average. SESSION TIMES: InpUseSession (Boolean, Default true) cross-references the bar time to assign momentum scores. InpLondonStartHour (Integer, Default 8), InpLondonEndHour (Integer, Default 12), InpNYStartHour (Integer, Default 13), and InpNYEndHour (Integer, Default 17) define the broker server hours for major liquidity windows. DISPLAY & UI SETTINGS: InpShowDashboard (Boolean, Default true) controls the instantiation of the primary dashboard objects. InpDashboardFontSize (Integer, Default 8) and InpScannerFontSize (Integer, Default 8) regulate the OBJPROP_FONTSIZE for UI texts. InpShowLevels (Boolean, Default true) toggles automatic creation of OBJ_HLINE objects for liquidity and FVG boundaries. InpShowSignals (Boolean, Default true) toggles the rendering of OBJ_ARROW graphical objects. InpShowReasons (Boolean, Default true) enables text tags explaining the structural triggers. ALERTS: InpEnableAlerts (Boolean, Default true) enables native MetaTrader pop-ups. InpAlertOnlyValid (Boolean, Default true) suppresses alerts for lower-probability events. COLORS: InpBullColor (Color, Default clrLimeGreen), InpBearColor (Color, Default clrTomato), InpNeutralColor (Color, Default clrGold), InpPanelColor (Color, Default clrBlack), and InpTextColor (Color, Default clrWhite) define the exact hex/RGB values for all visual rendering elements. ADAPTIVE SCORING SETTINGS: InpAdaptiveScoring (Boolean, Default true) activates the historical simulation loop to continuously update component weights. InpAdaptiveLookback (Integer, Default 200) is the strict limit on qualified historical setups processed. InpAdaptiveMinWeight (Double, Default 0.50) is the floor boundary for the weight multiplier. InpAdaptiveMaxWeight (Double, Default 1.50) is the ceiling boundary. InpAdaptivePerSymbol (Boolean, Default true) runs independent historical simulation loops for every symbol in the scanner. BACKTEST & STATISTICS: InpShowStatistics (Boolean, Default true) renders the secondary historical intelligence UI. InpStatsLookback (Integer, Default 300) limits the array depth for probability calculations. InpReactionBars (Integer, Default 8) is the maximum duration in bars for price to reverse post-sweep. InpReactionATR (Double, Default 0.50) is the required pip distance of the reversal. InpProbMinScore (Double, Default 70.0) acts as a historical filter for Win/Loss calculations. InpBacktestLookback (Integer, Default 300) dictates the array length for Equity Curve simulations. InpBacktestBars (Integer, Default 20) sets a time-based expiration for simulated trades. AUTOMATIC ZONES: InpShowZones (Boolean, Default true) creates filled OBJ_RECTANGLE structures for risk exposure. InpEntryATRBuffer (Double, Default 0.10) calculates the vertical thickness of the entry zone. InpSLATRBuffer (Double, Default 0.30) adds a mathematical buffer to the Stop Loss level. InpTP1R (Double, Default 1.00), InpTP2R (Double, Default 2.00), and InpTP3R (Double, Default 3.00) are multipliers defining precise coordinates for Take Profit targets based on the measured SL risk distance. EA INTEGRATION: InpEnableSignalBuffers (Boolean, Default true) acts as the memory allocation switch, actively writing state data to zero-indexed public arrays. InpBufferMinScore (Double, Default 70.0) is a strict gating mechanism; the indicator outputs EMPTY_VALUE unless the score exceeds this parameter.
8. EXPERT ADVISOR (EA) INTEGRATION GUIDE AND MEMORY BUFFER MAPPING. TradeRadar LITE V3.4 is constructed with automated trading development strictly in mind. While it functions visually, it maps critical quantitative data to 4 distinct memory buffers that can be retrieved by any Expert Advisor utilizing the native iCustom() MQL5 function. Buffer 0 (Buy Signal Buffer) returns a double value of 1.0 when a validated Bullish setup triggers, and returns EMPTY_VALUE during all other states. Buffer 1 (Sell Signal Buffer) returns a double value of -1.0 when a validated Bearish setup triggers, returning EMPTY_VALUE otherwise. Buffer 2 (Adaptive Score Buffer) continuously outputs the current aggregated Adaptive Score as a double floating-point value ranging from 0.0 to 100.0. Buffer 3 (Direction State Buffer) continuously outputs the current overarching market trajectory assessment, returning 1.0 for Bullish bias, -1.0 for Bearish bias, and 0.0 for Neutral/Wait states. To properly integrate this system into an EA and avoid reading fluctuating data, developers must query the buffers on Shift 1 (the last completely closed bar) to ensure complete non-repainting stability, as the indicator's internal logic strictly finalizes all computations at the exact open tick of a new bar.
9. MANDATORY RISK DISCLOSURE AND FINANCIAL DISCLAIMER. Trading foreign exchange, commodities, cryptocurrencies, and other financial derivatives on margin involves a significant level of risk and may not be suitable for all investors. The high degree of leverage available in these markets can work against you as well as for you, potentially leading to losses exceeding initial deposits. Past performance, including the historically simulated probabilities, reaction rates, and backtest metrics generated mathematically by this indicator, does not guarantee future results or identical forward-testing performance. This software is exclusively an analytical, statistical, and operational utility designed to assist traders in technical analysis by quantifying standard market structures. It does not provide direct financial advice, investment recommendations, nor does it guarantee financial profit. The statistical data rendered by this tool is strictly for observational and educational purposes. Always thoroughly test the product's functionality, quantitative logic, and operational behavior on a simulated Demo account for an extended period to fully understand its structural mechanics before ever considering its deployment in live trading environments with real capital.