QuantMatrix Historical Move Probability

  • Indicadores
  • Rafael Barreto Haddad
    Rafael Barreto Haddad
    • Rafael Haddad → QuantMatrix → quantitative trading research em  Quantitative Trading Systems Researcher
    • Brasil
    • 618
    Criador da série de pesquisa QuantMatrix para MetaTrader 5.
    Desenvolvo sistemas quantitativos de trading, Expert Advisors adaptativos e ferramentas de análise de mercado baseadas em evidências históricas, validação de estratégias e avaliação contínua de modelos.
  • Versão: 2.10
  • Ativações: 5

QuantMatrix Historical Move Probability

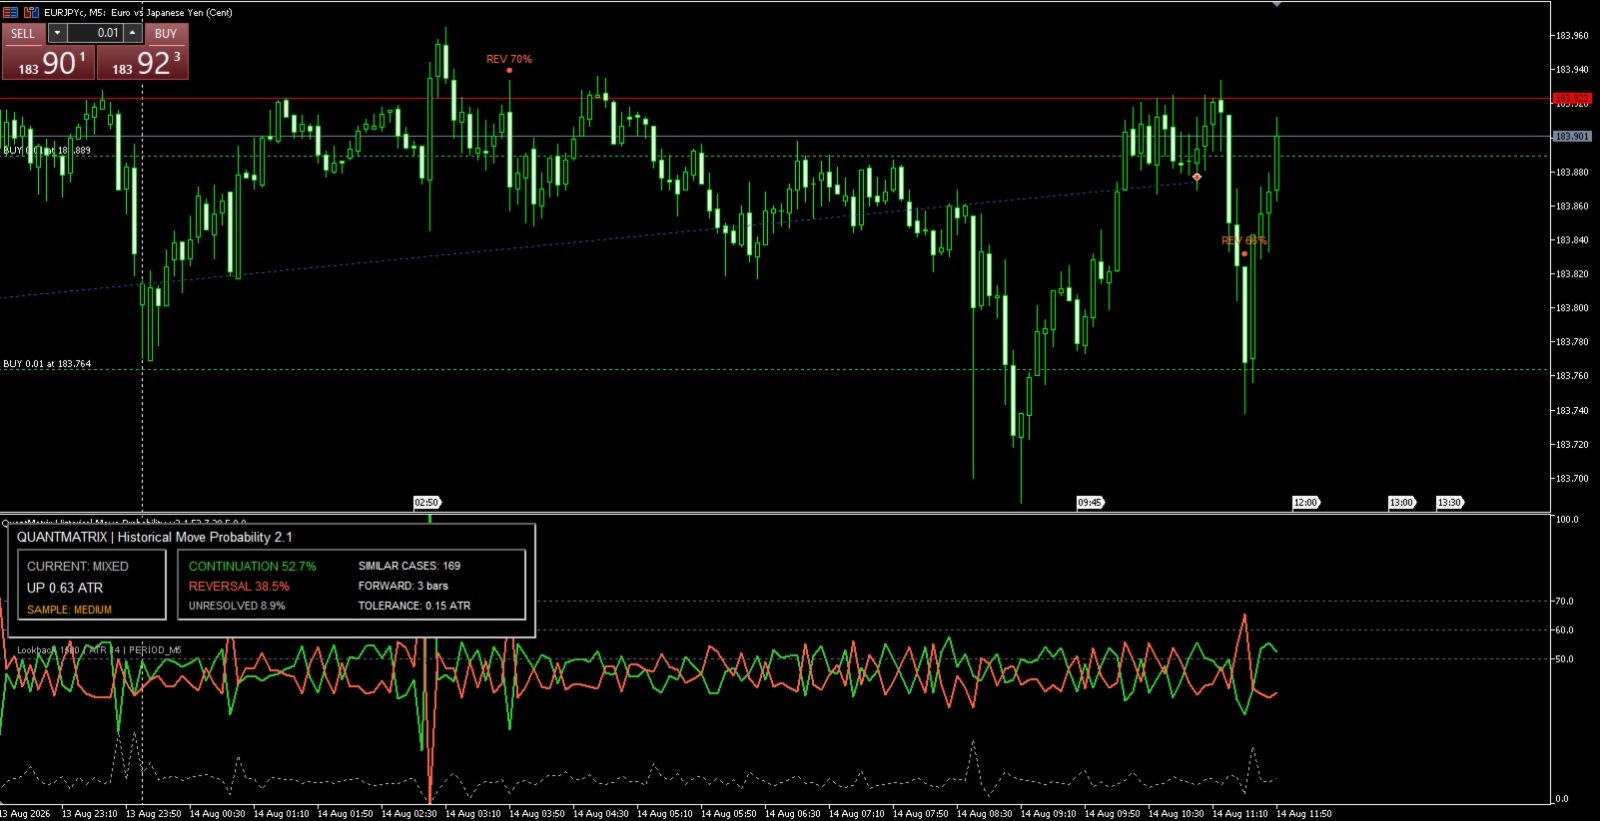
QuantMatrix Historical Move Probability is a statistical indicator for MetaTrader 5 that compares the current price movement with similar movements found in the historical data of the selected symbol and timeframe.

Price movements are normalized using Average True Range (ATR). This allows movements from different historical periods to be compared relative to the volatility present at each period.

The indicator searches the configured historical sample for movements within the selected similarity tolerance.

For the historical cases identified as similar, the indicator evaluates price behavior over a configurable number of subsequent bars.

The results are classified into three groups:

Continuation
Reversal
Unresolved

Continuation means that the subsequent historical movement continued in the same direction as the analyzed movement.

Reversal means that the subsequent historical movement moved in the opposite direction.

Unresolved represents cases where the subsequent movement remained within the configured ATR outcome threshold.

The indicator displays the evolution of these historical frequencies in a dedicated subwindow.

Main information displayed

  • Current move expressed in ATR
  • Current movement direction
  • Number of similar historical cases
  • Continuation percentage
  • Reversal percentage
  • Unresolved percentage
  • Historical sample quality
  • Configured forward analysis period
  • Similarity tolerance
  • Historical Continuation, Reversal and Unresolved curves

The price chart can also display compact historical markers when Continuation or Reversal reaches the configured dominance threshold.

Green markers represent historical Continuation dominance.

Red markers represent historical Reversal dominance.

The percentage shown beside each marker is the historical frequency calculated by the indicator for that bar.

Features

  • ATR-normalized historical movement comparison
  • Configurable historical lookback
  • Configurable similarity tolerance
  • Configurable forward analysis period
  • Configurable outcome threshold
  • Continuation frequency
  • Reversal frequency
  • Unresolved frequency
  • Historical sample count
  • Sample quality classification
  • Dedicated statistical subwindow
  • Historical probability-frequency curves
  • Compact chart markers
  • Automatic symbol detection
  • Automatic timeframe detection
  • Does not open, modify or close trades

QuantMatrix Research Series

QuantMatrix Historical Move Probability is part of the QuantMatrix series of quantitative market analysis tools developed by Rafael Haddad.

The percentages displayed by the indicator are frequencies calculated from the selected historical sample and parameters. They are not guaranteed probabilities of future market behavior and do not guarantee trading results.


Mais do autor
QuantMatrix Wick Pressure QuantMatrix Wick Pressure is a technical indicator for MetaTrader 5 that measures the relationship between upper and lower candlestick wicks and converts this information into a numerical pressure measurement. Candlestick wicks represent price movement that occurred beyond the candle body before price returned from those levels. The indicator measures this rejection behavior over consecutive candles and displays the result in a separate indicator window. Positive values
FREE
QuantMatrix Probability AI Free QuantMatrix Probability AI Free is a technical indicator for MetaTrader 5 that combines several measurements of current market conditions into three numerical estimates. The indicator uses exponential moving averages, Relative Strength Index (RSI), Average True Range (ATR) and the current price position in its calculation. These measurements are combined into a normalized market score. The resulting information is displayed on the chart as: BUY percentage SELL p
FREE
QuantMatrix Volatility Regime QuantMatrix Volatility Regime is a technical indicator for MetaTrader 5 that evaluates the current volatility of the selected symbol and timeframe. The indicator uses Average True Range (ATR) to compare current volatility with a historical baseline calculated from previous bars. Based on this comparison, the current market condition is classified into one of four volatility regimes: LOW – current volatility is below the historical baseline. NORMAL – current volatil
FREE
QuantMatrix FXGold V8
Rafael Barreto Haddad
QuantMatrix FX+Gold V8.4 Trading Quantitativo Adaptativo para Forex e Ouro QuantMatrix FX+Gold V8.4 é um Expert Advisor multiativo avançado desenvolvido para Forex e Ouro (XAUUSD) . Em vez de depender de uma única estratégia fixa ou de uma combinação convencional de indicadores, o QuantMatrix utiliza uma arquitetura orientada à pesquisa para descobrir, validar, classificar e monitorar continuamente múltiplos modelos derivados do comportamento histórico de cada mercado. O princípio central é simp
QuantMatrix Candle Exhaustion QuantMatrix Candle Exhaustion is a technical indicator for MetaTrader 5 that identifies candles showing predefined price expansion and wick characteristics. The indicator compares the range of the current candle with the average range of previous candles. When the candle range exceeds the configured historical range threshold, its upper and lower wicks are evaluated. A bullish exhaustion marker can be displayed when an expanded bullish candle also contains the requi
QuantMatrix False Breakout Detector QuantMatrix False Breakout Detector is a technical indicator for MetaTrader 5 that identifies potential failed breakouts of recent price ranges. The indicator calculates the highest high and lowest low within a configurable historical period. It then evaluates whether the current price moves beyond one of these levels by a minimum volatility-adjusted distance and subsequently closes back inside the previous range. Average True Range (ATR) is used to adjust the
QuantMatrix Probability AI PRO QuantMatrix Probability AI PRO is a technical indicator for MetaTrader 5 designed to evaluate current market conditions and present them as BUY, SELL and NEUTRAL percentage estimates. The indicator combines several market measurements, including trend, momentum, volatility, price position, candlestick wick behavior and breakout conditions. It also compares the current market state with similar historical situations found in the selected symbol and timeframe. The hi
Filtro:
Sem comentários
Responder ao comentário