Multi Anchor VWAP
- Indicadores
- Versão: 4.13
- Atualizado: 23 agosto 2026
- Ativações: 5

O Multi Anchor VWAP permite ancorar manualmente a linha de VWAP (Preco Medio Ponderado por Volume) em qualquer candle escolhido, em vez de reiniciar automaticamente no inicio de cada sessao, dia, semana ou mes.
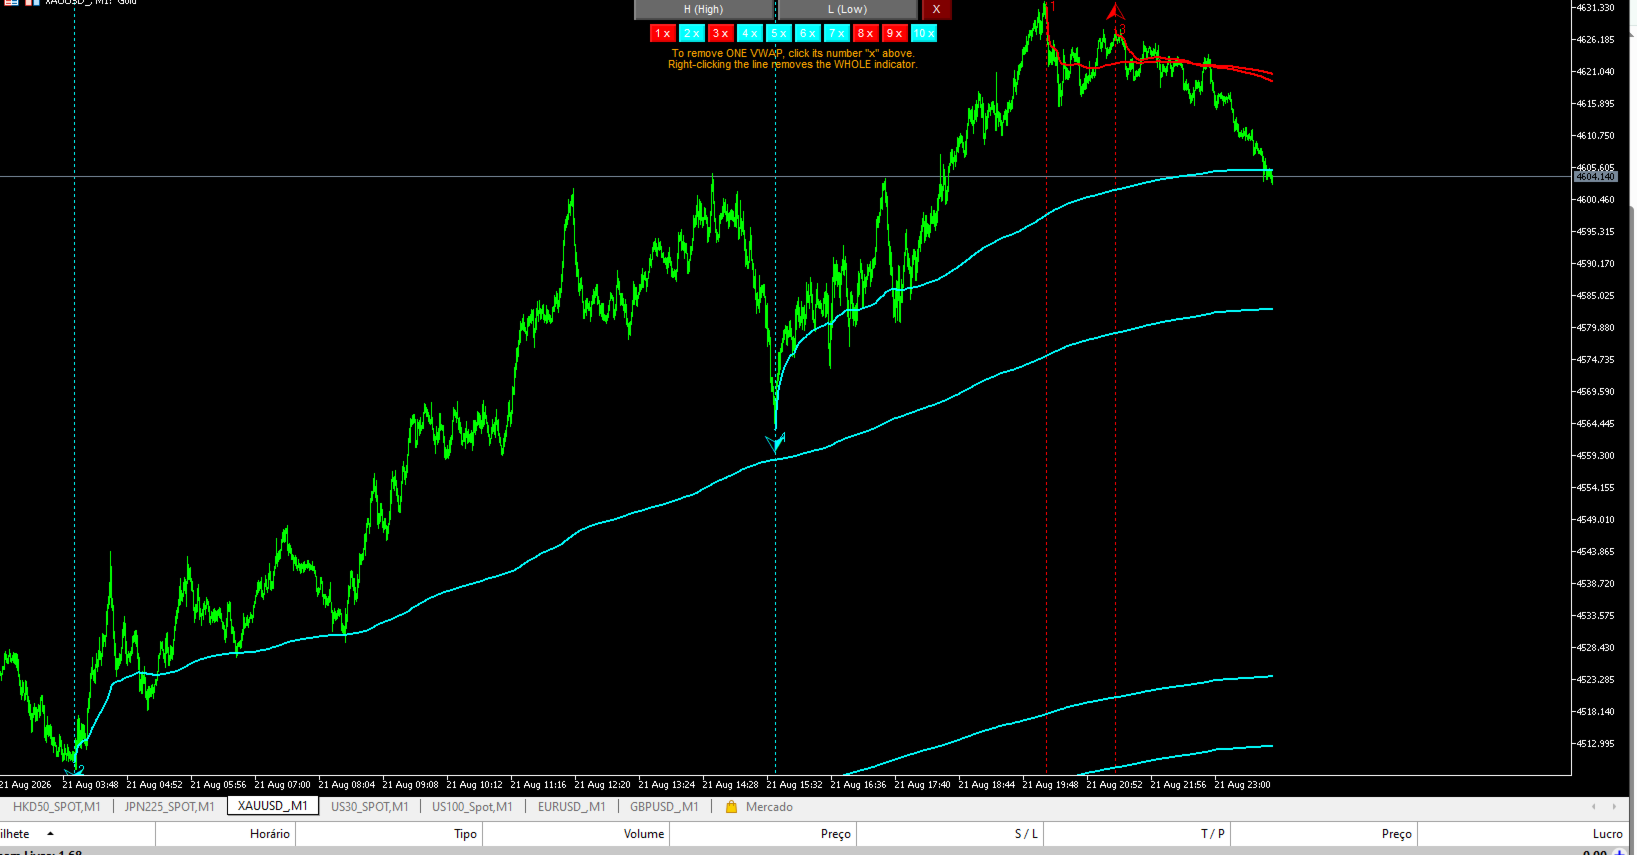
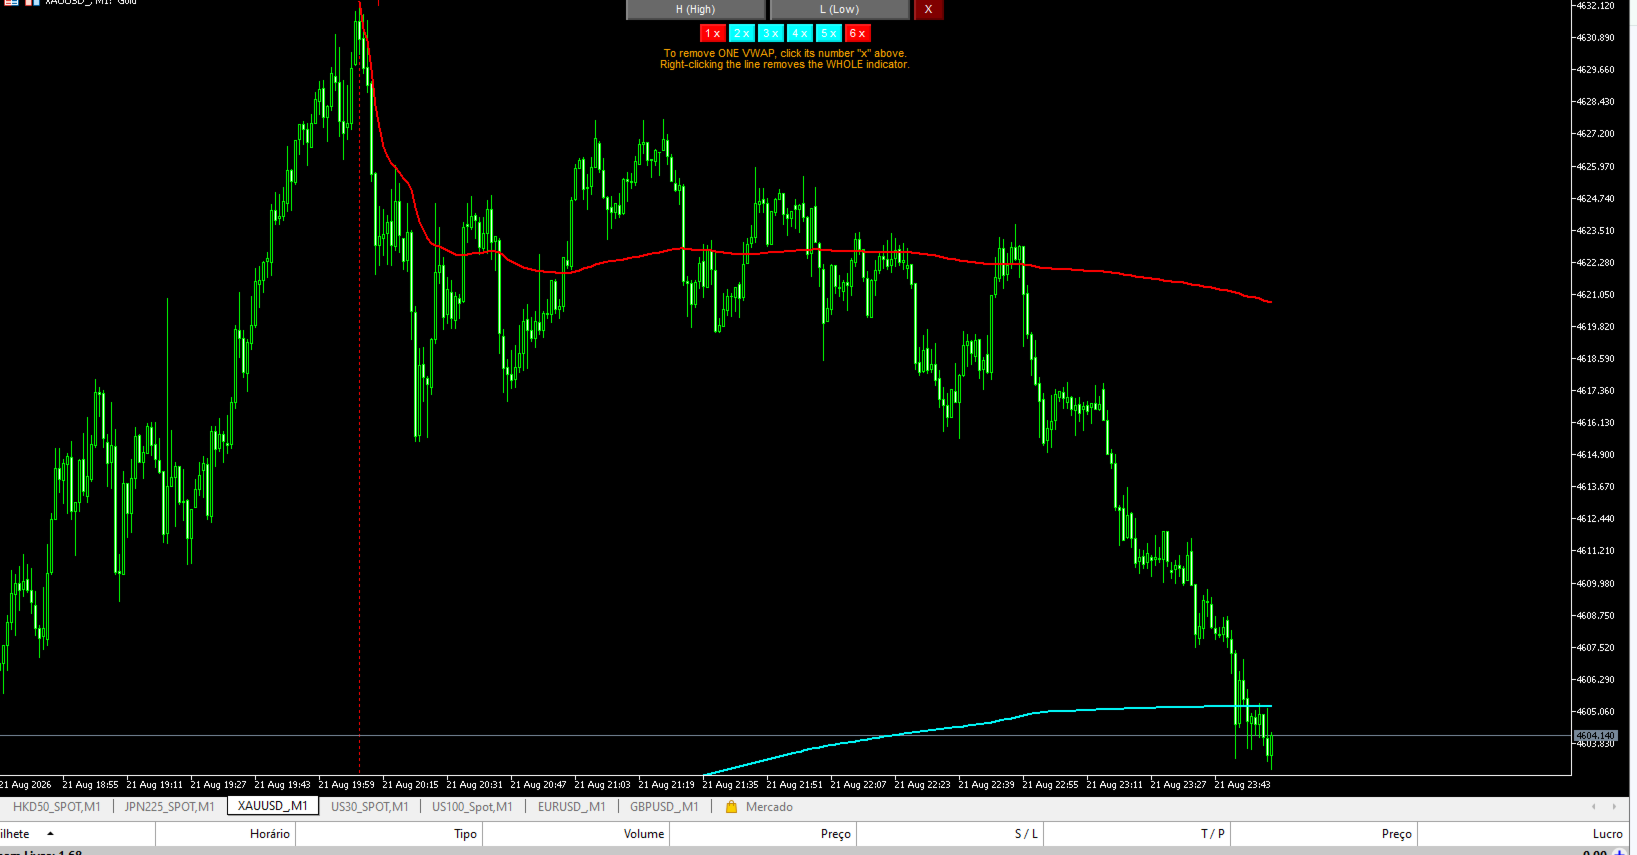
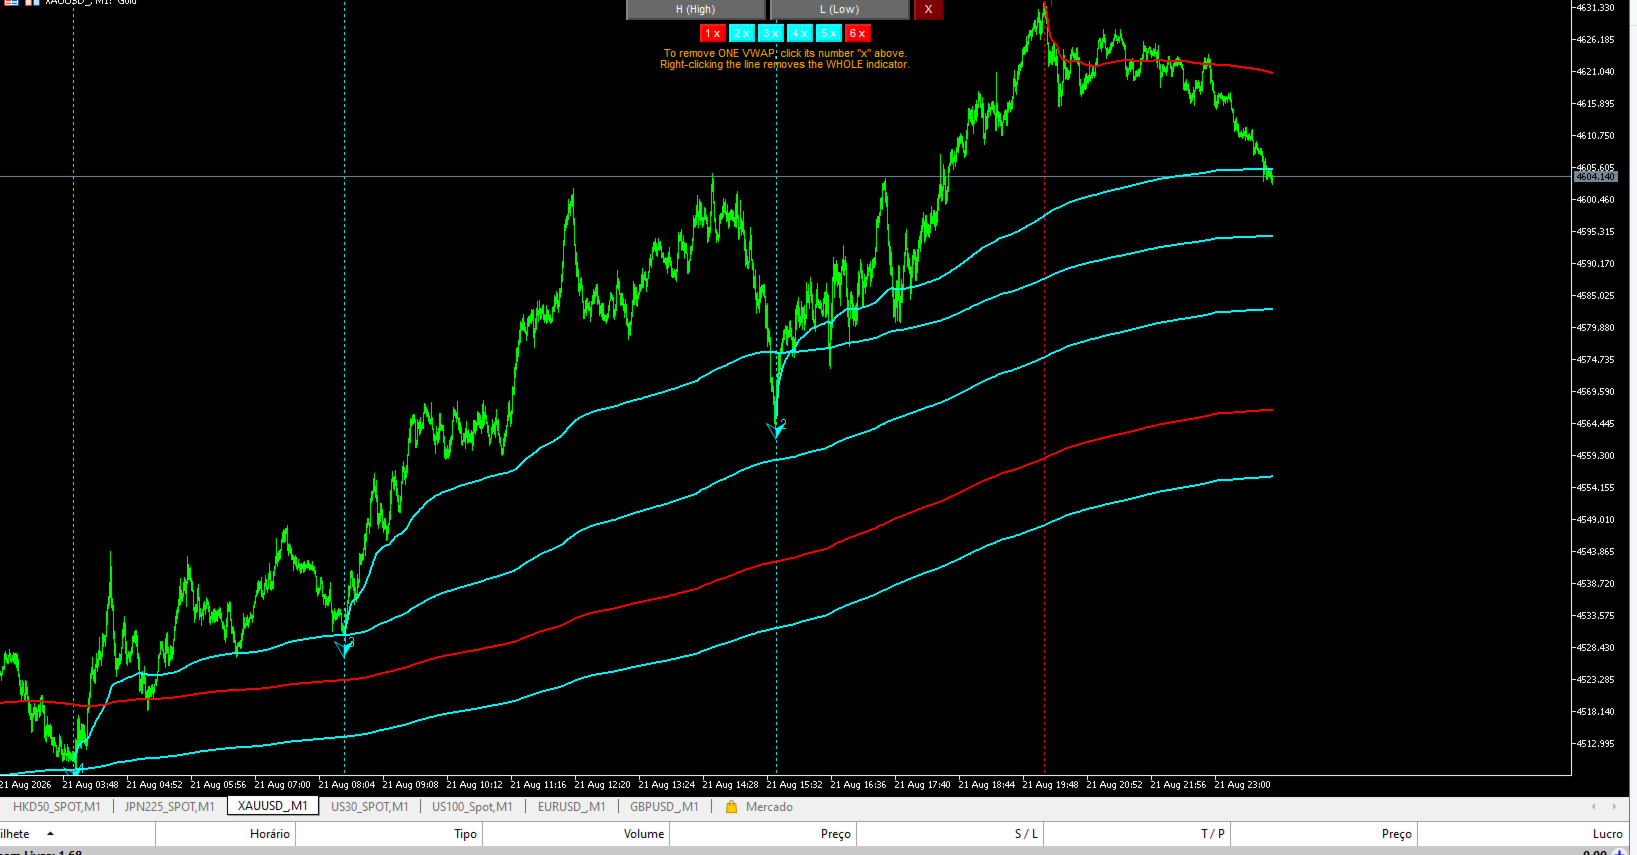
Como funciona: clique no botao H ou L, depois clique no candle desejado, ou use as setas Cima e Baixo do teclado para navegar ate ele e confirme com Enter. A linha de VWAP comeca exatamente na maxima ou minima daquele candle e acumula a partir dali. E possivel colocar varias ancoras ao mesmo tempo, ate 20, cada uma rastreada e colorida de forma independente, vermelho para ancoras de maxima e azul claro para ancoras de minima por padrao, totalmente configuravel.
Recursos:
- Multiplas ancoras simultaneas, cada uma com seu proprio botao numerado para remover individualmente.
- Navegacao por teclado com as setas, Enter ou Espaco, como alternativa ao clique, para escolher o candle com precisao.
- Uma seta de previa acompanha o mouse antes de confirmar o ponto de ancoragem.
- Cores, espessura da linha e posicao do painel sao configuraveis.
- Sem repintura: cada linha de VWAP so avanca a partir do momento em que foi ancorada.
- Funciona em qualquer simbolo, timeframe e tipo de conta.
Como os traders usam:
Ancorar a VWAP numa maxima, minima ou evento especifico, como um candle de noticia, a abertura de uma sessao, ou um ponto de virada, mostra o preco medio pago pelos participantes do mercado desde aquele ponto de referencia. Preco operando acima de uma VWAP ancorada costuma ser lido como forca em relacao aquela referencia, e abaixo como fraqueza. Varias ancoras permitem comparar diversos pontos de referencia no mesmo grafico ao mesmo tempo.
Esta e uma ferramenta de analise visual. Ela nao abre, modifica nem fecha operacoes.