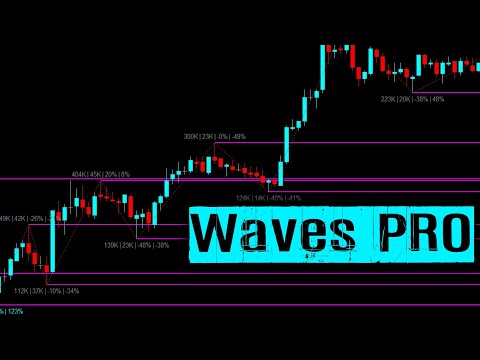
Waves PRO

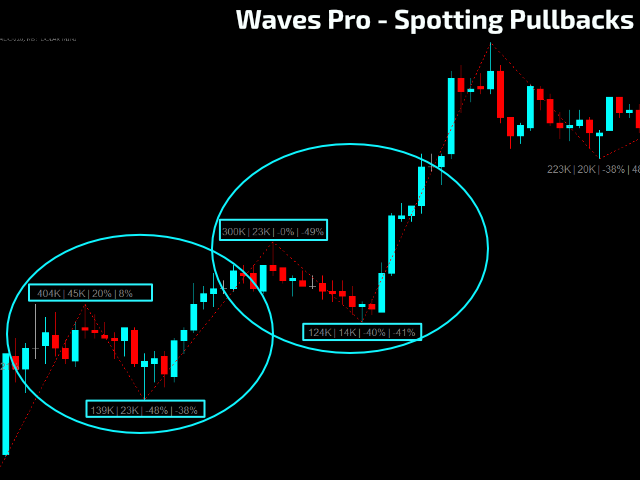
For those who appreciate Richard Wyckoff approach for reading the markets, we at Minions Labs designed a tool derived - yes, derived, we put our own vision and sauce into this indicator - which we called Waves PRO. This indicator provides a ZigZag controlled by the market volatility (ATR) to build its legs, AND on each ZigZag leg, we present the vital data statistics about it. Simple and objective.

This indicator is also derived from the great book called "The Secret Science of Price and Volume" by Timothy Ord (2008).


WHAT EXACTLY DOES THIS INDICATOR DO?

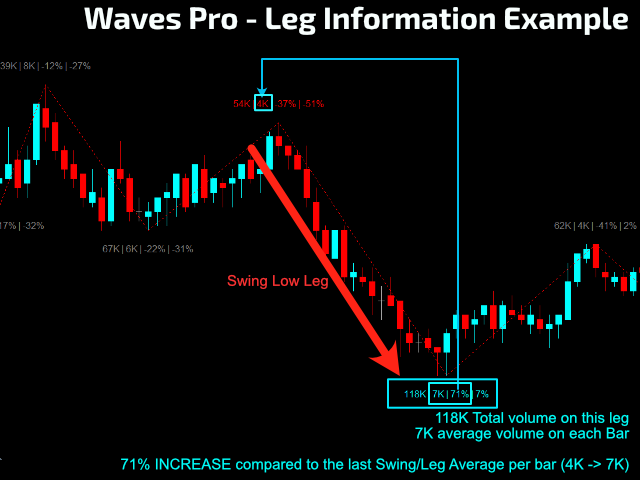
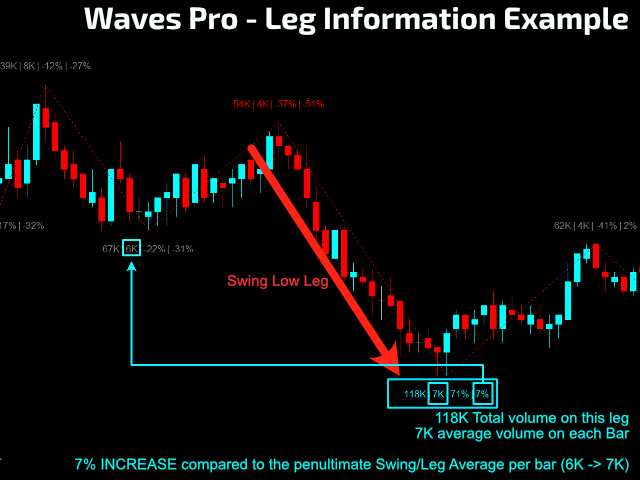
Shows vital VOLUME information on each leg on the Price Chart:

  1. Total Volume of the leg.
  2. Average Volume in each candle of the leg.
  3. Last leg % Delta variation on volume.
  4. Penultimate leg % Delta variation on volume

WHY IS THIS IMPORTANT?

Volume is one of the most underrated information for a vast majority of the traders worldwide. Obviously not all exchanges provide Volume information on their platform, but if you have this information available, WHY not use it in your favor??

If you don't know how to analyze or take advantage of the Volume information on your trades, we strongly suggest the reading of the cool book written by Timothy Ord. It will open you mind to a new kind of analysis and enhance your success rate to a new level.
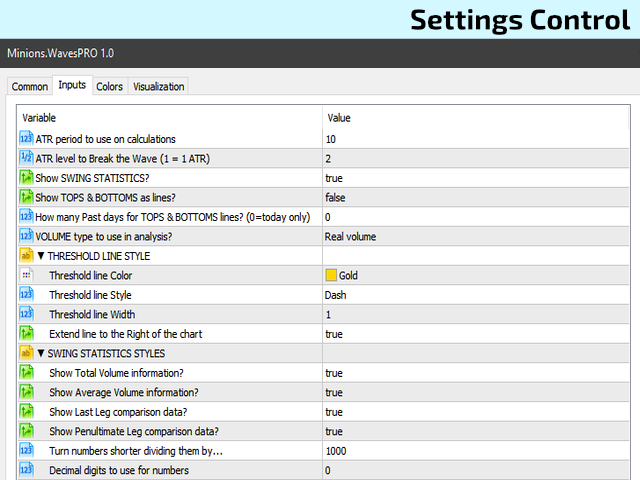
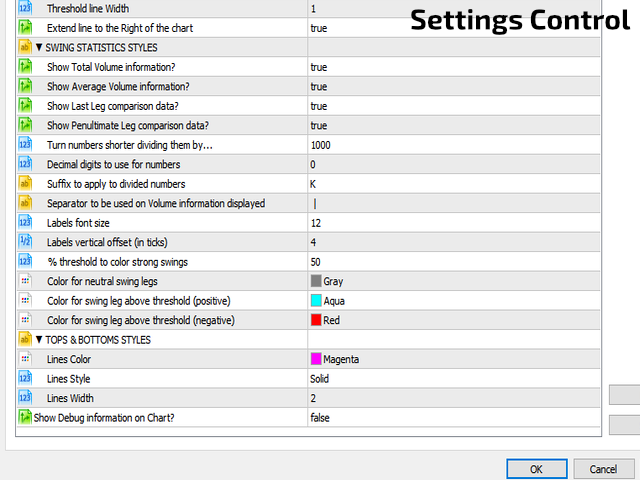

SETTINGS / FEATURES

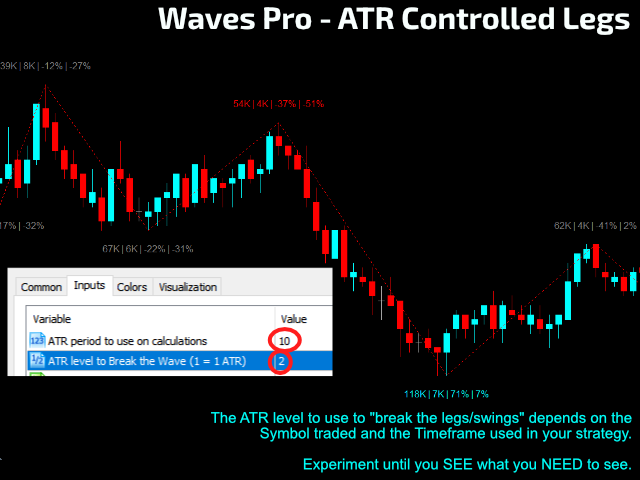
  • ATR period (bars) to analyze on the calculations of the legs. If you don't know what ATR is, YOU MUST. This is one of the BEST measurements of market breadth you can have on your toolbox. That's why we used ATR instead of arbitrary values do "break" the legs on our ZigZag.
  • Which ATR level do you want to use to break each wave/leg.
  • Show (ON/OFF) each wave/swing/leg statistics?
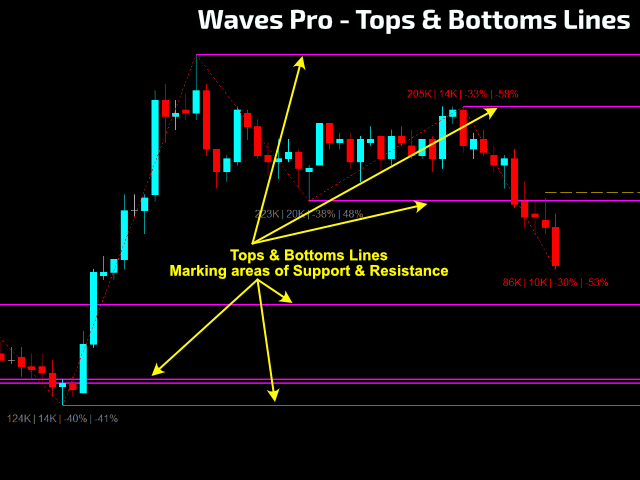
  • Show (ON/OFF) Tops & Bottoms lines extended as Support & Resistances?
  • How many days do you want for Tops & Bottoms lines?
  • Volume Type to use on calculations (Real Volume OR Ticks)?
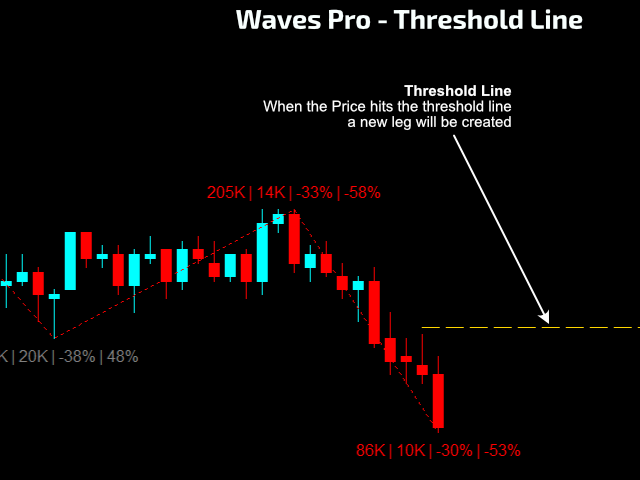
  • Threshold line Style - This is the line plotted on the chart to visually tell you where is the current level that, when hit, will build a new Wave/Leg.
  • Swing/Leg Statistics: Ability to turn ON/OFF Total Volume, Average candle Volume, Last Leg % Delta volume, Penultimate Leg % Delta volume.
  • Ability to shorten the numbers dividing them by... X
  • Decimal points to use for data/numbers.
  • Suffix text to apply to transformed numbers.
  • Separator character to use on each data element.
  • Font Size.
  • Vertical Offset for proper viewing.
  • % threshold to color strong Swings/Legs.
  • Colors for Neutral, Positive and Negative Swings/Legs.
  • Styles to be used for Tops & Bottoms lines.
  • Show Debug information of the indicator on the Experts tab?


Do you want to try the DEMO version first: Find it Here: Waves PRO DEMO.

* Due to the new MQL5 policy developers cannot provide DEMO versions to the general public here in this website anymore.


    DIDN'T FIND A FEATURE YOU NEED?

    No product is perfect for everyone. If you think you need a missing feature from our product just send us a message. We love feedback!


    ABOUT US...

    Flavio Jarabeck is the owner of MinionsLabs.com, an entrepreneurship focused on leveraging the knowledge and experience of professional traders through automated trading robots, freeing them to seek new opportunities and strategies in new markets and assets.


    Produtos recomendados
    The "MR Volume Profile Rectangles 5" indicator is a charting tool that displays trading volume at different price levels rather than time intervals. A key concept in volume profile is the point of control (POC) —the price level with the highest volume traded during the session or time range. While tools like VWAP or OBV provide volume trends, the "MR Volume Profile Rectangles 5" indicator offers granular detail about where the most market activity occurs at specific price levels. This makes it a
    Volume Profile V6
    Andrey Kolesnik
    4.67 (3)
    Indicador de perfil de volume de mercado + oscilador inteligente. Funciona em praticamente todos os instrumentos — pares de moedas, ações, futuros, criptomoedas, tanto em volumes reais quanto em ticks. É possível configurar a definição automática do intervalo de construção do perfil (por exemplo, por uma semana ou um mês, etc.), bem como definir o intervalo manualmente movendo os limites (duas linhas verticais: vermelha e azul). É exibido na forma de um histograma. A largura do histograma em um
    WAPV Weis Wave Chart Forex
    Eduardo Da Costa Custodio Santos
    O Weis Wave Chart Forex para MT 5 é um um indicador de Preço e Volume. A leitura de Preço e Volume foi amplamente divulgada através de Richard Demille Wyckoff com base nas três leis criadas por ele: Oferta e Demanda, Causa e Efeito e Esforço x Resultado. Em 1900 R.Wyckoff já utilizava o gráfico de Ondas em suas análises. Muitos anos depois, por volta de 1990 , David Weis Automatizou o gráfico de ondas de R. Wyckoff e hoje nós trazemos a evolução do gráfico de ondas de David Weis. Ele mostra
    CvdDeltaVolumes
    Parasbhai N Patel
    Delta + CVD & CVD Candles Order-flow indicator combining Delta (Ask–Bid), Cumulative Volume Delta (CVD), and a unique CVD-based synthetic candle system. Shows buy/sell pressure, volume aggressiveness, and momentum shifts with optional Delta histogram, CVD line, and CVD+Delta combined candles. Useful for scalping, intraday trading, divergence detection, and understanding buyer/seller dominance. Overview The Delta + CVD & CVD Candles Indicator combines multiple order-flow tools into one clean
    Delta Profile Volume
    Teresinha Moraes Correia
    Descrição Técnica do Indicador – Delta Profile para MetaTrader 5 O Delta Profile é um indicador desenvolvido para o MetaTrader 5 com foco em análise detalhada do fluxo de volume dentro de um intervalo definido de candles. Ele organiza e exibe informações sobre o desequilíbrio de volumes positivos (associados a movimentos de alta) e negativos (associados a movimentos de baixa) em diferentes níveis de preço. O resultado é uma visão clara dos pontos do gráfico onde há maior concentração de negócios
    Was: $249  Now: $99   Market Profile defines a number of day types that can help the trader to determine market behaviour. A key feature is the Value Area, representing the range of price action where 70% of trading took place. Understanding the Value Area can give traders valuable insight into market direction and establish the higher odds trade. It is an excellent addition to any system you may be using. Inspired by Jim Dalton’s book “Mind Over Markets”, this indicator is designed to suit the
    No Demand No Supply MT5
    Trade The Volume Waves Single Member P.C.
    No Demand No Supply   This indicator identifies   No Demand –No Supply candles to your chart and plots volume bars colored according to the signal. It can be applied to all timeframes or to a specific one only. It can also be used as regular volume indicator  with exceptional future of WEIGHTED VOLUME. Furthermore is has an alert notification, sound and email when a signals occurs. The indicator does not repaint but the alert will come on two candles back due to the definition of No Demand No Su
    Time and Sales Tick
    Pablo Filipe Soares De Almeida
    O Time & Sales Tick Indicator é um indicador para MetaTrader 5 que exibe informações de ticks em tempo real. Ele mostra preço, volume e horário diretamente no gráfico, permitindo análise precisa da atividade do mercado. Funcionalidades Exibe dados de ticks (preço, volume e hora) em um painel sobre o gráfico. Agrupa os ticks em intervalos definidos pelo usuário, com cores diferentes (verde para alta, vermelho para baixa). O painel pode ser posicionado em qualquer canto do gráfico, com ajuste de t
    Crash 1000 Scalping Indicator for the Crash 1000 Deriv Synthetic Index. Introduction The Crash 1000 Scalping Indicator is a specialized tool designed for the Crash 1000 index on the Deriv Synthetic market. This indicator is particularly useful for scalping on the M1 timeframe, helping traders to identify precise entry and exit points for buy positions. It is designed to be non-repainting, providing clear signals with audible alerts and push notifications, and is compatible with mobile devices th
    Overview Heiken Ashi CE Filtered MT5 is a technical indicator for the MetaTrader 5 platform. It integrates smoothed candlestick charting with a dynamic exit strategy and a customizable trend filter to deliver clear buy and sell signals. The indicator is designed to improve trend detection and signal reliability by reducing market noise. If you want to see more high-quality products or order the development/conversion of your own products, visit my partners' website: 4xDev Get 10% OFF on manual
    The Accumulation and Distribution indicator is a volume-based indicator that was essentially designed to measure underlying supply and demand. This is accomplished by trying to determine whether traders are actually accumulating (buying) or distributing (selling). This is accomplished by plotting a cumulative total of the money flow volume for each period. This indicator can reveal divergences between volume flow and actual price to primarily affirm a current trend or to anticipate a future reve
    Wapv Price and volume
    Eduardo Da Costa Custodio Santos
    O Indicador WAPV Price and Volume para MT5 faz parte do conjunto de ferramentas do (Wyckoff Academy Wave Market) e ( Wyckoff Academy Price and Volume). O Indicador WAPV Price and Volume para MT5 foi criado para facilitar a visualização da movimentação do volume  no gráfico de forma intuitiva. Com ele você pode observar os momentos de pico de volume e momentos em que o mercado não tem interesse profissional Identificar momentos que o Mercado esta se movimentando por inércia e não por moviment
    PivotWave
    Jeffrey Quiatchon
    Introducing PivotWave – your ultimate trading companion that redefines precision and market analysis. Designed with traders in mind, PivotWave is more than just an indicator; it’s a powerful tool that captures the pulse of the market, identifying key turning points and trends with pinpoint accuracy. PivotWave leverages advanced algorithms to provide clear visual signals for optimal entry and exit points, making it easier for traders to navigate volatile market conditions. Whether you are a begin
    Description The indicator uses market profile theory to show the most relevant trading zones, on a daily basis. The zones to be shown are LVN (low volume nodes) and POC (point of control). An LVN zone is one which represents price areas with the least time or volume throughout the day. Typically, these areas indicate a supply or demand initiative, and in the future, they can turn into important breakout or retracement zones. A POC zone is one which represents price areas with the most time or vo
    O indicador SMC Venom Model BPR é uma ferramenta profissional para os traders que trabalham com o conceito Smart Money (SMC). Identifica automaticamente dois padrões principais no gráfico de preços: FVG   (Fair Value Gap) é uma combinação de três velas, em que existe um gap entre a primeira e a terceira velas. Forma uma zona entre níveis onde não há suporte de volume, o que geralmente leva a uma correção de preço. BPR   (Balanced Price Range) é uma combinação de dois padrões FVG que formam uma
    Weis Wave Result MT5
    Sant Clear Ali Costa
    Características 3 tipos de torres: altista, baixista e desconhecida. A torre desconhecida surge quando os preços se movem no sentido oposto a torre atual. Texto que mostra a porcentagem restante para a mudança de torre. Permite definir a pontuação necessária para a troca de torre. Permite definir o tamanho da fonte dos textos de porcentagem. Permite definir tanto as cores das torres quanto as cores dos textos de porcentagem. Aba Parâmetros de Entrada Reversal Points - Pontos de reversão. Limite
    TRI Visualizer
    Yoshimi Mon 三 Ura
    TRI Visualizer MT5 – Thermodynamic Market Analysis Overview The TRI (Thermal Range Indicator) Visualizer Enhanced is a rare market analysis indicator that goes beyond conventional technical analysis, applying principles of thermodynamics from physics. It interprets market price fluctuations as “thermodynamic energy,” enabling the highly accurate detection of subtle market changes that are often overlooked. Innovative Mechanisms 1. Dual Calculation Engines Classic TRI Mode Formula: |Close
    The Super Arrow Indicator provides non-repainting buy and sell signals with exceptional accuracy. Key Features No repainting – confirmed signals remain fixed Clear visual arrows: green for buy, red for sell Real-time alerts via pop-up, sound, and optional email Clean chart view with no unnecessary clutter Works on all markets: Forex, gold, oil, indices, crypto Adjustable Parameters TimeFrame Default:   "current time frame" Function:   Sets the time frame for indicator calculation Options:   Can
    O WaveTrend Oscillator MT5 é um poderoso indicador de trading projetado para aprimorar sua análise de mercado ao identificar mudanças de momentum e potenciais reversões de tendência. Ideal para traders de todos os níveis, essa ferramenta oferece insights valiosos sobre condições de sobrecompra e sobrevenda em vários mercados, incluindo forex, criptomoedas e commodities. Com sua capacidade de gerar sinais de compra e venda precisos, o WaveTrend Oscillator MT5 capacita os traders a tomarem decisõe
    PNA Vwap
    Le Trung Kien Hoang
    Pna Vwap: Professional Multi-Timeframe VWAP Gain a professional edge and trade with institutional clarity. Pna Vwap is a powerful, all-in-one VWAP system Stop guessing the true market trend. Pna Vwap provides a clean, multi-dimensional view of the market by showing the real, volume-weighted average price across three critical timeframes. Understand where the value is, identify who is in control, and make trading decisions with greater confidence. Core Features & Key Advantages This is not a ba
    FREE
    O   Donchian Time Sync Analyzer   traz uma poderosa dimensão   multi-timeframe   para a análise clássica de canais Donchian, permitindo que os traders monitorem simultaneamente   a força da tendência   e potenciais   sinais de reversão   em cinco períodos gráficos diferentes. Este indicador avançado calcula as máximas e mínimas mais altas nos timeframes selecionados, gerando   sinais visuais claros   que ajudam a identificar a convergência da direção da tendência em múltiplos horizontes temporai
    Visual CrossPulse Dynamics Indicator
    AL MOOSAWI ABDULLAH JAFFER BAQER
    Visual CrossPulse Dynamics: Trade with the Market's True Rhythm Unlock a new level of market insight with Visual CrossPulse Dynamics, a sophisticated trading indicator designed to adapt to ever-changing volatility and reveal the true direction of the trend. Are you tired of indicators that lag in fast-moving markets or give false signals during consolidation? The Visual CrossPulse Dynamics indicator solves this problem by using an advanced, adaptive algorithm that intelligently adjusts to the m
    Harmonic Pattern Structure Harmonic Pattern Structure é um indicador profissional para MetaTrader 5 que detecta automaticamente padrões harmônicos clássicos utilizando validação rigorosa de ratios de Fibonacci e estrutura XABCD. Projetado para traders que buscam precisão, clareza visual e padronização, o indicador identifica zonas de reversão com base em geometria de preço, ajudando na tomada de decisão de forma objetiva e consistente. PADRÕES HARMÔNICOS DETECTADOS Gartley (222) Butterfly
    Key level wedge MT5
    Presley Annais Tatenda Meck
    The   Key level wedge MT5   indicator automatically draws rising wedge pattern and falling wedge pattern for you on the chart. This pattern is really good when used as a confirmation entry at key support & resistance, supply & demand and reversal zones. Advantages  The   Key level wedge MT5   block DOES NOT RE-PAINT, giving you confidence when a signal appears and also helps when looking back.  The   Key level wedge MT5   includes an on/off button on the chart to easily keep the charts clean
    A nova versão torna este indicador uma ferramenta completa para estudo, análise e operação de padrões probabilísticos. Suas funções incluem: Monitor de porcentagem de múltiplos ativos no gráfico. Martingales configuráveis. Vinte e um padrões pré-configurados, incluindo padrões Mhi e C3. Um editor de padrões avançado para armazenar até 5 padrões personalizados. Modo Backtest para testar resultados com relatório de perdas. Filtro de tendência. Filtro de hits. Opção de Ciclos de Martingale. Vários
    Volume Candle Indicator
    Pablo Filipe Soares De Almeida
    Histograma de Volume Colorido para MetaTrader 5 Este indicador exibe o volume como um histograma em uma janela separada. As barras são coloridas conforme a direção do candle: verde para alta (fechamento > abertura) e vermelho para baixa (fechamento < abertura). Principais Recursos Fonte do volume: volume de ticks ou volume real (selecionável). Linha de média móvel opcional sobre o histograma de volume, ativada via input. Tipos de médias suportadas: SMA, EMA, SMMA, LWMA. Período da média configur
    Portuguese (Brazilian) Explicação das Vantagens (Sem mencionar o código) 1. Diferenciação Detalhada do Mercado (3 Dimensões) Esta ferramenta isola especificamente o movimento "Lateral" (Sideways) . O trader vê: Força de compra (Touros). Força de venda (Ursos). Importante: Quando o mercado está sem direção, evitando entradas falsas. 2. Oscilador de Força (0-100) Zonas Extremas: Define sobrecompra e sobrevenda. Preenchimento de Área: Colore as zonas críticas para fácil visualização. 3. Filtragem d
    Weis Waves
    Flavio Javier Jarabeck
    2.83 (18)
    The original author is David Weis, an expert in the Wyckoff Method. The Weis Wave is a modern adaptation of the 1930's Wyckoff Method, another expert in Tape Reading techniques and Chart Analysis. Weis Waves takes market volume and stacks it into waves according to price conditions giving the trader valuable insights about the market conditions. If you want to learn more about this subject you can find tons of videos in YouTube. Just look for "The Wickoff Method", "Weis Wave" and "Volume Spread
    FREE
    This Volume Delta Profile is an advanced MetaTrader 5 indicator that visualizes   volume delta (order flow imbalance)   using a volume profile-style histogram. It shows the difference between buying and selling pressure at specific price levels, helping traders identify supply and demand zones. This indicator provides a unique perspective on market dynamics by visualizing the imbalance between buying and selling pressure, offering insights beyond traditional volume analysis. Core Concept Positiv
    KT Renko Patterns MT5
    KEENBASE SOFTWARE SOLUTIONS
    O KT Renko Patterns analisa o gráfico Renko tijolo por tijolo para identificar padrões gráficos conhecidos que são amplamente utilizados por traders em diversos mercados financeiros. Em comparação com gráficos baseados em tempo, os gráficos Renko tornam a identificação de padrões muito mais fácil e visualmente clara, graças à sua aparência limpa e objetiva. O KT Renko Patterns possui vários padrões Renko, muitos dos quais são explicados com profundidade no livro "Profitable Trading with Renko
    Os compradores deste produto também adquirem
    SuperScalp Pro
    Van Minh Nguyen
    5 (11)
    SuperScalp Pro – Sistema avançado de indicador de scalping com múltiplos filtros SuperScalp Pro é um sistema avançado de indicador de scalping que combina o clássico Supertrend com múltiplos filtros inteligentes de confirmação. O indicador opera de forma eficiente em todos os timeframes de M1 a H4 e é especialmente adequado para XAUUSD, BTCUSD e principais pares Forex. Pode ser usado como sistema independente ou integrado de forma flexível a estratégias de trading existentes. O indicador integra
    Divergence Bomber
    Ihor Otkydach
    4.89 (83)
    Cada comprador deste indicador recebe adicionalmente, e de forma gratuita: A ferramenta exclusiva "Bomber Utility", que acompanha automaticamente cada operação, define os níveis de Stop Loss e Take Profit e fecha operações de acordo com as regras da estratégia; Arquivos de configuração (set files) para ajustar o indicador em diferentes ativos; Set files para configurar o Bomber Utility nos modos: "Risco Mínimo", "Risco Balanceado" e "Estratégia de Espera"; Um vídeo tutorial passo a passo que aju
    Azimuth Pro
    Ottaviano De Cicco
    5 (6)
    PROMOÇÃO DE LANÇAMENTO O preço do Azimuth Pro está inicialmente definido em 299$ para os primeiros 100compradores. O preço final será de 499$ . A DIFERENÇA ENTRE ENTRADAS RETAIL E INSTITUCIONAIS NÃO É O INDICADOR — É A LOCALIZAÇÃO. A maioria dos traders entra em níveis de preço arbitrários, perseguindo momentum ou reagindo a sinais atrasados. As instituições esperam o preço atingir níveis estruturados onde oferta e demanda realmente mudam. Azimuth Pro mapeia esses níveis automaticamente: VWA
    ARICoins
    Temirlan Kdyrkhan
    ARICoin is a powerful trading companion designed to generate high-probability entry signals with dynamic TP/SL/DP levels based on volatility. Built-in performance tracking shows win/loss stats, PP1/PP2 hits, and success rates all updated live. Key Features: Buy/Sell signals with adaptive volatility bands Real-time TP/SL/DP levels based on ATR Built-in MA Filter with optional ATR/StdDev volatility Performance stats panel (Success, Profit/Loss, PP1/PP2) Alerts via popup, sound, push, or email Cust
    Entry In The Zone and SMC Multi Timeframe is a real-time market analysis tool developed based on Smart Money Concepts (SMC). It is designed to analyze market structure, price direction, reversal points, and key zones across multiple timeframes in a systematic way. The system displays Points of Interest (POI) and real-time No Repaint signals, with instant alerts when price reaches key zones or when signals occur within those zones. It functions as both an Indicator and a Signal System (2-in-1), c
    Se você comprar este indicador, receberá meu Gerenciador de Operações Profissional + EA  GRATUITAMENTE. Primeiramente, vale ressaltar que este Sistema de Trading é um Indicador Não Repintado, Não Redesenho e Não Atrasado, o que o torna ideal tanto para o trading manual quanto para o automatizado. Curso online, manual e download de predefinições. O "Sistema de Trading Inteligente MT5" é uma solução completa de trading projetada para traders novos e experientes. Ele combina mais de 10 indicadores
    FX Trend MT5 NG
    Daniel Stein
    5 (4)
    FX Trend NG: A Nova Geração de Inteligência de Tendência Multi-Mercado Visão Geral FX Trend NG é uma ferramenta profissional de análise de tendências e monitoramento de mercado em múltiplos períodos de tempo. Permite compreender a estrutura completa do mercado em segundos. Em vez de alternar entre vários gráficos, você visualiza instantaneamente quais ativos estão em tendência, onde o momentum está enfraquecendo e onde existe alinhamento forte entre diferentes timeframes. Oferta de Lançamento
    Power Candles MT5
    Daniel Stein
    5 (6)
    Power Candles – Sinais de entrada baseados em força para qualquer mercado Power Candles leva a análise de força comprovada da Stein Investments diretamente para o seu gráfico de preços. Em vez de reagir apenas ao preço, cada candle é colorido com base na força real do mercado, permitindo identificar instantaneamente a construção de momentum, aceleração de força e transições limpas de tendência. Uma única lógica para todos os mercados Power Candles funciona automaticamente em todos os símbolos de
    Trend Screener Pro MT5
    STE S.S.COMPANY
    4.81 (103)
    Desbloqueie o poder da negociação de tendências com o indicador Trend Screener: sua solução definitiva de negociação de tendências, alimentada por lógica difusa e sistema de múltiplas moedas! Eleve sua negociação de tendências com o Trend Screener, o revolucionário indicador de tendências alimentado por lógica difusa. É um poderoso indicador de acompanhamento de tendências que combina mais de 13 ferramentas e recursos premium e 3 estratégias de negociação, tornando-o uma escolha versátil para to
    AriX
    Temirlan Kdyrkhan
    1 (4)
    AriX Indicator for MT5 A powerful trend-following and signal-evaluation tool AriX is a custom MT5 indicator that combines Moving Averages and ATR-based risk/reward logic to generate clear buy/sell signals. It visualizes dynamic SL/TP levels, evaluates past trade outcomes, and displays win/loss statistics in a clean on-chart panel. Key features include: Buy/Sell signals based on MA crossovers ATR-based SL/TP1/TP2/TP3 levels with visual lines and labels Signal outcome tracking with real-time stat
    RFI levels PRO MT5
    Roman Podpora
    3.67 (3)
    O indicador mostra com precisão os pontos de reversão e as zonas de retorno de preço onde o   Principais players . Você identifica onde novas tendências estão se formando e toma decisões com máxima precisão, mantendo o controle sobre cada negociação. VERSION MT4     -    Revela seu potencial máximo quando combinado com o indicador   TREND LINES PRO. O que o indicador mostra: Estruturas de reversão e níveis de reversão com ativação no início de uma nova tendência. Exibição dos níveis de   TAKE P
    OmniSync Projection
    Antonio-alin Teculescu
    5 (1)
    Chronos Fractal Engine is an innovative price projection indicator for MetaTrader 5, designed to transform your technical analysis by intelligently identifying and projecting historical price patterns. Built upon an advanced correlation algorithm and the fractal principles of the market, this powerful tool visualizes potential future price movements, giving you a unique edge in your trading decisions. What is Chronos Fractal Engine? At its core, the Chronos Fractal Engine employs a sophisticat
    Grabber System MT5
    Ihor Otkydach
    4.83 (23)
    Apresento a você um excelente indicador técnico: Grabber, que funciona como uma estratégia de trading “tudo incluído”, pronta para usar. Em um único código estão integradas ferramentas poderosas de análise técnica de mercado, sinais de entrada (setas), funções de alertas e notificações push. Cada comprador deste indicador também recebe gratuitamente: Utilitário Grabber: ferramenta para gerenciamento automático de ordens abertas Vídeo tutorial passo a passo: como instalar, configurar e operar com
    Atomic Analyst MT5
    Issam Kassas
    4.03 (30)
    Primeiramente, vale ressaltar que este Indicador de Negociação não repinta, não redesenha e não apresenta atrasos, tornando-o ideal tanto para negociação manual quanto automatizada. Manual do utilizador: configurações, entradas e estratégia. O Analista Atômico é um Indicador de Ação de Preço PA que utiliza a força e o momentum do preço para encontrar uma vantagem melhor no mercado. Equipado com filtros avançados que ajudam a remover ruídos e sinais falsos, e aumentam o potencial de negociação.
    FX Power MT5 NG
    Daniel Stein
    5 (31)
    FX Power: Analise a Força das Moedas para Decisões de Negociação Mais Inteligentes Visão Geral FX Power é a sua ferramenta essencial para compreender a força real das principais moedas e do ouro em quaisquer condições de mercado. Identificando moedas fortes para comprar e fracas para vender, FX Power simplifica as decisões de negociação e revela oportunidades de alta probabilidade. Quer você prefira seguir tendências ou antecipar reversões usando valores extremos de Delta, esta ferramenta adap
    Smart Stop Indicator – Precisão inteligente de stop-loss diretamente no seu gráfico Visão geral O Smart Stop Indicator é a solução ideal para traders que desejam definir seu stop-loss de forma clara e metódica, sem adivinhações ou decisões baseadas apenas na intuição. A ferramenta combina lógica clássica de price action (topos mais altos, fundos mais baixos) com um sistema moderno de detecção de rompimentos para identificar onde realmente deve estar o próximo nível lógico de stop. Seja em tend
    Trend indicator AI mt5
    Ramil Minniakhmetov
    5 (15)
    O indicador Trend Ai é uma ótima ferramenta que irá melhorar a análise de mercado de um trader, combinando a identificação de tendências com pontos de entrada acionáveis e alertas de reversão. Este indicador permite que os usuários naveguem pelas complexidades do mercado forex com confiança e precisão Além dos sinais primários, o indicador Trend Ai identifica pontos de entrada secundários que surgem durante retrações ou retrações, permitindo que os comerciantes capitalizem as correções de preço
    LINHAS DE TENDÊNCIA PRO   -   Ajuda a entender onde o mercado está realmente mudando de direção. O indicador mostra inversões de tendência reais e pontos onde os principais participantes retornam ao mercado. Você vê     Linhas BOS   Análise de tendências e níveis-chave em prazos maiores — sem configurações complexas ou ruídos desnecessários. Os sinais não são repintados e permanecem no gráfico após o fechamento da barra. VERSÃO MT4   -   Revela seu potencial máximo quando combinado com o   indic
    Antes de tudo, vale ressaltar que esta Ferramenta de Negociação é um Indicador Não Repintante, Não Redesenhante e Não Atrasado, o que a torna ideal para negociação profissional. Curso online, manual do utilizador e demonstração. O Indicador de Conceitos de Ação de Preço Inteligente é uma ferramenta muito poderosa tanto para traders novos quanto experientes. Ele combina mais de 20 indicadores úteis em um único, combinando ideias avançadas de negociação como Análise do Trader do Círculo Interno
    ARIPoint
    Temirlan Kdyrkhan
    ARIPoint is a powerful trading companion designed to generate high-probability entry signals with dynamic TP/SL/DP levels based on volatility. Built-in performance tracking shows win/loss stats, PP1/PP2 hits, and success rates all updated live. Key Features: Buy/Sell signals with adaptive volatility bands Real-time TP/SL/DP levels based on ATR Built-in MA Filter with optional ATR/StdDev volatility Performance stats panel (Success, Profit/Loss, PP1/PP2) Alerts via popup, sound, push, or email Cu
    Quantum TrendPulse
    Bogdan Ion Puscasu
    5 (22)
    Apresentando   Quantum TrendPulse   , a ferramenta de negociação definitiva que combina o poder do   SuperTrend   ,   RSI   e   Stochastic   em um indicador abrangente para maximizar seu potencial de negociação. Projetado para traders que buscam precisão e eficiência, este indicador ajuda você a identificar tendências de mercado, mudanças de momentum e pontos de entrada e saída ideais com confiança. Principais características: Integração SuperTrend:   siga facilmente a tendência predominante do
    FX Dynamic MT5
    Daniel Stein
    5 (5)
    FX Dynamic: Acompanhe a Volatilidade e as Tendências com Análise ATR Personalizável Visão Geral FX Dynamic é uma ferramenta poderosa que utiliza cálculos de Average True Range (ATR) para fornecer aos traders insights incomparáveis sobre a volatilidade diária e intradiária. Ao configurar limites de volatilidade claros —por exemplo, 80%, 100% e 130%—, você pode identificar rapidamente oportunidades de lucro ou receber alertas quando o mercado ultrapassar faixas normais. FX Dynamic se adapta ao f
    FX Levels MT5
    Daniel Stein
    5 (13)
    FX Levels: Suporte e Resistência com Precisão Excepcional para Todos os Mercados Visão Geral Rápida Procurando um meio confiável de identificar níveis de suporte e resistência em qualquer mercado—incluindo pares de moedas, índices, ações ou commodities? FX Levels combina o método “Lighthouse” tradicional com uma abordagem dinâmica de vanguarda, fornecendo uma precisão quase universal. Baseado em nossa experiência real com corretores e em atualizações automáticas diárias mais as de tempo real,
    Market Structure Order Block Dashboard MT5 é um indicador para MT5 focado em estrutura de mercado e conceitos ICT / Smart Money: HH/HL/LH/LL , BOS , ChoCH , além de Order Blocks , Fair Value Gaps (FVG) , liquidez (EQH/EQL, sweeps), sessões / Kill Zones e um Volume Profile integrado, com um dashboard compacto de confluência. Importante: é uma ferramenta de análise . Não executa operações (não é um EA). Bônus para compradores Após a compra, você pode receber 2 indicadores bônus (à sua escolha) da
    Candle Smart Range
    Gianny Alexander Lugo Sanchez
    5 (1)
    Candle Smart Range (CSR) para MetaTrader 5 O Candle Smart Range é um indicador técnico projetado para a identificação automática de intervalos de preços em múltiplos períodos de tempo. Esta ferramenta analisa a estrutura do mercado com base em formações de velas e na interação do preço com máximas e mínimas anteriores. Principais Características: Deteção de Intervalos: Identifica zonas de consolidação antes de movimentos impulsivos. Identificação de Falsos Rompimentos: Marca visualmente quando o
    Crystal Heikin Ashi Signals
    Muhammad Jawad Shabir
    5 (1)
    Crystal Heikin Ashi Signals - Professional Trend & Signal Detection Indicator Advanced Heikin Ashi Visualization with Intelligent Signal System for Manual & Automated Trading Final Price: $149 ---------> Price goes up $10 after every 10 sales . Limited slots available — act fast . Overview Crystal Heikin Ashi Signals is a professional-grade MetaTrader 5 indicator that combines pure Heikin Ashi candle visualization with an advanced momentum-shift detection system. Designed for both manual traders
    Este indicador é um indicador para análise automática de ondas que é perfeito para negociações práticas! Caso... Nota:   Não estou acostumado a usar nomes ocidentais para classificação de ondas. Devido à influência da convenção de nomenclatura de Tang Lun (Tang Zhong Shuo Zen), nomeei a onda básica como   uma caneta   e a banda de onda secundária como   um segmento   . ao mesmo tempo, o segmento tem a direção da tendência.   O segmento de tendência principal   é nomeado (esse método de nomencl
    Btmm state engine pro
    Garry James Goodchild
    5 (2)
    Get the user guide here  https://g-labs.software/guides/BTMM_State_Engine_Welcome_Pack.html BTMM State Engine Pro — the   all-in-one Banks   & Institutions Market Maker indicator for Meta Trader 5. Built for   BTMM traders who follow the Asian   session breakout methodology with Kill Zone timing , level stacking, peak formation detection , and multi-pair scanning — all   from a single chart. Combines   a full BTMM State Engine   with a built-in multi-pair Scanner dashboard, eliminating the need
    Introduction to X3 Chart Pattern Scanner X3 Cherart Pattern Scanner is the non-repainting and non-lagging indicator detecting X3 chart patterns including Harmonic pattern, Elliott Wave pattern, X3 patterns, and Japanese Candlestick patterns. Historical patterns match with signal patterns. Hence, you can readily develop the solid trading strategy in your chart. More importantly, this superb pattern scanner can detect the optimal pattern of its kind. In addition, you can switch on and off individu
    IX Power MT5
    Daniel Stein
    4.92 (13)
    IX Power: Descubra informações de mercado para índices, commodities, criptomoedas e forex Visão Geral IX Power é uma ferramenta versátil projetada para analisar a força de índices, commodities, criptomoedas e símbolos de forex. Enquanto o FX Power oferece a máxima precisão para pares de moedas ao utilizar dados de todos os pares disponíveis, o IX Power foca exclusivamente nos dados do mercado do símbolo subjacente. Isso torna o IX Power uma excelente escolha para mercados fora do forex e uma o
    Mais do autor
    Mini POC
    Flavio Javier Jarabeck
    4.93 (29)
    For those who struggle with overbloated Volume Profile/Market Profile indicators, here is a solution that contains only the Point of Control (POC) information. Super-fast and reliable, the Mini POC indicator presents this vital information visually within your chart. Totally customizable in splittable timeframes, type of Volume, calculation method, and how many days back you need. SETTINGS Timeframe to split the POCs within the day. Volume type to use: Ticks or Real Volume. Calculation method .
    FREE
    Auto Support and Resistances
    Flavio Javier Jarabeck
    4.57 (70)
    Are you tired of drawing Support & Resistance levels for your Quotes? Are you learning how to spot Support & Resistances? No matter what is your case, Auto Support & Resistances will draw those levels for you! AND, it can draw them from other timeframes, right into you current chart, no matter what timeframe you are using... You can also Agglutinate regions/zones that are too much closer to each other and turning them into one single Support & Resistance Level. All configurable. SETTINGS Timefr
    FREE
    Symbol Watermark
    Flavio Javier Jarabeck
    4.57 (14)
    Another request from my brotherhood was putting the name of the Symbol being seen - a little bigger - on the Chart, just to get sure that they are seeing the correct one... Mistakes pay a high price on the market... It is a very effective, and almost resource-null-consuming indicator that displays the current Symbol Name and Timeframe in almost any position of your Chart, with any color, and any Font Size... And also you can change the divisor character that is presented between the Symbol Name
    FREE
    Inside Bar Radar
    Flavio Javier Jarabeck
    4.67 (6)
    The Inside Bar pattern is a very well known candlestick formation used widely by traders all over the world and in any marketplace. This approach is very simple and adds a little confirmation candle, so it adds a third past candlestick to the count to confirm the direction of the move (upward or downward). Obviously, there is no power on this candlestick formation if the trader has no context on what it is happening on the market he/she is operating, so this is not magic, this "radar" is only a
    FREE
    Closing Price Reversal
    Flavio Javier Jarabeck
    5 (11)
    Closing Price Reversal is a very well known and traded candlestick pattern. This little indicator paints with specific (user-selected) colors the Closing Price Reveral Up and Down patterns, as well as the Inside Bars (as a bonus). Higher timeframes are more effective  as with all other candlesticks patterns. Do NOT trade solely on this indicator. Search the web for "Closing Price Reversal" to learn about the several approaches that can be used with this pattern. One of them is combining short/me
    FREE
    Tabajara V5
    Flavio Javier Jarabeck
    4.83 (36)
    Metatrader 5 version of the famous Andre Machado's Tabajara indicator. If you don't know Andre Machado's Technical Analysis work you don't need this indicator... For those who need it and for those several friend traders who asked this porting from other platforms, here it is... FEATURES 8-period Moving Average 20-period Moving Average 50-period Moving Average 200-period Moving Average Colored candles according to the inflexion of the 20-period MA SETTINGS You can change the Period of all MA's
    FREE
    Economic Markers
    Flavio Javier Jarabeck
    4.79 (14)
    Easily get all relevant economic events of the current day right into your chart, as markers. Filter what kind of markers do you want: by country (selected individually) and by Importance (High relevance, Medium, Low or any combination of these). Configure the visual cues to your liking. If there is more than one event set to the very same time, their Names will be stacked and you will see the messages merged with the plus (+) sign on the marker. Obviously that long or too much events on the sam
    FREE
    Weis Waves
    Flavio Javier Jarabeck
    2.83 (18)
    The original author is David Weis, an expert in the Wyckoff Method. The Weis Wave is a modern adaptation of the 1930's Wyckoff Method, another expert in Tape Reading techniques and Chart Analysis. Weis Waves takes market volume and stacks it into waves according to price conditions giving the trader valuable insights about the market conditions. If you want to learn more about this subject you can find tons of videos in YouTube. Just look for "The Wickoff Method", "Weis Wave" and "Volume Spread
    FREE
    Aggression Volume
    Flavio Javier Jarabeck
    4.29 (17)
    O Indicador de Volume de Agressão é o tipo de indicador que raramente é encontrado na comunidade MQL5 porque não é baseado nos dados de Volume padrão fornecidos pela plataforma Metatrader 5. Ele requer a análise de todos os Ticks de tráfego solicitados na plataforma... Dito isso, o indicador de Volume de Agressão solicita todos os Dados de Tick do seu Broker e os processa para construir uma versão muito especial de um Indicador de Volume, onde as agressões de Compradores e Vendedores são plotada
    FREE
    Big Player Candles
    Flavio Javier Jarabeck
    4.91 (23)
    If you heard about The Wyckoff Method, Volume Spread Analysis, etc... You are probably searching for the candlestick indicator that shows you the Volume spread all over the current bar, signaling every types of market status... You can control the several Market Levels with custom colors... It is up to you to decide how to use it. Our job is provide you with the indicator... If you like this indicator, all I am asking is a little Review (not a Comment, but a REVIEW! )...    This will mean A LO
    FREE
    MIDAS Super VWAP
    Flavio Javier Jarabeck
    4.27 (11)
    Imagine VWAP, MVWAP and MIDAS in one place... Well, you found it! Now you can track the movement of Big Players in various ways, as they in general pursue the benchmarks related to this measuring, gauging if they had good execution or poor execution on their orders. Traders and analysts use the VWAP to eliminate the noise that occurs throughout the day, so they can measure what prices buyers and sellers are really trading. VWAP gives traders insight into how a stock trades for that day and deter
    FREE
    Price Momentum
    Flavio Javier Jarabeck
    4.92 (12)
    Value Chart indicator presents the Price evolution in a new form. This indicator, Price Momentum , was developed taking all the calculations presented in the book " Dynamic Trading Indicators " by Mark W. Helweg and David Stendahl (2002). The technique involves de-trended Prices from a user-defined Period of analysis and the addition of a Volatility index correction. The result is an Oscillator with 3 zones: Fair Price Value, Overbought/Oversold and Extremely Overbought/Oversold zones. Adding th
    FREE
    VWAP and MVWAP
    Flavio Javier Jarabeck
    3.88 (8)
    Volume Weighted Average Price (VWAP) is a trading benchmark commonly used by Big Players that gives the average price a Symbol has traded throughout the day. It is based on both Volume and price. Additionally we put in this indicator the MVWAP (Moving Volume Weighted Average Price). For those who do not know the usage and the importance od this indicator I recommend a great article about this subject at Investopedia ( https://www.investopedia.com/articles/trading/11/trading-with-vwap-mvwap.asp )
    FREE
    Market Momentum
    Flavio Javier Jarabeck
    4.43 (7)
    O indicador de Momento do Mercado é baseado no Oscilador de Zona de Volume (VZO), apresentado por Waleed Aly Khalil na edição de 2009 do jornal da Federação Internacional de Analistas Técnicos , e apresenta uma nova visão desses valiosos dados de mercado que muitas vezes são mal compreendidos e negligenciados: o VOLUME. Com essa nova abordagem de "ver" os dados de Volume, os traders podem inferir de maneira mais adequada o comportamento do mercado e aumentar suas chances em uma negociação bem-su
    FREE
    Flux Diffuser
    Flavio Javier Jarabeck
    4.33 (6)
    Based on Brazilian trader André Moraes' Difusor de Fluxo theory, the indicator is a more reliable version of the original MACD. It is a great confirmation indicator for Swing Trading and also can be used as a Day Trading tool. If you are not familiar with the concept or André's trading strategies, I strongly recommend his excelent book named "Se Afastando da Manada" in which he explains in detail how this indicator is used. Even if you don't know the Portuguese language it is not difficult to un
    FREE
    Stackable VWAP
    Flavio Javier Jarabeck
    3.5 (4)
    Volume Weighted Average Price (VWAP) is a trading benchmark commonly used by Big Players that gives the average price a Symbol has traded throughout the day. It is based on both Volume and price. Additionally we put in this indicator the MVWAP (Moving Volume Weighted Average Price). For those who do not know the usage and the importance od this indicator I recommend a great article about this subject at Investopedia ( https://www.investopedia.com/articles/trading/11/trading-with-vwap-mvwap.asp
    FREE
    Waves Sizer
    Flavio Javier Jarabeck
    3.86 (7)
    Wyckoff fans, enjoy! Ideally to be used with the Weis Waves indicator, but it can be easily used alone, the Waves Sizer puts the range (in resulting Price movement) done by the Price on its market swings. You can control how accurate or loose will be the swings. This tool is very helpful for visually know how much the Price has traveled in your Timeframe. This way you can confront this level of effort with the resulting Volume, etc... Weis Waves indicator: https://www.mql5.com/en/market/produc
    FREE
    Server Clock
    Flavio Javier Jarabeck
    5 (5)
    Many friends asked me for a simple, non-obtrusive, resource-friendly clock to track the time during their trades. It seems pretty obvious, but it is a must-have for those trading the market manually, waiting for the Market News, or just to visually know what time it is... Trading is an absorbing endeavor! So, here it is... Totally configurable, including Font Type, Font Size and Chart Location: Upper Left/Center/Right OR Lower Left/Center/Right, with a little twist of adjusting the Offset, just
    FREE
    Force Numbers
    Flavio Javier Jarabeck
    5 (1)
    Several assets in several markets have the behavior of using specific numbers as Force Numbers, where support, resistance and price thrust is created. Let this indicator draw those levels of support and resistance for you. You can also stack it to show different level of Prices! This technique is being used by Tape Readers and Order Flow traders all over the world for a long time. Give it a try. Challenge yourself to study new ways of Price Action! SETTINGS What Price reference to use in the c
    FREE
    Money Flow Index EA Friendly
    Flavio Javier Jarabeck
    3.67 (3)
    O indicador tradicional Money Flow Index, desta vez, compatível com EAs . Existem 3 buffers expostos que podem ser usados por EAs para analisar automaticamente as condições de sobrecompra e sobrevenda da cotação. Basta usar a função tradicional iCustom() para obter esses sinais. Este cálculo do Money Flow Index é baseado no indicador MFI tradicional da Metaquote. CONFIGURAÇÕES Período do MFI Tipo de volume para analisar (Volume Real ou Ticks) Início da região de sobrecompra Início da região de
    FREE
    Price Trail Chart
    Flavio Javier Jarabeck
    5 (2)
    For those who hate candlesticks in lower timeframes (M1 through M15) we "invented" a clean new way to follow Price movement and displacement (volatility) called Price Trail Chart . The big "secret" is to get rid of those annoying candle wicks and draw the whole complete candle without them, this way we get a cleaner chart and a new view of the Price Path. No Open or Close markings, just LOW's and HIGH's, full body candle. Additionaly we inserted a Volume monitor from our Best Downloaded indicato
    FREE
    ATR Monitor
    Flavio Javier Jarabeck
    4.8 (5)
    O ATR é uma medida de volatilidade introduzida pelo famoso autor J. Welles Wilder Jr. em seu livro "New Concepts in Technical Trading Systems". Em geral, os traders estão acostumados a ver o ATR na forma de um indicador em uma sub-janela do gráfico. O que estou apresentando aqui é uma versão simplificada do ATR - apenas contendo o número atual do ATR - muito útil para monitorar apenas o momento atual do mercado. Se você quiser monitorar vários tempos gráficos dentro do gráfico corrente, bast
    FREE
    Time Spaced Moving Averages
    Flavio Javier Jarabeck
    5 (3)
    The concept is simple: Plotting Price behavior within several periods of time. Some Symbols behave very well during the trading day - with this I mean Intraday trading - and this behavior ends up plotting effectively well with the proposed Exponential Moving Averages in this indicator... Obviously that this behavior could not be seen in all Symbols, but you can give it a try... Just drop this indicator in a chart and you will see for yourself... This indicator is intended for "Feeling the Trend"
    FREE
    Candle Zones
    Flavio Javier Jarabeck
    You probably heard about Candlesticks behaviors, which in most of the times could denote and trace Volume behaviors even if you are not watching Volume itself... Well, this indicator will do this. Naked traders love to rely solely on candlesticks patterns and with Candle Zones you can trap special patterns and DRAW THEM on your chart. As simple as that. There are several filters you can tweak in order to achieve the analysis you want. Just give it a try. After several months of testing, we think
    FREE
    ATR Monitor EA Friendly
    Flavio Javier Jarabeck
    ATR Monitor ATR is a measure of volatility introduced by market technician J. Welles Wilder Jr. in his book, "New Concepts in Technical Trading Systems". In general, traders are accustomed to seeing the ATR in the form of a sub-window indicator. What I am presenting here is a simplified version of ATR - just the current ATR number - very useful for monitoring just the very moment of the current chart. And, by default, this indicator will not show up on screen, you can just use the buffers thems
    FREE
    Arrows Cleaner
    Flavio Javier Jarabeck
    5 (4)
    For those who use the Trading Arrows on the chart for later study, but use the Triple Screen approach and got all those arrows everywhere on all additional charts, here it is: Arrows Cleaner! Just drop it on the chart and leave it there. When needed, just with 1-click you get rid of all those annoying arrows... SETTINGS You can position the little Button on any corner of the chart. Additionally you can displace it with the Offset settings. You can enlarge or shrink its size, as well as the text
    FREE
    Candlestick Pattern Teller
    Flavio Javier Jarabeck
    5 (1)
    Minions Labs' Candlestick Pattern Teller It shows on your chart the names of the famous Candlesticks Patterns formations as soon as they are created and confirmed. No repainting. That way beginners and also professional traders who have difficulties in visually identifying candlestick patterns will have their analysis in a much easier format. Did you know that in general there are 3 types of individuals: Visual, Auditory, and Kinesthetic? Don't be ashamed if you cannot easily recognize Candlesti
    Economic Markers PRO
    Flavio Javier Jarabeck
    4 (1)
    Easily get all relevant economic events of the current day right into your chart, as markers. Filter what kind of markers do you want: by country (selected individually) and by Importance (High relevance, Medium, Low or any combination of these). Configure the visual cues to your liking. Additionaly you have the ability to add up to 5 personal markers of your own agenda. With Alerts and/or with blackout periods, if you are using it within an Expert Advisor! All in one Economic Calendar indicator
    Mini Chart Indicators
    Flavio Javier Jarabeck
    The Metatrader 5 has a hidden jewel called Chart Object, mostly unknown to the common users and hidden in a sub-menu within the platform. Called Mini Chart, this object is a miniature instance of a big/normal chart that could be added/attached to any normal chart, this way the Mini Chart will be bound to the main Chart in a very minimalist way saving a precious amount of real state on your screen. If you don't know the Mini Chart, give it a try - see the video and screenshots below. This is a gr
    Market Momentum PRO
    Flavio Javier Jarabeck
    The Market Momentum indicator is based on the Volume Zone Oscillator (VZO), presented by Waleed Aly Khalil in the 2009 edition of the International Federation of Technical Analysts journal, and presents a fresh view of this market valuable data that is oftenly misunderstood and neglected: VOLUME. With this new approach of "seeing" Volume data, traders can infer more properly market behavior and increase their odds in a winning trade. "The VZO is a leading volume oscillator; its basic usefulness
    Filtro:
    Zani Roberto
    126
    Zani Roberto 2021.05.14 12:31 
     

    JP 0 07:28:23.381 Indicators custom indicator Waves PRO (USDCAD,M15) loaded succesfully IN 0 07:28:26.003 Indicators custom indicator Waves PRO (USDCAD,M15) removed ED 0 07:28:57.002 Indicators custom indicator Waves PRO (USDCAD,M15) loaded succesfully CS 0 07:29:01.003 Indicators custom indicator Waves PRO (USDCAD,M15) removed

    Flavio Javier Jarabeck
    351978
    Resposta do desenvolvedor Flavio Javier Jarabeck 2021.05.14 13:27
    Olá Zani... Pode me enviar uma mensagem pessoal mesmo aqui no site, ou via Telegram, caso tenha qualquer problema... ;)
    wallacementsan
    39
    wallacementsan 2020.09.19 14:03 
     

    O usuário não deixou nenhum comentário para sua avaliação

    Responder ao comentário