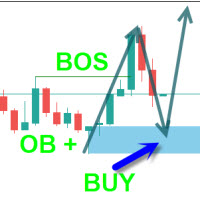
Yoshi ICT Fibonacci OTE

  • Indicadores
  • Le Quang Thanh
    Le Quang Thanh
    Professional Trading Tools for MetaTrader 5
    I specialize in developing high-quality indicators and Expert Advisors for MetaTrader 5, inspired by well-known trading methodologies used by professional traders and market researchers around the world.
  • Versão: 1.1
  • Ativações: 10

Trading a pullback often looks simple after the move is complete. In real time, however, traders must decide which swing matters, where the retracement should be measured from, and whether price is returning to a meaningful area or merely moving through noise. Manual Fibonacci drawing can become inconsistent, especially when the market extends to a new high or low. Yoshi ICT Fibonacci OTE was created to bring more structure to that process.

Product Overview

Yoshi ICT Fibonacci OTE is a manual decision-support indicator for MetaTrader 5. It identifies confirmed swing points, organizes the active directional move, plots a Fibonacci retracement map, and highlights a configurable Optimal Trade Entry zone. The indicator does not place trades or issue automatic Buy and Sell orders. Its purpose is to help traders observe pullbacks with a consistent framework, then combine the mapped area with their own market context, price action confirmation, and risk plan.

A Structured Way to Read Retracements

The analysis begins with confirmed swing highs and swing lows. When the developing structure produces a higher confirmed pivot or a lower confirmed pivot, the indicator establishes the active direction and anchors the Fibonacci range to the relevant swing leg. The standard retracement levels from 0 to 1 are then displayed, including 0.236, 0.382, 0.500, 0.618, and 0.786.

By default, the area between 0.618 and 0.786 is highlighted as the OTE zone. In a bullish structure, this creates a deeper retracement area below the active high. In a bearish structure, it marks the corresponding recovery area above the active low. When a new directional extreme is confirmed, the active Fibonacci map can adjust to reflect the expanded swing.

The zone should be treated as an area for closer evaluation, not as a guaranteed entry. A well-positioned retracement can still fail. Market direction, nearby support or resistance, candle behavior, volatility, invalidation, and position size remain part of the trader's responsibility.

Key Features

·  Confirmed swing high and swing low identification

·  Automatic Fibonacci retracement mapping for the active directional leg

·  Seven visible Fibonacci levels from 0.000 to 1.000

·  Customizable OTE boundaries, with 0.618 to 0.786 as the default range

·  Separate bullish and bearish OTE zone visualization

·  Optional swing-price labels, swing diagonal, and previous Fibonacci drawings

·  Configurable line styles, colors, and chart presentation

·  OTE entry alerts with optional MetaTrader 5 push notifications

A Practical Trading Workflow

Start with the broader market context rather than the colored zone alone. Determine whether the current chart supports a directional idea and whether the active swing is relevant to your method. Allow the indicator to confirm the structural leg and draw the Fibonacci framework. Then wait for price to approach or enter the OTE area instead of chasing an extended movement.

Once price reaches the zone, look for the confirmation your strategy normally requires. This may include a rejection candle, a change in short-term momentum, a reaction from nearby support or resistance, or alignment with a higher-level market view. Before acting, define where the setup becomes invalid, how much capital is at risk, and whether the available reward justifies the trade.

The alert system is intended to support this workflow. It can notify you when price moves from outside into an active, confirmed OTE zone, reducing the need to watch the chart continuously. An alert is a prompt to review the market, not an instruction to enter.

Who It Is For

Yoshi ICT Fibonacci OTE is suited to manual traders who use Fibonacci retracements, ICT-inspired OTE concepts, swing analysis, pullbacks, or price action confirmation. It may also be useful for traders who want a repeatable way to select and display retracement levels without repeatedly redrawing them by hand.

It is not designed for users expecting a fully automated Expert Advisor, guaranteed reversals, exact tops and bottoms, or standalone signals that replace analysis and risk management.

Important Notes

·  This product is an indicator, not an automated trading robot.

·  Swing points require subsequent bars before they are confirmed.

·  The active chart symbol and timeframe determine the displayed analysis.

·  OTE levels are observation zones and may not produce a price reaction.

·  Test the indicator and its settings on a demo account before using it in live trading.

Explore More from Ichiyoshi

Explore more strategy indicators and trading tools on the Ichiyoshi MQL5 Seller page:

https://www.mql5.com/en/users/ichiyoshi/seller

Risk Disclaimer

Trading Forex, CFDs, and other financial instruments involves risk. Yoshi ICT Fibonacci OTE is a technical analysis tool and does not guarantee trading results. Users remain responsible for market confirmation, position sizing, stop placement, and all trading decisions. Historical chart behavior does not guarantee future performance.


Mais do autor
Yoshi Pro Rejection Zones: A Smarter Way to Read Support, Resistance and Price Rejection on MetaTrader 5 In trading, one of the most important skills is knowing where the market is likely to react. Whether a trader focuses on forex, gold, indices, crypto, or CFDs, price often responds around meaningful support and resistance areas. These areas can become turning points, breakout zones, retest levels, or simply locations where traders should pay closer attention. The challenge is that most charts
FREE
UT Bot Yoshi Trend ATR MT5 – Professional ATR Trailing Stop Trend Indicator for MetaTrader 5 UT Bot Yoshi Trend ATR MT5 is a professional trend-following indicator for MetaTrader 5, designed to help traders read market direction, follow volatility-based trailing stop behavior, and organize Buy/Sell trading ideas with a clean visual structure. The indicator is built around a practical and well-known trading concept: ATR trailing stop logic . Instead of trying to predict the market or identify per
Pinbar Yoshi Pro – Clean Multi-Timeframe Pin Bar Detection for MetaTrader 5 Pinbar Yoshi Pro is a clean and practical MT5 indicator designed for traders who use price action, candlestick rejection, support and resistance, market structure and multi-timeframe analysis in their daily trading routine. The purpose of this tool is simple: to help traders detect bullish and bearish Pin Bar candles more clearly, more consistently and with less manual chart scanning. In real trading, a Pin Bar is not
FREE
Ichiyoshi Trend Pullback Framework for MT5 — Version 2.3 Holy Grail Inspired Trend-Pullback Indicator Ichiyoshi Trend Pullback Framework for MT5 — Version 2.3 is a professional trend-pullback indicator created for traders who want to read the market with structure, discipline and context. The framework is inspired by the practical logic of the well-known Holy Grail trend-pullback approach, widely associated with Linda Raschke’s professional trading philosophy. The idea is simple, but powerful: i
ORBYoshi V1.26 – Professional Opening Range Breakout Framework for MetaTrader 5 The Opening Range Breakout (ORB) is one of the most respected intraday trading concepts in modern market history. Popularized through the research and trading work of renowned traders such as Toby Crabel , Larry Williams , and Mark Fisher , the ORB methodology focuses on identifying directional opportunities that emerge after the market establishes its initial opening range. ORBYoshi was developed to bring this timel
Price Action Structure Yoshi for MetaTrader 5 Introduction Price Action Structure Yoshi is a professional Price Action and Market Structure Indicator designed for MetaTrader 5. This MT5 Indicator helps traders visualize market structure, liquidity areas, order blocks, liquidity sweeps, and trendline relationships directly on the chart in a clear and organized manner. Inspired by widely recognized Price Action Analysis and Market Structure concepts, the indicator focuses on helping traders unders
ATR-based trend signals, structured trade planning and higher-timeframe price-action context in one MetaTrader 5 indicator. LTYoshi_Pro is a decision-support indicator built around an ATR trailing-stop engine. It is designed to help traders organize trend signals, risk levels and market context without mixing every chart element into a single automatic decision. The indicator separates its work into independent layers. The core engine produces raw Buy/Sell events when the selected price source
SMC ICT Yoshi v2.19 Smart Money Concepts, Market Structure, Order Blocks and Fair Value Gaps for MetaTrader 5 SMC ICT Yoshi v2.19 is a multi-layer Smart Money Concepts (SMC) and ICT-style market structure indicator for MetaTrader 5. It brings market structure, liquidity references, Order Blocks, Fair Value Gaps, premium and discount zones, higher-timeframe context and session timing into one clear analytical workflow. The product is designed for traders who want more than isolated BOS, CHoCH or
MA Yoshi Pro Y02 A Multi-Layer MT5 Trend Indicator for Clearer Market Decisions Trading with moving averages may look simple, but the real challenge is understanding whether price, trend direction, momentum, market structure, and current market quality are working together—or sending conflicting messages. MA Yoshi Pro Y02 was designed to organize that decision-making process into one clear MetaTrader 5 workspace. At its core, MA Yoshi Pro Y02 is a multi-MA confirmation indicator for MT5. It use
Yoshi SMC Trend Planner Y02 for MT5 Market Structure, Trend Context and Structured Trade Planning for MetaTrader 5 Trade With Context, Not Isolated Signals A trading signal is easy to notice. The harder part is deciding whether that signal makes sense within the current market structure, price location and higher-timeframe direction. Many traders can identify a Buy or Sell arrow, yet still hesitate because the surrounding context is unclear. Yoshi SMC Trend Planner Y02 was designed to bring tho
Yoshi MTF Candlestick Patterns is a visual Price Action indicator for MetaTrader 5 that combines Three-Line Strike, Momentum Engulfing and closed-bar Pin Bar recognition in one clean chart workspace. A compact multi-timeframe panel reviews the latest closed candle on M1, M5, M15, M30, H1, H4 and D1, helping traders check candle-pattern context without repeatedly switching charts. Yoshi MTF Candlestick Patterns is a visual Price Action indicator for MetaTrader 5. It brings Three-Line Strike, Mome
Trend Yoshi
Le Quang Thanh
Volatility-Adaptive Trend Signals and Visual Trade Planning for MetaTrader 5 TrendYoshi is a manual decision-support indicator for MetaTrader 5 that combines ATR-based trend states, clear Buy/Sell transitions, session context, alerts and structured visual trade plans. A Clearer Way to Move from Trend Signal to Trade Plan A direction change alone is rarely enough. Traders still need to know where the trend reference sits, how much room exists between entry and invalidation, whether the setup appe
Market Structure, Liquidity and Price Action Analysis for MetaTrader 5 A chart can contain plenty of information and still leave a trader without a clear decision. A BOS label may appear, liquidity may be nearby, and an order block may remain active, yet the real challenge is understanding how those elements relate to one another. ICT Yoshi Pro organizes that process into a cleaner, more disciplined MetaTrader 5 workflow. What ICT Yoshi Pro Does ICT Yoshi Pro is a manual decision-support indicat
Structured ICT Market Analysis for MetaTrader 5 Reading a chart is rarely difficult because price lacks information. The real challenge is deciding which information matters now. A Break of Structure can support continuation, but the same event may mean something different near liquidity, inside an imbalance, or during an active session. Yoshi ICT Framework Y1.01 brings these elements into one organized MetaTrader 5 workspace, helping discretionary traders evaluate structure, location, timing, a
A structured MT5 liquidity-zone and relative delta framework for manual market analysis Marking a swing high or swing low is usually the easy part. The harder question comes when price returns: is the level still meaningful, is activity building inside the zone, and is the apparent sweep producing follow-through or only a temporary reaction? Manual traders often face these questions while managing several levels and changing market conditions. Liquidity D
FREE
Filtro:
Sem comentários
Responder ao comentário