Yoshi ICT Framework
- Indicadores
-
Le Quang Thanh
 Professional Trading Tools for MetaTrader 5
I specialize in developing high-quality indicators and Expert Advisors for MetaTrader 5, inspired by well-known trading methodologies used by professional traders and market researchers around the world. - Versão: 1.1
- Ativações: 10
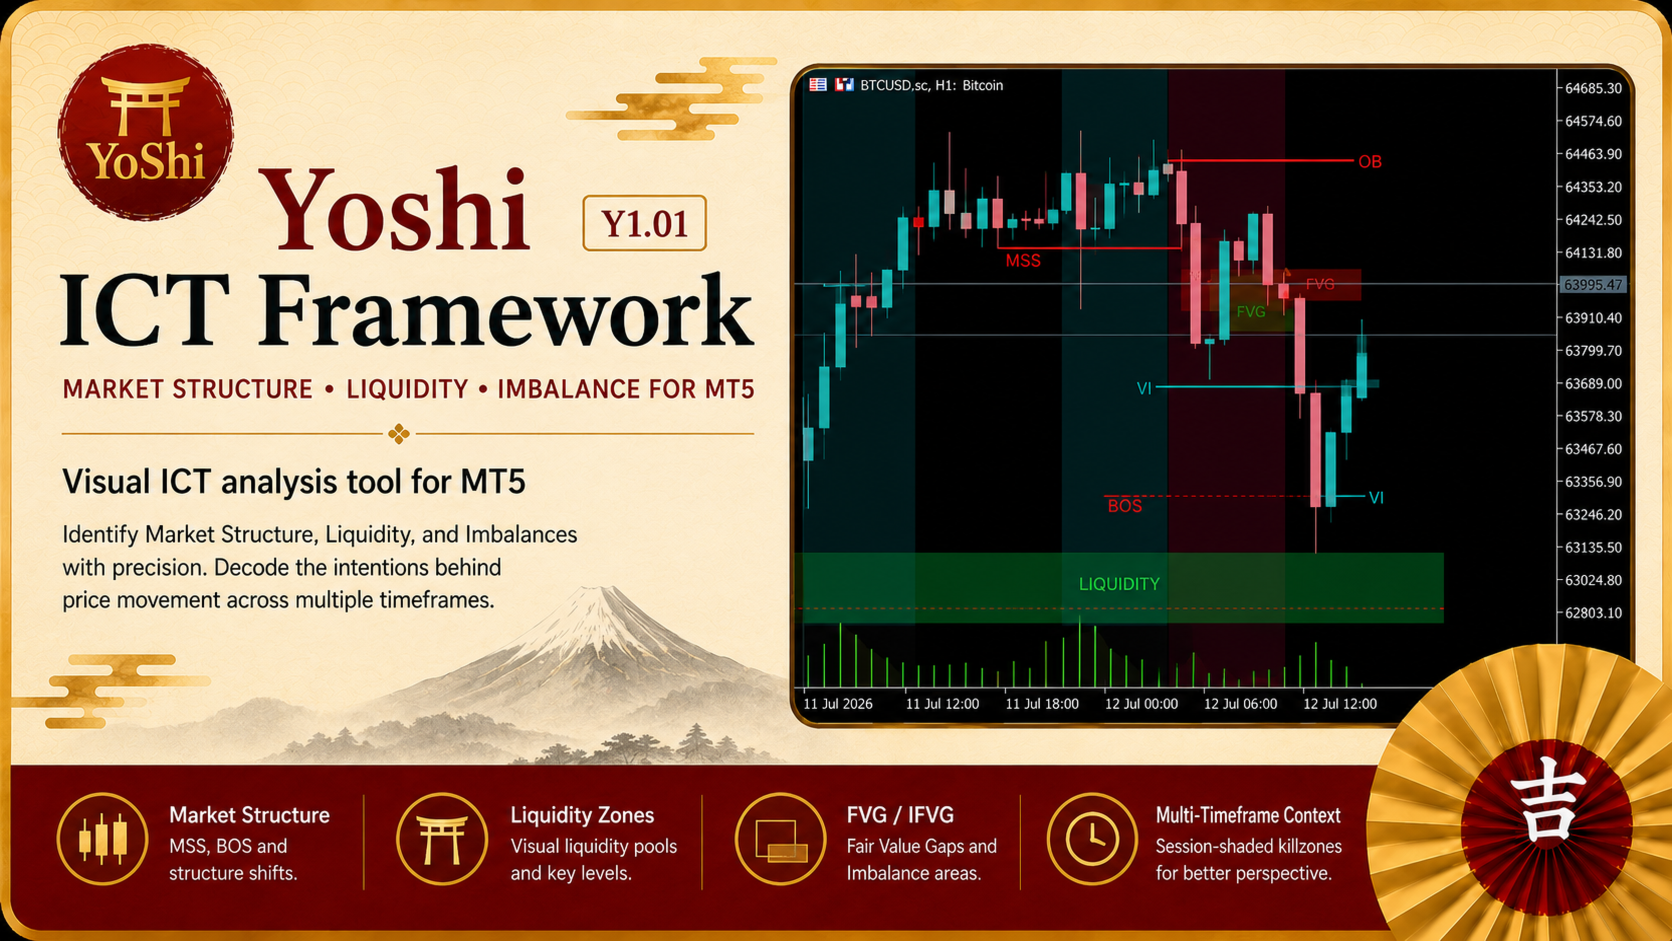
Structured ICT Market Analysis for MetaTrader 5
| Reading a chart is rarely difficult because price lacks information. The real challenge is deciding which information matters now. A Break of Structure can support continuation, but the same event may mean something different near liquidity, inside an imbalance, or during an active session. Yoshi ICT Framework Y1.01 brings these elements into one organized MetaTrader 5 workspace, helping discretionary traders evaluate structure, location, timing, and context before committing risk. |
A Practical Framework, Not an Automatic Trading System
Yoshi ICT Framework Y1.01 is an ICT indicator for MetaTrader 5 designed for manual analysis and decision support. It does not open, manage, or close trades. Instead, it maps relevant market information directly on the chart so traders can follow a clear process rather than react to one isolated label or zone.
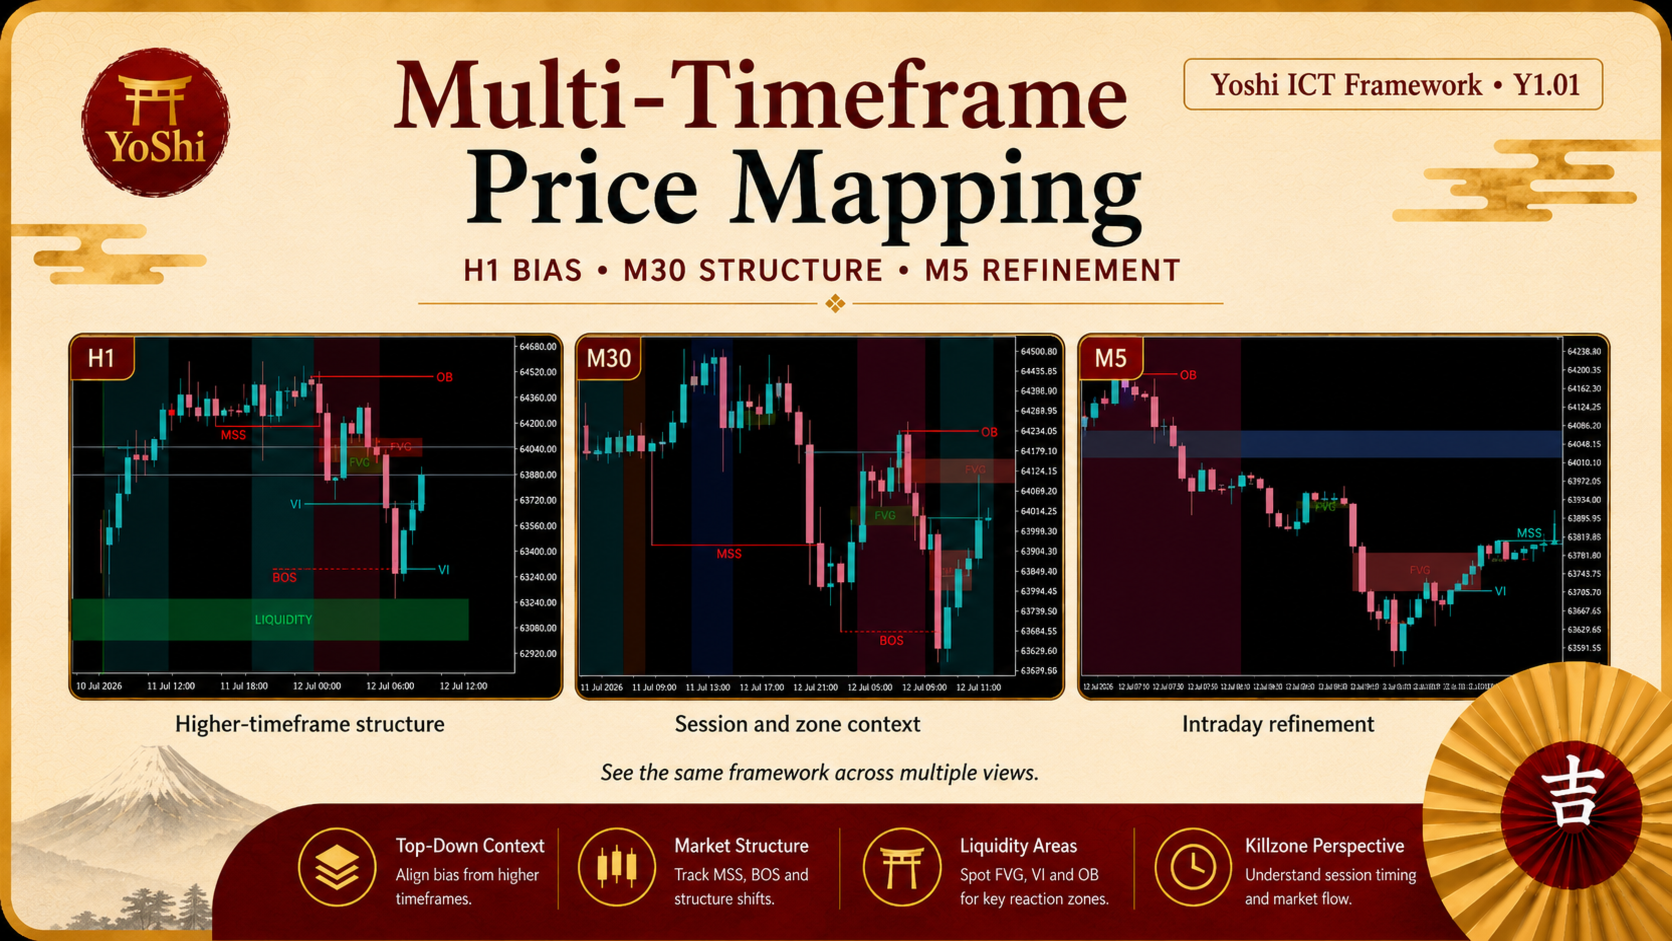
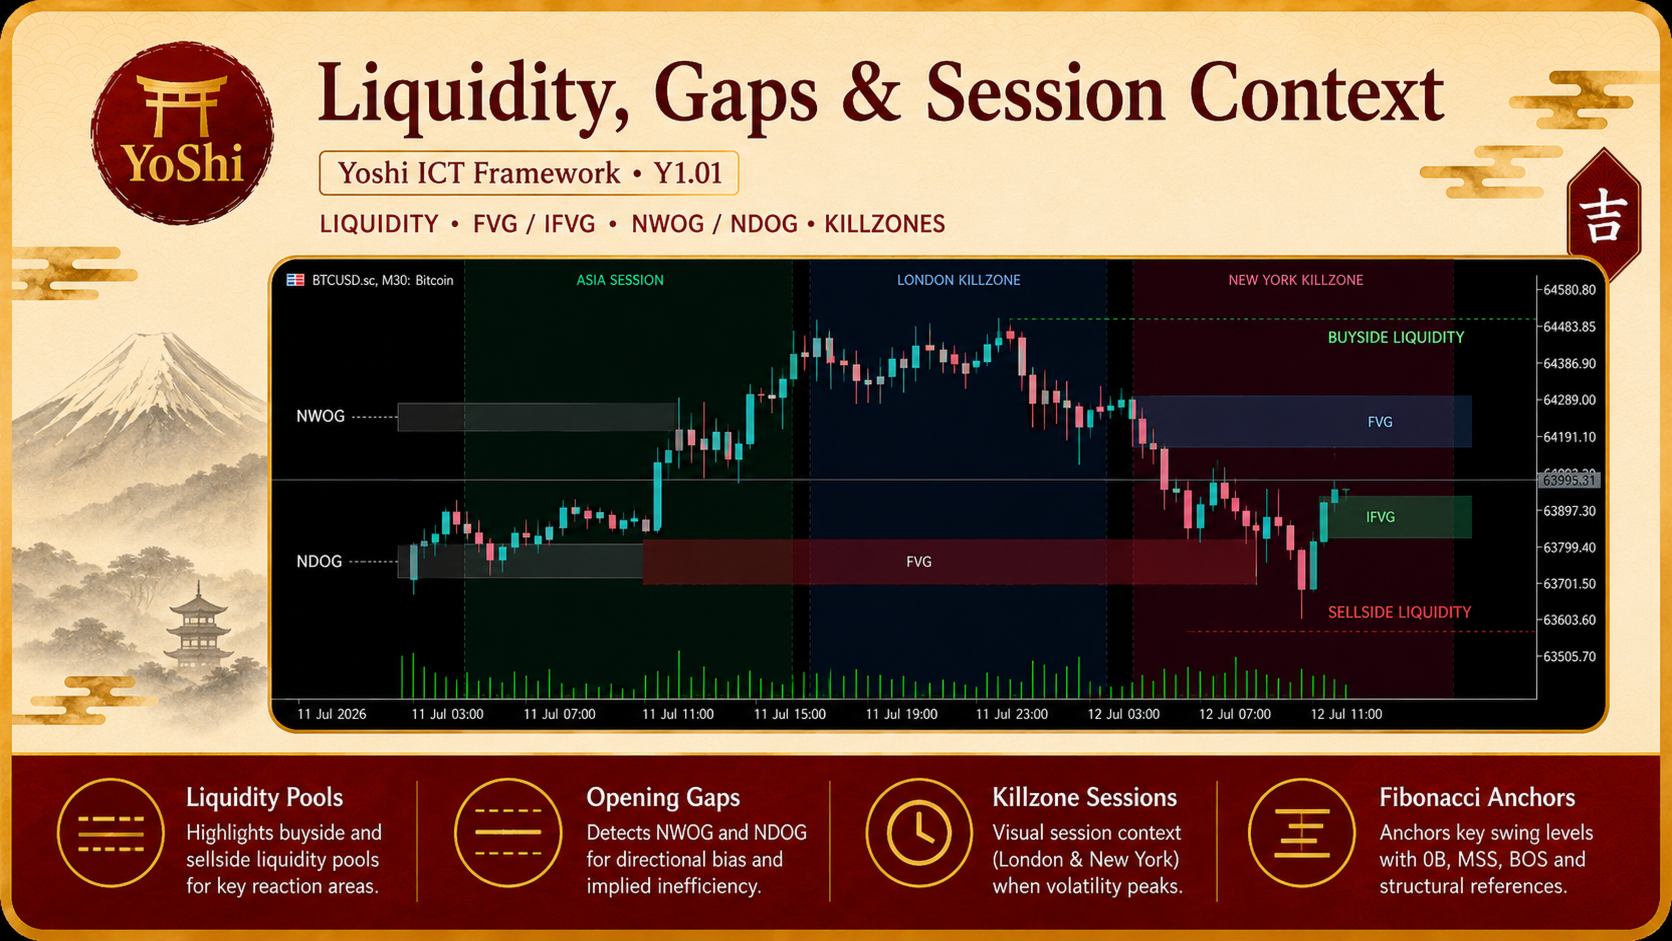
The framework follows a practical principle: a setup becomes more meaningful when several independent layers agree. Market structure explains direction and change. Liquidity highlights areas where price may seek orders. Order Blocks and Fair Value Gaps provide location. Displacement and Volume Imbalance show expansion. Opening gaps, Fibonacci references, and Killzones add time and price context.
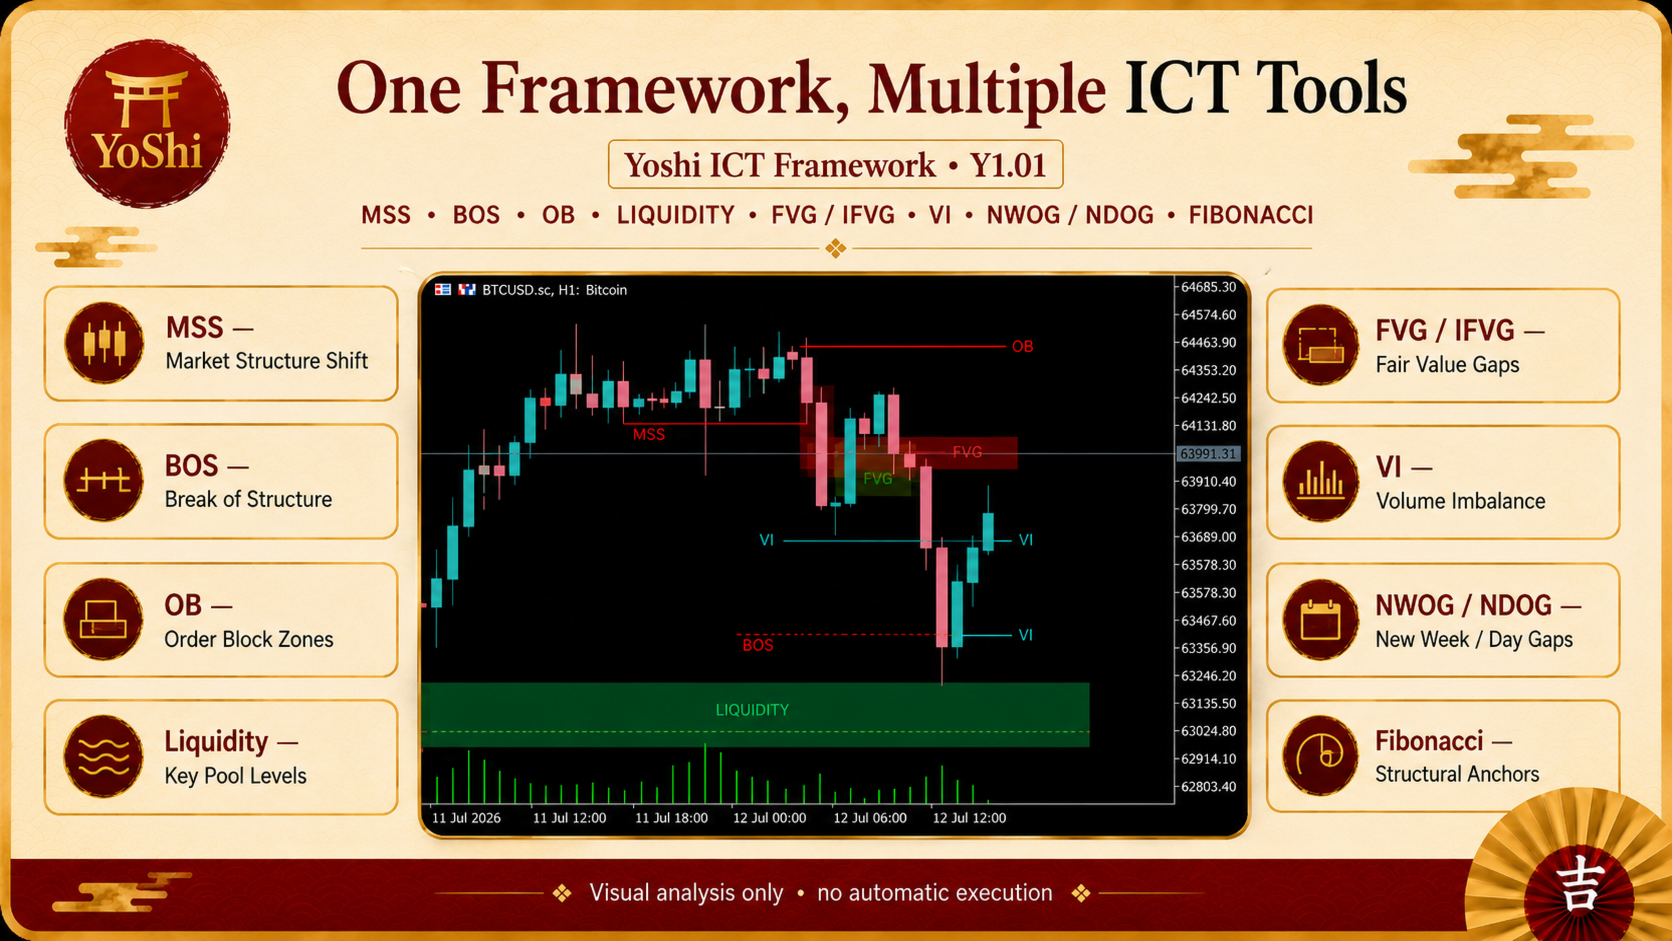
Key Analytical Tools
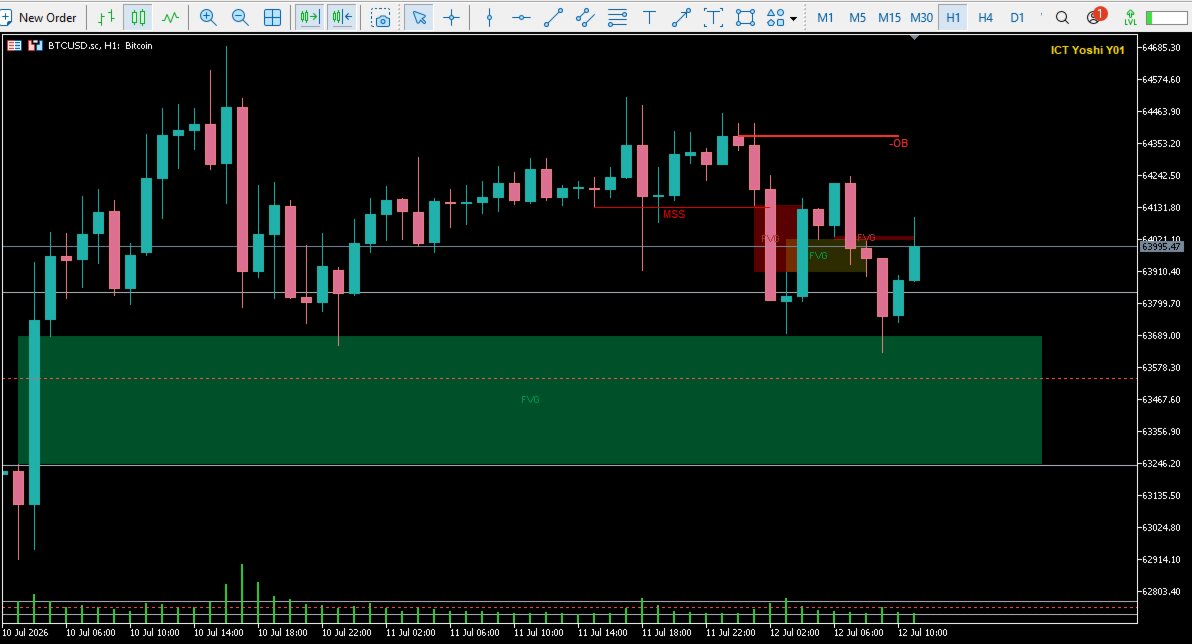
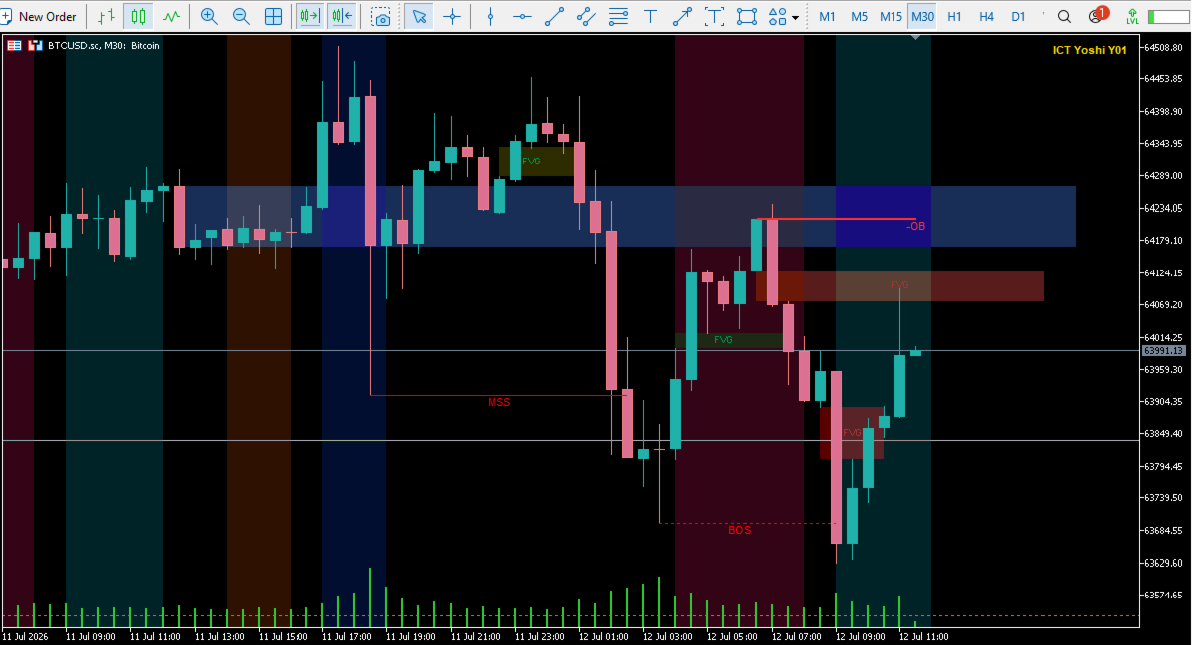
· Market Structure Shift and Break of Structure mapping
· Buyside and sellside liquidity zones
· Bullish and bearish Order Blocks with breaker behavior
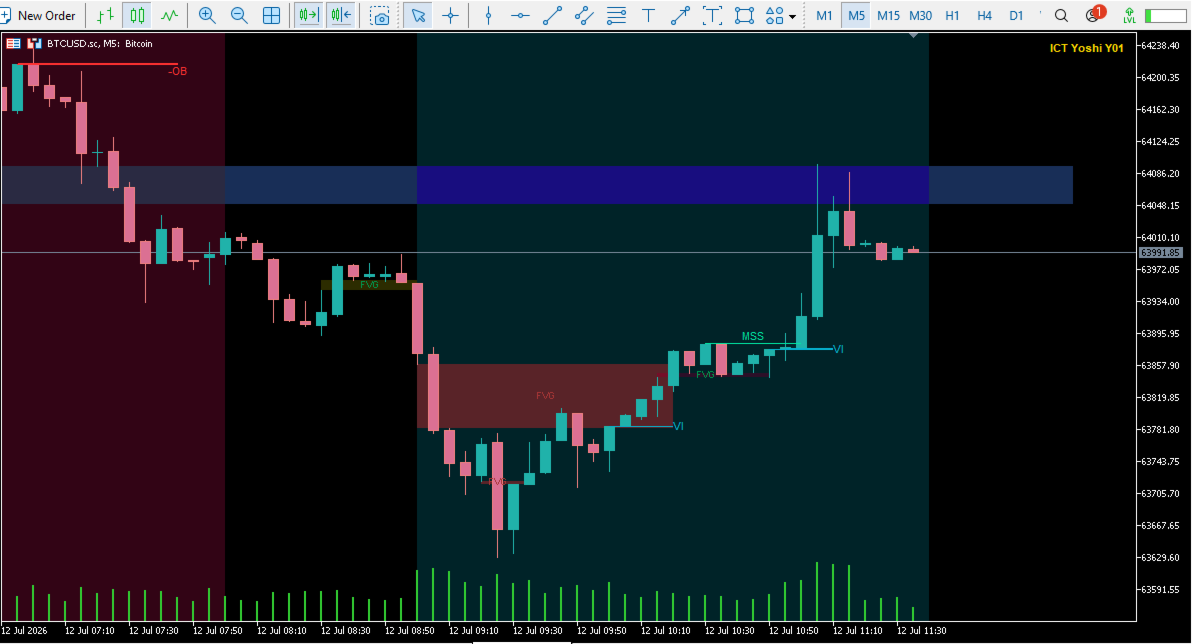
· Fair Value Gaps, Implied Fair Value Gaps, and Balance Price Ranges
· Volume Imbalance and displacement markers
· New Week and New Day Opening Gaps
· Fibonacci levels based on selected chart features
· New York, London, and Asian Killzone overlays
From Isolated Signals to Structured Decisions
Many traders can identify a BOS, FVG, or Order Block. The harder task is deciding whether it belongs to a coherent trade idea. Yoshi ICT Framework Y1.01 helps organize that evaluation.
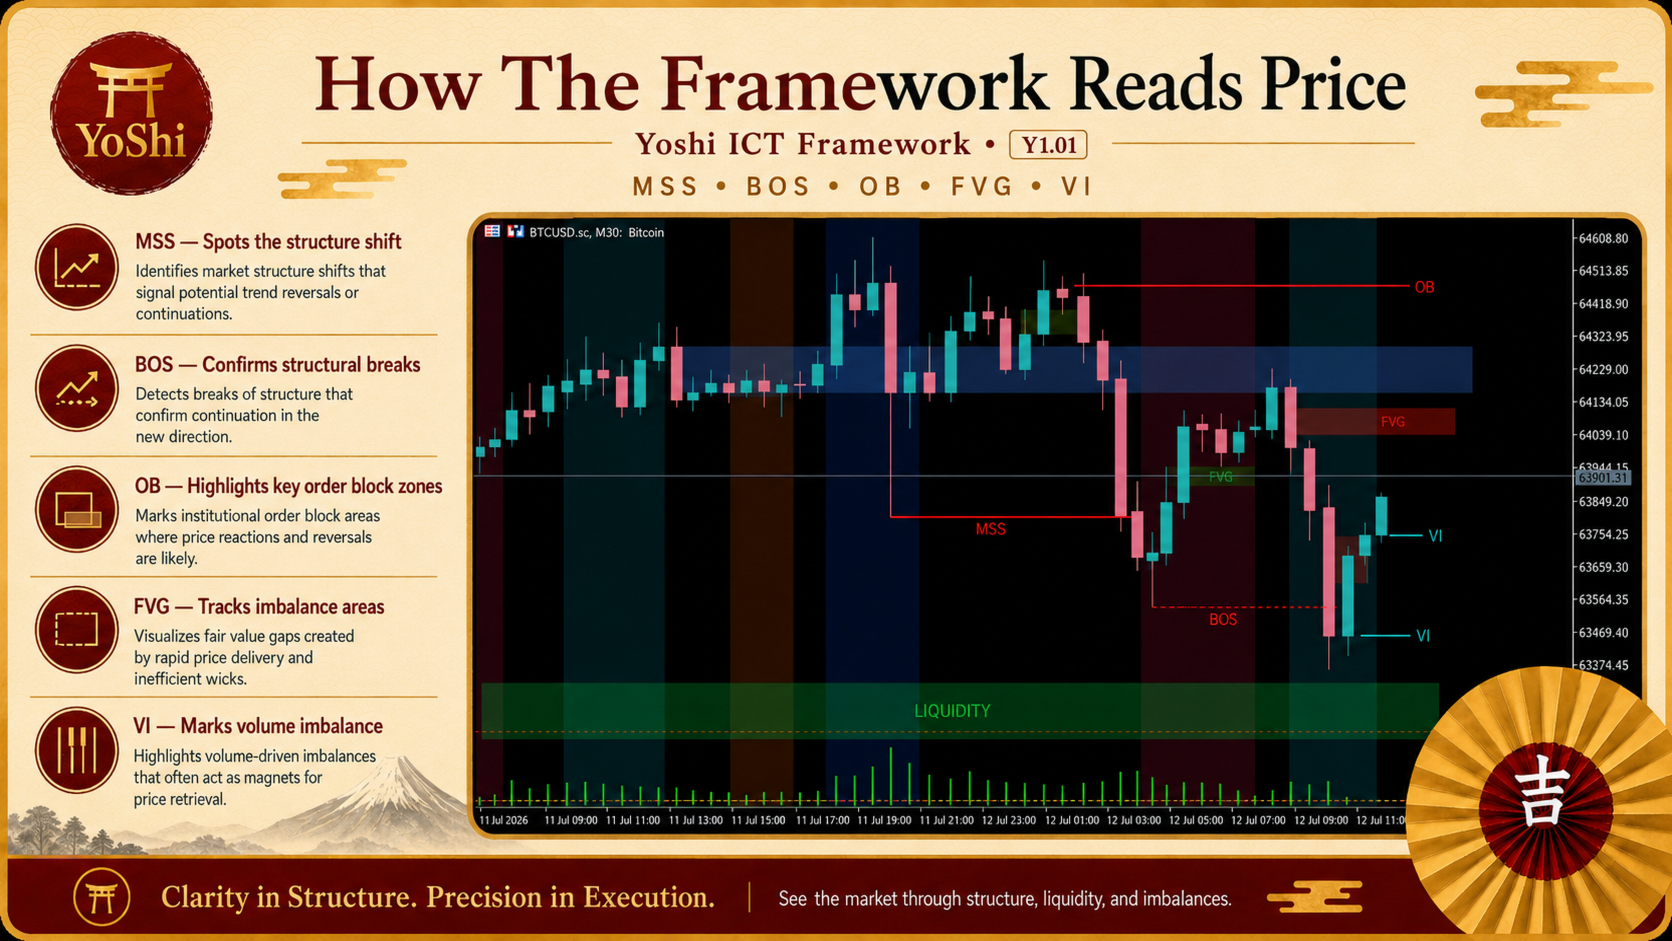
The market structure layer highlights directional shifts and continuation events through MSS and BOS. Liquidity zones show areas formed around repeated swing highs or lows, helping traders observe how price approaches or moves through these levels. Order Blocks provide reference areas around structural breaks, while breaker behavior tracks zones whose role has changed.
Fair Value Gaps and Implied Fair Value Gaps make imbalance areas easier to follow. Balance Price Ranges focus on overlaps between opposing imbalance zones. Displacement and Volume Imbalance add evidence of expansion, while NWOG and NDOG levels provide weekly and daily opening references. Fibonacci can connect recent selected features, and Killzones place the analysis inside specific trading windows.
A Practical Workflow
1. Start with structure. Identify continuation or a meaningful shift.
2. Check location. Review nearby liquidity, Order Blocks, Fair Value Gaps, and opening gaps.
3. Look for agreement. Assess whether displacement, imbalance, and session timing support the idea.
4. Define invalidation before considering an entry.
5. Apply personal risk rules and avoid acting on a single chart object.
This workflow is useful when several zones look attractive. Rather than treating every object as a signal, the trader can filter weaker ideas by asking whether structure, location, and timing agree.
Flexible Chart Control
Present mode focuses on the latest market development and reduces clutter during live analysis. Historical mode retains more previous structure and imbalance information for chart review. Traders can also control the number of visible zones, adjust colors and opacity, and choose which analytical layers remain on the chart.
Who It Is For
Yoshi ICT Framework Y1.01 is suited to manual Forex, gold, index, cryptocurrency, and CFD traders who use ICT or Smart Money Concepts and want a more organized chart-reading process on MT5. It can also support traders who currently spend time drawing liquidity, imbalances, structure, and session references by hand.
It is not intended for anyone expecting automatic entries, fixed buy or sell instructions, exact tops or bottoms, guaranteed zone reactions, or a substitute for risk management.
Important Notes
· This is a MetaTrader 5 indicator, not an Expert Advisor.
· It does not execute or manage trades.
· Information on the current open candle may change as price develops.
· Results vary by symbol, timeframe, broker data, and market conditions.
· Session and opening-gap placement can be influenced by broker time.
· Demo testing and personal validation are recommended before live use.
| To explore more carefully developed strategy indicators, visit the Ichiyoshi MQL5 Seller page. |
Risk Disclaimer
Trading Forex, CFDs, metals, indices, and cryptocurrencies involves substantial risk. Yoshi ICT Framework Y1.01 is an analytical tool and does not guarantee profit, accuracy, or future market behavior. Users remain responsible for trade selection, position sizing, risk control, and independent testing before using real funds.