Supertrend Parameter Sensitivity 3D

NeuronSurface — see which Supertrend settings actually work

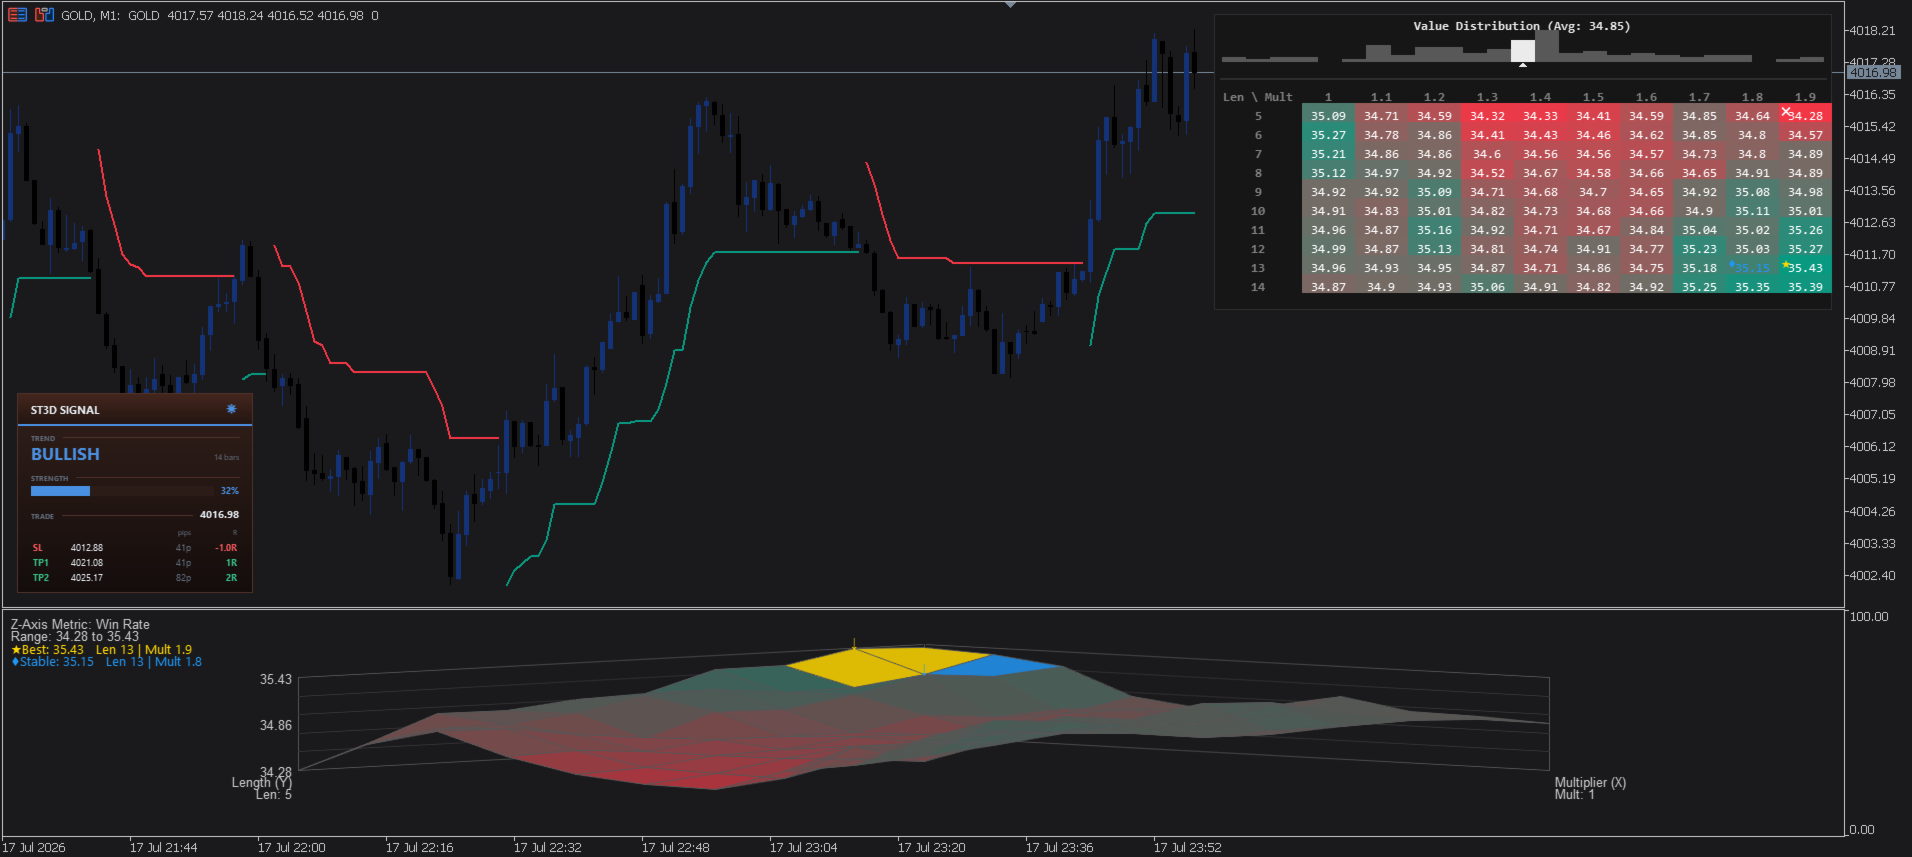
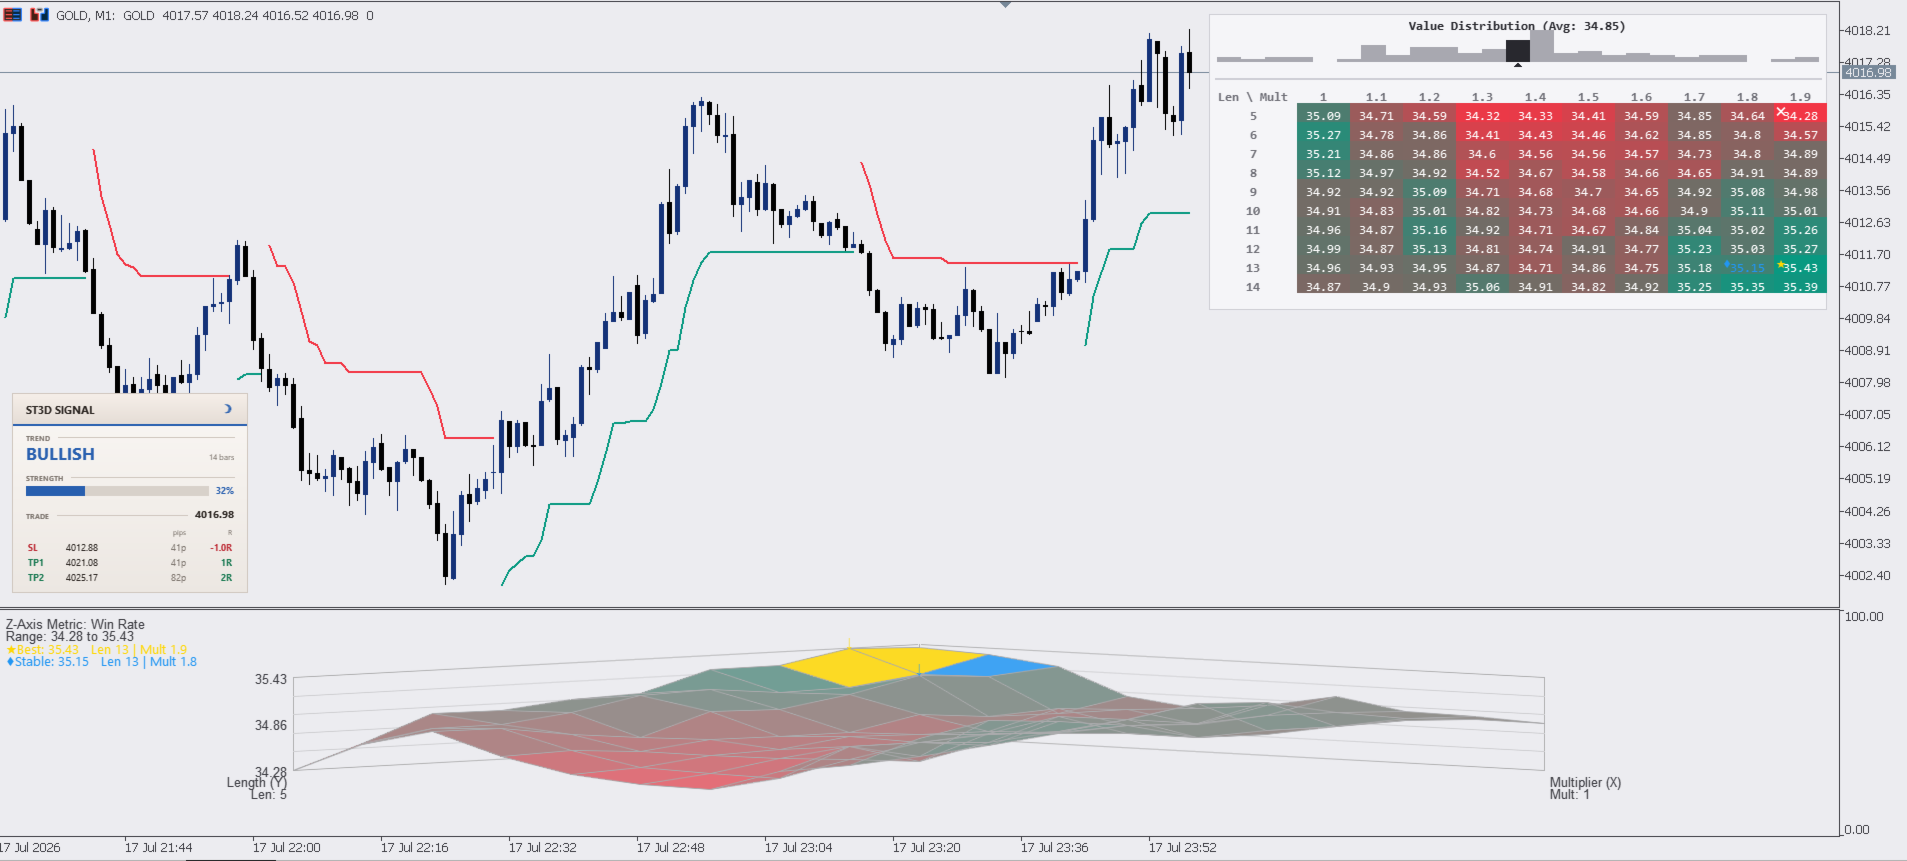
Stop guessing your ATR length and multiplier. NeuronSurface back-tests 100 Supertrend variants on every bar (10 lengths × 10 multipliers), scores each one on the metric you choose, and shows the result three ways at once — a live 3D surface, a colour-coded matrix and a distribution histogram — with the best and the most stable settings flagged automatically.

At a glance: 100 combinations per bar · 10 × 10 length/multiplier grid · 9 scoring metrics · MetaTrader 5 · indicator only (it does not trade).

One indicator, four synchronised views

Every view is driven by the same engine, so they always agree.

  • 3D surface — an isometric height-map of the score across all 100 settings. Peaks are strong settings, valleys are weak ones.
  • Heat-map matrix — the same 100 values as a 10×10 grid of exact numbers, coloured low to high, with the best / worst / most-stable cells marked.
  • Distribution histogram — how the scores are spread and where the average sits, so you can tell a broad edge from a lucky spike.
  • Signal panel — the plotted Supertrend distilled to trend, strength and a ready trade: entry, stop and two targets.

The sensitivity engine

Two ranges define the grid. The Length axis takes 10 ATR periods; the Multiplier axis takes 10 multipliers — 100 Supertrends in total. Each one runs a full closed-bar back-test on your chart history, and the metric you pick becomes its score: the surface height and the matrix colour.

Axis Parameter Values Default
Y (depth) ATR Length 10 steps from Length Start by Length Step 5 to 14
X (width) Multiplier 10 steps from Mult Start by Mult Step 1.0 to 1.9
Z / colour Metric score chosen statistic per combination Win Rate

Best vs. Stable — the important distinction

The single highest-scoring cell is often a fragile spike: nudge a parameter one step and it collapses. NeuronSurface also finds the stable region — the neighbourhood that scores well and holds up when the parameters move. That is the setting you can actually trust out-of-sample.

Marker Meaning How it is chosen
Best (star) Highest metric value in the grid The single top-scoring cell of the 100
Worst (cross) Lowest metric value in the grid The single bottom-scoring cell
Stable (diamond) Most robust region Centre of the 3×3 block with the best (average minus 1.5 × standard deviation)

Turn on Auto Apply Stable Parameters and the plotted Supertrend follows the stable cell automatically, bar by bar, instead of a fixed length/multiplier you set by hand.

Nine ways to score a setting

Pick the statistic that matches how you trade. It re-scores all 100 combinations and redraws every view instantly.

Metric Definition Reads high when
Win Rate wins / trades × 100 most signals close in profit
Net Profit gross profit − gross loss the setting is net positive overall
Profit Factor gross profit / gross loss winners far outweigh losers
Total Trades count of completed signals the setting is active / fast
Average Trade net profit / trades each signal carries more edge
Reward/Risk Ratio average win / average loss wins are bigger than losses
Gross Profit sum of winning-trade returns raw upside is large
Total Wins count of winning trades many signals land
Win/Loss Ratio wins / losses winners outnumber losers

The signal panel

A compact panel mirrors whatever Supertrend is on the chart — your manual line, or the stable one when Auto Apply is on — and distils it into three reads. A sun/moon icon flips the whole tool between light and dark.

Section Shows Meaning
Trend Bullish / Bearish + bars Direction of the plotted Supertrend and how long it has held
Strength 0 to 100% How far price has travelled from the trend's start, measured in ATR
Trade Entry / SL / TP1 / TP2 Market entry, the Supertrend stop, and two R-multiple targets

Inputs

Setting Default What it does
Main Indicator
Auto Apply Stable Parameters false Plot the most-stable combination's Supertrend instead of the manual line below.
ATR Length 10 ATR period of the manually-plotted Supertrend.
Multiplier 3.0 ATR multiplier of the manually-plotted Supertrend.
Sensitivity Ranges
Length Start 5 First ATR length on the depth axis.
Length Step 1 Increment between the 10 lengths.
Multiplier Start 1.0 First multiplier on the width axis.
Multiplier Step 0.1 Increment between the 10 multipliers.
Optimization
Metric Win Rate The statistic that scores every combination (drives surface height and matrix colour).
3D Surface Style
High Value Color green Colour for the highest scores (peaks).
Low Value Color red Colour for the lowest scores (valleys).
Wireframe Color grey Colour of the surface mesh lines.
Stable Area Color blue Highlight colour for the stable region.
X Spacing / Y Spacing % / Z Height % 2 / 2.0 / 20.0 Surface footprint width, depth and peak height.
Dashboard
Enable Dashboard true Show the histogram and 10×10 matrix panel.
Position Top Right One of nine chart anchors.
Size Small Auto, Nano, Micro, Tiny, Small, Normal, Large or Huge.
Chart Theme (applied on attach)
Recolor chart on attach true Apply the theme to the chart; your original colours are restored on removal.
Background dark grey Chart background in dark mode.
Bull candle dark blue Up-candle body and wick.
Bear candle black Down-candle body and wick.
Signal Panel
Show suggested-entry panel true Show the trend / strength / trade panel.
Panel position Bottom Left One of nine chart anchors.
Start in dark mode true Initial theme; the sun/moon icon toggles it live.
TP1 distance in R 1.0 First target, in multiples of the entry-to-stop risk.
TP2 distance in R 2.0 Second target, in R.
Rendering
Supertrend history (bars) 500 How many recent bars the Supertrend line is drawn for.
Intrabar redraw throttle (ms) 400 Minimum interval between live redraws (performance).

Good to know

  • Closed-bar committed — historical scores are fixed once a bar closes; only the forming bar updates live. The engine recomputes from full chart history, so more data means more reliable statistics.
  • Indicator, not an EA — NeuronSurface analyses and draws. It does not place, modify or close orders; the trade panel is guidance you act on yourself.
  • Platform — MetaTrader 5, any symbol and timeframe. Rendered through the built-in Canvas, with no DLLs. The 3D surface sits in its own sub-window; the panels overlay the price chart.
  • Light & dark — one click re-themes the chart, the surface and both panels together. Your original chart colours are saved on attach and restored when you remove the indicator.
Mais do autor
NeuronLiquidity is a chart-overlay indicator for MetaTrader 5 from Neuron Systems that maps where liquidity rests and marks the exact bar where it is taken. It is an indicator only: it draws on your chart and raises alerts. It does not place trades, it does not send buy or sell orders, and it does not manage positions or accounts. Native MQL5, no DLLs, no external dependencies. Works on any symbol (forex, gold and metals, indices, crypto) and any timeframe. === HOW IT FINDS LIQUIDITY POOLS === A
SuperTrend V
Muhammad Hassaan
*This is TradingView indicator converted to mql4* The SuperTrend V indicator is a popular technical analysis tool used to identify trends and potential trend reversals in financial markets. It is based on the concept of the SuperTrend indicator but incorporates additional features and variations. The SuperTrend V indicator uses a combination of price action and volatility to determine the trend direction and generate trading signals. Here are the key components and features of the indicator: Ca
FREE
Trade. Allows you to perform basic trading operations in one click directly from the chart. Trading operations: Open Buy and Sell market positions with one click. Specify lot size manually before opening a trade. Set Stop Loss and Take Profit as price levels . Stop Loss and Take Profit are automatically initialized at a fixed distance from the current market price (default: ±50 pips , symbol-aware). Fully supports Forex, Metals (XAUUSD), Indices, and other MT5 symbols with correct price formatti
FREE
Trend Magicc
Muhammad Hassaan
*This is tradingview indicator converted to mql5* The Trend Magic Indicator is a popular technical analysis tool used to identify the direction of a market trend and potential trend reversals. It is a versatile indicator that can be applied to various financial instruments and timeframes. The Trend Magic Indicator consists of a combination of moving averages and a volatility-based filter. It aims to smooth out price fluctuations and provide a clearer visualization of the underlying trend. Here
FREE
*This is tradingview indicator converted to mql4* The Chandelier Exit Indicator is a popular technical analysis tool developed by Chuck LeBeau. It is designed to help traders identify potential exit points for their trades based on market volatility and the concept of trailing stops. The Chandelier Exit Indicator consists of three main components: Average True Range (ATR): The indicator utilizes the Average True Range, which measures market volatility. The ATR calculates the average range betwe
FREE
*This is tradingview indicator converted to mql4* The CM Slingshot System Indicator is a trading tool that aims to identify potential trade setups based on market volatility and price action. It is designed to help traders spot entry and exit points in trending markets. The CM Slingshot System Indicator combines multiple indicators and techniques to generate trading signals. Here are the key features and components of the indicator: Bollinger Bands: The indicator incorporates Bollinger Bands, w
FREE
UT bot alerts
Muhammad Hassaan
*This is tradingview bot converted to mql4* The UT Bot Alert Indicator is an advanced technical analysis tool designed to help traders optimize their trading performance. This innovative indicator is based on the proven UT Bot system, which utilizes multiple indicators to deliver accurate signals that can help traders make better decisions. The UT Bot Alert Indicator provides a range of features that can help you stay on top of market trends and capitalize on opportunities. Here are some of its
UT bot alert
Muhammad Hassaan
UT Bot Alerts is a technical indicator for MetaTrader 5 that highlights potential directional changes based on momentum conditions. The indicator marks signal points directly on the chart and can generate optional notifications for convenience. The signal generation logic can operate in two modes: Closed-bar mode: signals are confirmed only after the bar closes. Live-bar mode: signals are displayed during the formation of the current bar. Both modes are available depending on the user's preferr
HA Market Bias
Muhammad Hassaan
*This is trading view indicator converted in mql5* The HA Market Bias Indicator is a popular tool used in trading and technical analysis, designed to help traders identify market bias and potential trend reversals. It is commonly used in conjunction with candlestick charts and provides valuable insights into market sentiment. The indicator is based on the Heiken Ashi (HA) candlestick charting technique, which aims to filter out market noise and provide a smoother representation of price action.
The trendlines with breaks indicator return pivot point based trendlines with highlighted breakouts. Users can control the steepness of the trendlines as well as their slope calculation method. Trendline breakouts occur in real-time and are not subject to backpainting. Trendlines can however be subject to repainting unless turned off from the user settings. The indicator includes integrated alerts for trendline breakouts. Any valid trendlines methodology can be used with the indicator, users
AI Range Breaker
Muhammad Hassaan
Note: Kindly inbox me for setfile AI Range Breaker watches a time window you choose each day, marks that session’s high and low , then automatically places pending buy/sell orders just outside the range. If price breaks out, the EA manages the trade with breakeven, candle-based trailing, optional partial close, and a single scale-in once price moves in your favor. If nothing happens, the pending orders are removed after a set number of candles—keeping your chart and account clean. Best use Work
SMC Flow Cloud
Muhammad Hassaan
SMF Cloud is a clean, lightweight chart indicator that visualizes directional market flow using an adaptive trend “cloud”, dynamic volatility bands, retest markers, and a TradingView-style strength gauge. It is designed for fast decision-making: identify trend shifts, measure trend strength, and spot pullback/retest opportunities at a glance. Key Features Smart Money Flow Trend Cloud Smooth trend baseline (EMA or ALMA) with optional additional smoothing. Clear bullish/bearish flow visualization
This indicator builds a Pivot Anchored Volume Profile (VAP/VPOC approximation using tick volume) and automatically splits the profile into pivot-to-pivot segments , giving you a clean, TradingView-like view of where volume concentrated during each swing. It draws a horizontal histogram for every segment and highlights the Value Area and key levels, making it easy to spot acceptance/rejection zones, high-volume nodes, and potential support/resistance. Key Features Segmented Volume Profile (Pivot-
Chandelier Exit PRO A precise and reliable trend-following indicator for MetaTrader 5 Chandelier Exit PRO is a professionally engineered implementation of the Chandelier Exit indicator, designed to closely match the original version in both logic and signal behavior. It provides clear trend direction, dynamic stop levels, and well-timed reversal signals, making it suitable for traders who require consistency and accuracy in their decision-making. Core Features Accurate Logic This indicator repli
NeuronScanner - Multi-Symbol Multi-Timeframe Confluence Scanner for MetaTrader 5 NeuronScanner is an on-chart scanner and dashboard for MetaTrader 5. It shows a colour-coded grid of confluence scores across many symbols and timeframes on one panel, so you can review a whole watchlist at once. Works on any symbol: forex, metals, gold, indices and crypto. HOW IT WORKS For every symbol and timeframe in the grid, NeuronScanner reads eight indicators and turns each into a simple vote - bullish, be
NeuronStructure reads market structure the way a desk does and labels every event on the exact closed bar that confirmed it, so what you see now is what you would have seen then. It is an indicator for chart analysis only: it draws on the chart, it does not place, modify or close trades, it does not send orders, and it does not manage positions or accounts. It is the market-structure companion to NeuronLiquidity, built to sit alongside it: structure tells you the framework and bias, liquidity te
NeuronSessions maps the four trading sessions, Sydney, Tokyo, London and New York, directly on your chart and keeps the read honest: a completed session is frozen and never redrawn, only the live one develops. It is an indicator for chart analysis only: it draws on the chart, it does not place, modify or close trades, it does not send orders, and it does not manage positions or accounts. It is the sessions companion to NeuronLiquidity and NeuronStructure, and is built to sit alongside them: stru
NeuronSniper is a complete ICT (Inner Circle Trader / smart-money) workspace and setup engine for MetaTrader 5 from Neuron Systems. It maps the whole picture, market structure, liquidity, order blocks, fair value gaps and premium/discount, and then marks one strict, high-quality reversal setup with a fixed risk:reward plan. It is an indicator for chart analysis only: it draws on the chart, it does not place, modify or close trades, it does not send orders, and it does not manage positions or acc
NeuronFlow is a smart-money trend-continuation toolkit for MetaTrader 5 from Neuron Systems. It reads market structure and then, on every confirmed break, marks a continuation setup, a pullback into the fresh order block or fair value gap left by the move, in the direction of the trend, with a fixed risk:reward plan. It is an indicator for chart analysis only: it draws on the chart, it does not place, modify or close trades, it does not send orders, and it does not manage positions or accounts.
NeuronTrend is a premium adaptive trend engine for MetaTrader 5 from Neuron Systems. It draws one clean, non-repainting baseline that colours the trend blue (up) or red (down), surrounds it with a translucent neon trend cloud, and reads the trend across timeframes in a live dashboard. It is an indicator for chart analysis only: it draws on the chart, it does not place, modify or close trades, it does not send orders, and it does not manage positions or accounts. Native MQL5, no DLLs, non-repaint
NeuronCloud is a premium moving-average cloud for MetaTrader 5 from Neuron Systems. A fast and a slow moving average fill a translucent neon cloud behind the candles and colour it blue (up) or red (down), while a multi-MA ribbon between them shows when a trend is fanning out or compressing into a squeeze. It is an indicator for chart analysis only: it draws on the chart, it does not place, modify or close trades, it does not send orders, and it does not manage positions or accounts. Native MQL5,
NeuronIchimoku is a premium Ichimoku Kinko Hyo indicator for MetaTrader 5 from Neuron Systems. It draws the full classic Ichimoku system, projects the cloud forward of price, and scores every Tenkan/Kijun cross with a transparent five-factor confidence engine so you can see, at a glance, which crosses agree with the bigger picture and which do not. It is an indicator for chart analysis only: it does not place, modify or close trades, it does not send orders, and it does not manage positions or a
NeuronQuant is a premium quant analytics indicator for MetaTrader 5 from Neuron Systems. It reads the chart with the kind of statistical tools common in quantitative analysis: a forward expected-move range, realized volatility, a market-regime read and a standardized z-score. It is an indicator for chart analysis only: it does not place, modify or close trades, it does not send orders, and it does not manage positions or accounts. Native MQL5, no DLLs, non-repainting closed-bar logic. Works on a
NeuronPropGuard — prop-firm rule compliance & trade management for MT5 Most funded accounts are not lost on bad entries — they are lost on a single trade that crosses the daily-loss line or the max-drawdown floor. NeuronPropGuard keeps those rules in front of you in real time, sizes every trade against the room you actually have left, and can step in before a buffer is breached. It reads only your own MetaTrader 5 account — no external feed, no signals, no profit promises. It cannot guarantee co
NeuronDivergence — multi-oscillator confluence divergence engine for MT5 A single oscillator showing divergence is a hint; three agreeing at once is a setup. NeuronDivergence reads RSI, MACD and Stochastic together, finds regular and hidden divergence on each, and only marks a signal when enough of them agree — then scores that agreement 0–100 with a confidence engine and draws it on your chart with entry, stop and target levels, a command dashboard and alerts. It is non-repainting and closed-ba
NeuronCopier — a local MT5 trade copier that actually thinks Most copiers blindly mirror lots. NeuronCopier verifies the symbol by price, sizes each trade by risk, scores the master it is copying, protects the receiving account against prop-firm and drawdown breaches, and ships with a full on-chart trade manager. It mirrors trades from one MetaTrader 5 account to one or many others running on the same PC , instantly and reliably, through the shared terminal data folder. 100% native MQL5 — no DLL
NeuronReplay — replay each of your closed trades one by one, bar-by-bar, and analyze exactly what happened Your trade history is just a list of numbers. NeuronReplay turns it into film. It lists every closed trade in a dashboard; click any one and it re-plays that single trade candle-by-candle on its own chart , exactly like stepping through the MetaTrader 5 Strategy Tester — but scoped to a real trade you already took. You see the entry, the stop, the target and the exit drawn in, a floating P&
NeuronJournal - Trading Journal and Analytics Dashboard for MetaTrader 5 NeuronJournal reads your own MetaTrader 5 closed-trade history and presents it as an analytics dashboard inside the terminal. It shows your performance metrics, a calendar of daily results, a quant-style score of your trading, and a detailed breakdown of every trade and every day, with a built-in notes journal. It is an analytics and journaling tool only. It reads your account and draws. It does not give trading signals and
Neuron Replay — Bar Replay & Paper‑Trading Trainer Neuron Replay turns any MetaTrader 5 chart into a TradingView‑style market replay and risk‑free practice simulator . Rewind any symbol to any point in its history, then step through it bar‑by‑bar — or auto‑play it — and practice your entries, exits and trade management on a fully interactive on‑chart panel. Every trade is 100% simulated (paper / "ghost" trading): the tool never sends a single real order to your account, so you can train your str
Filtro:
Sem comentários
Responder ao comentário