
Supertrend Parameter Sensitivity 3D
- Indicateurs
-
Muhammad Hassaan
 I'm a quant-minded trader and developer. I build MetaTrader tools the way a quant builds models — deterministic, rules-based and non-repainting. No black boxes and no hype: every level and signal comes from defined price-structure logic you can see, tune and verify.
 - Version: 1.0
- Activations: 5
NeuronSurface — see which Supertrend settings actually work
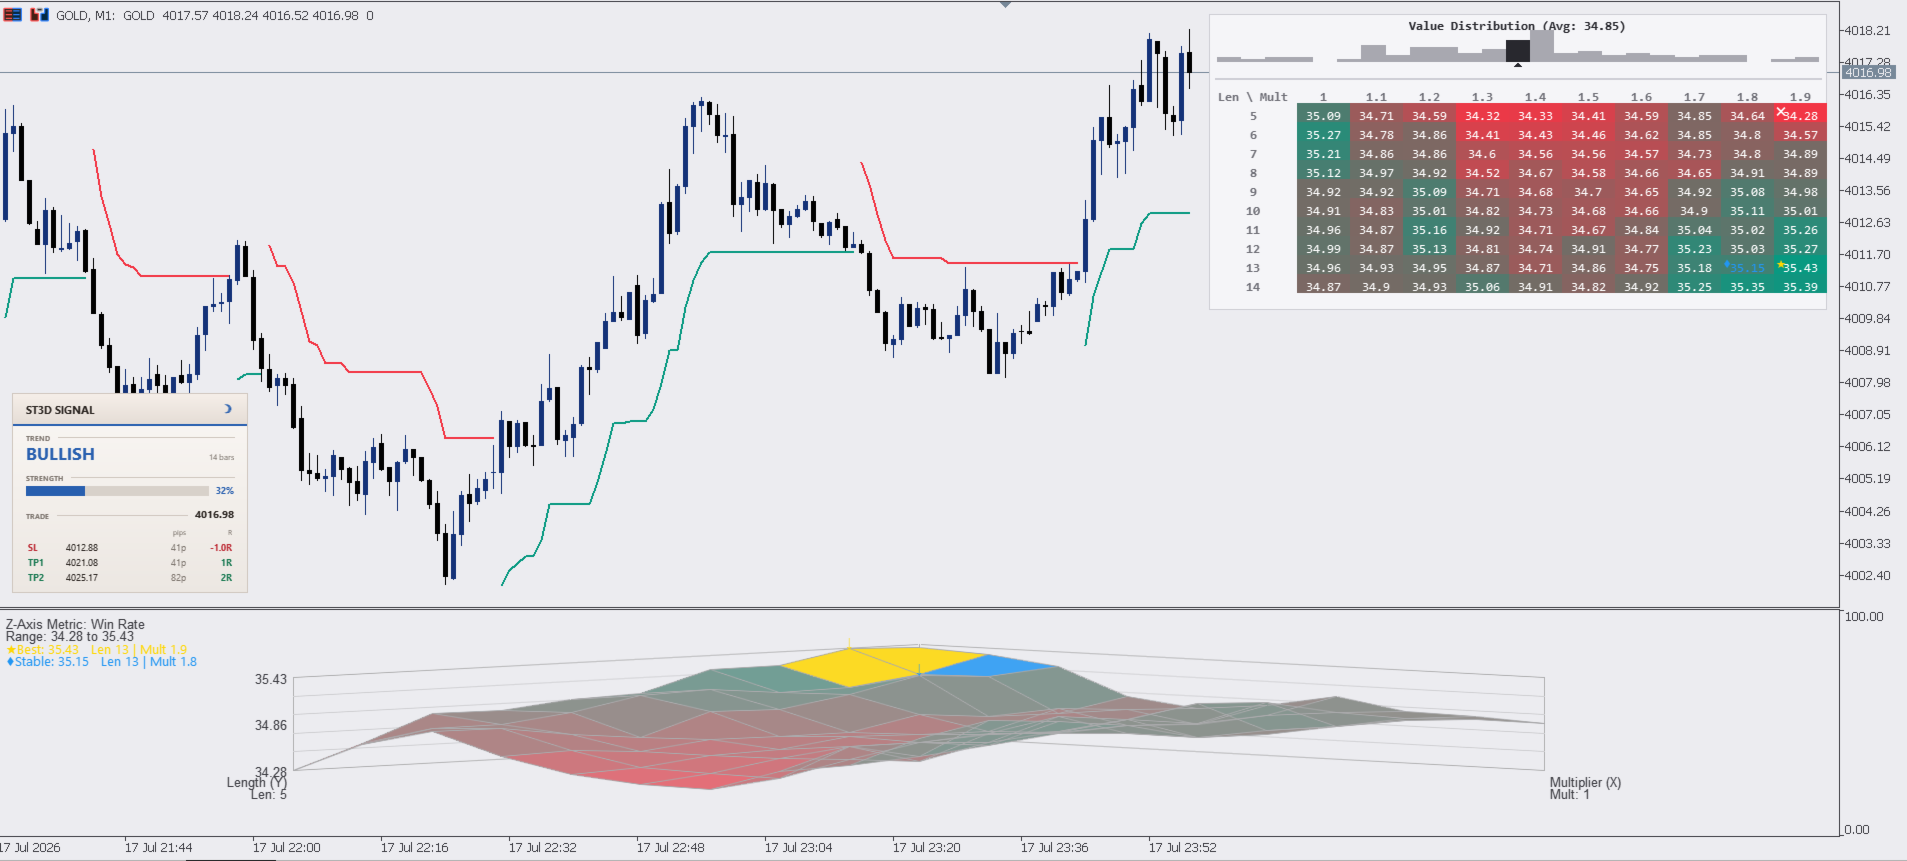
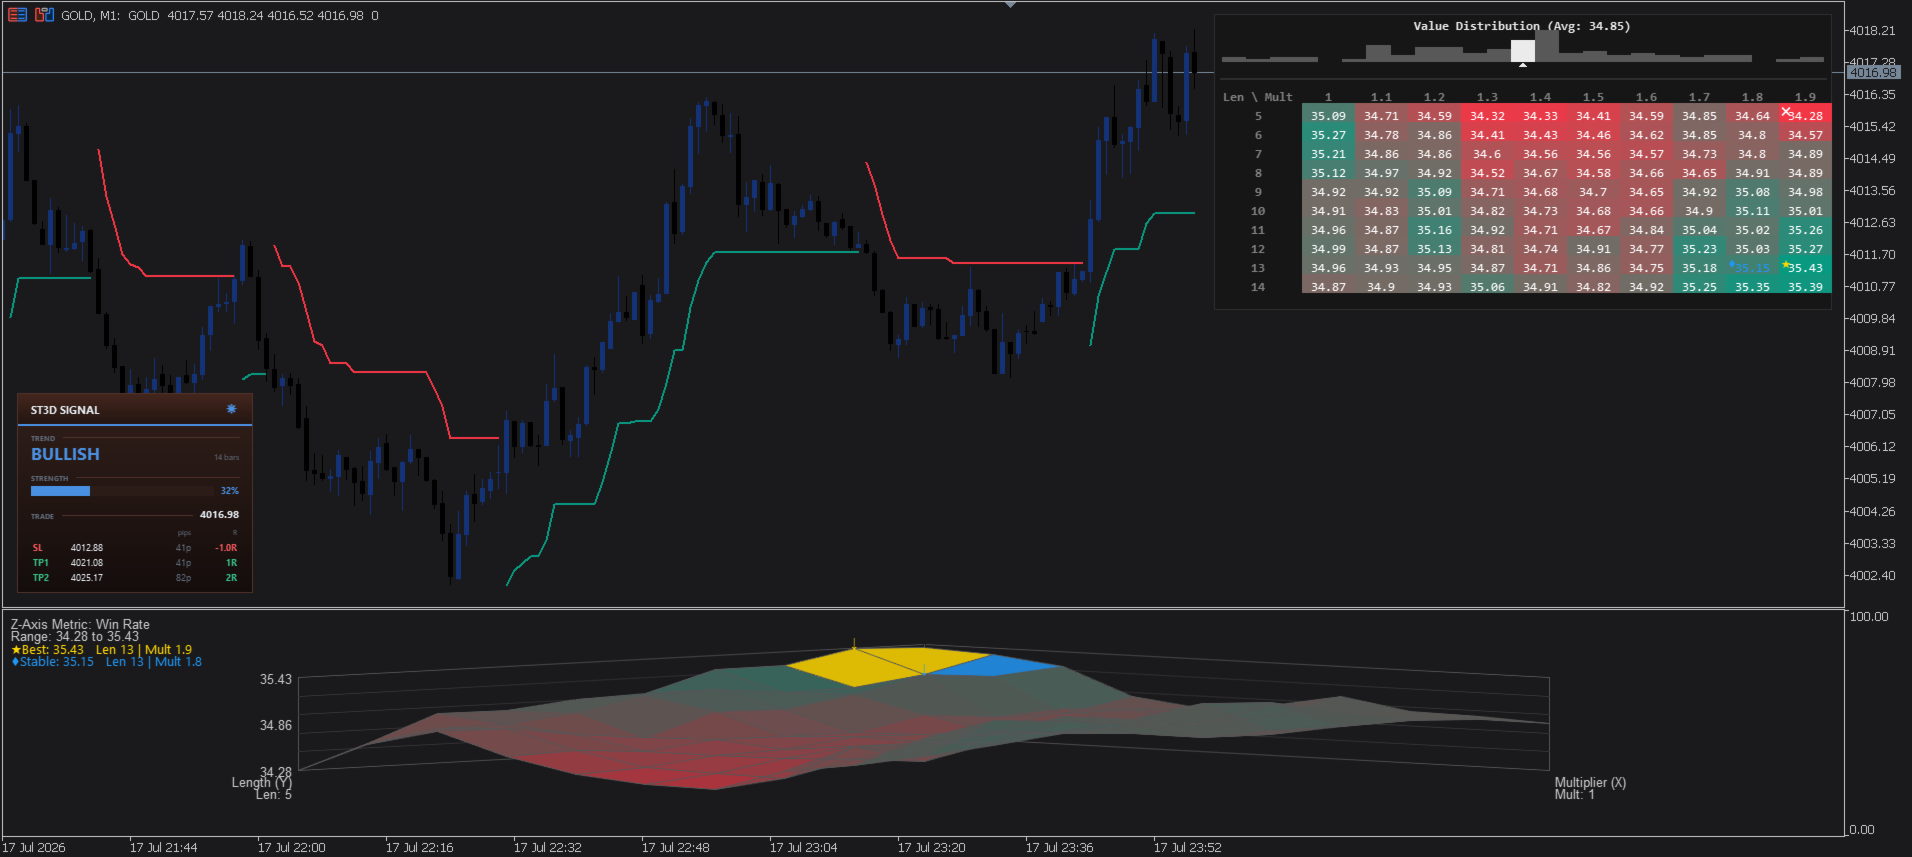
Stop guessing your ATR length and multiplier. NeuronSurface back-tests 100 Supertrend variants on every bar (10 lengths × 10 multipliers), scores each one on the metric you choose, and shows the result three ways at once — a live 3D surface, a colour-coded matrix and a distribution histogram — with the best and the most stable settings flagged automatically.
At a glance: 100 combinations per bar · 10 × 10 length/multiplier grid · 9 scoring metrics · MetaTrader 5 · indicator only (it does not trade).
One indicator, four synchronised views
Every view is driven by the same engine, so they always agree.
- 3D surface — an isometric height-map of the score across all 100 settings. Peaks are strong settings, valleys are weak ones.
- Heat-map matrix — the same 100 values as a 10×10 grid of exact numbers, coloured low to high, with the best / worst / most-stable cells marked.
- Distribution histogram — how the scores are spread and where the average sits, so you can tell a broad edge from a lucky spike.
- Signal panel — the plotted Supertrend distilled to trend, strength and a ready trade: entry, stop and two targets.
The sensitivity engine
Two ranges define the grid. The Length axis takes 10 ATR periods; the Multiplier axis takes 10 multipliers — 100 Supertrends in total. Each one runs a full closed-bar back-test on your chart history, and the metric you pick becomes its score: the surface height and the matrix colour.
| Axis | Parameter | Values | Default |
|---|---|---|---|
| Y (depth) | ATR Length | 10 steps from Length Start by Length Step | 5 to 14 |
| X (width) | Multiplier | 10 steps from Mult Start by Mult Step | 1.0 to 1.9 |
| Z / colour | Metric score | chosen statistic per combination | Win Rate |
Best vs. Stable — the important distinction
The single highest-scoring cell is often a fragile spike: nudge a parameter one step and it collapses. NeuronSurface also finds the stable region — the neighbourhood that scores well and holds up when the parameters move. That is the setting you can actually trust out-of-sample.
| Marker | Meaning | How it is chosen |
|---|---|---|
| Best (star) | Highest metric value in the grid | The single top-scoring cell of the 100 |
| Worst (cross) | Lowest metric value in the grid | The single bottom-scoring cell |
| Stable (diamond) | Most robust region | Centre of the 3×3 block with the best (average minus 1.5 × standard deviation) |
Turn on Auto Apply Stable Parameters and the plotted Supertrend follows the stable cell automatically, bar by bar, instead of a fixed length/multiplier you set by hand.
Nine ways to score a setting
Pick the statistic that matches how you trade. It re-scores all 100 combinations and redraws every view instantly.
| Metric | Definition | Reads high when |
|---|---|---|
| Win Rate | wins / trades × 100 | most signals close in profit |
| Net Profit | gross profit − gross loss | the setting is net positive overall |
| Profit Factor | gross profit / gross loss | winners far outweigh losers |
| Total Trades | count of completed signals | the setting is active / fast |
| Average Trade | net profit / trades | each signal carries more edge |
| Reward/Risk Ratio | average win / average loss | wins are bigger than losses |
| Gross Profit | sum of winning-trade returns | raw upside is large |
| Total Wins | count of winning trades | many signals land |
| Win/Loss Ratio | wins / losses | winners outnumber losers |
The signal panel
A compact panel mirrors whatever Supertrend is on the chart — your manual line, or the stable one when Auto Apply is on — and distils it into three reads. A sun/moon icon flips the whole tool between light and dark.
| Section | Shows | Meaning |
|---|---|---|
| Trend | Bullish / Bearish + bars | Direction of the plotted Supertrend and how long it has held |
| Strength | 0 to 100% | How far price has travelled from the trend's start, measured in ATR |
| Trade | Entry / SL / TP1 / TP2 | Market entry, the Supertrend stop, and two R-multiple targets |
Inputs
| Setting | Default | What it does |
|---|---|---|
| Main Indicator | ||
| Auto Apply Stable Parameters | false | Plot the most-stable combination's Supertrend instead of the manual line below. |
| ATR Length | 10 | ATR period of the manually-plotted Supertrend. |
| Multiplier | 3.0 | ATR multiplier of the manually-plotted Supertrend. |
| Sensitivity Ranges | ||
| Length Start | 5 | First ATR length on the depth axis. |
| Length Step | 1 | Increment between the 10 lengths. |
| Multiplier Start | 1.0 | First multiplier on the width axis. |
| Multiplier Step | 0.1 | Increment between the 10 multipliers. |
| Optimization | ||
| Metric | Win Rate | The statistic that scores every combination (drives surface height and matrix colour). |
| 3D Surface Style | ||
| High Value Color | green | Colour for the highest scores (peaks). |
| Low Value Color | red | Colour for the lowest scores (valleys). |
| Wireframe Color | grey | Colour of the surface mesh lines. |
| Stable Area Color | blue | Highlight colour for the stable region. |
| X Spacing / Y Spacing % / Z Height % | 2 / 2.0 / 20.0 | Surface footprint width, depth and peak height. |
| Dashboard | ||
| Enable Dashboard | true | Show the histogram and 10×10 matrix panel. |
| Position | Top Right | One of nine chart anchors. |
| Size | Small | Auto, Nano, Micro, Tiny, Small, Normal, Large or Huge. |
| Chart Theme (applied on attach) | ||
| Recolor chart on attach | true | Apply the theme to the chart; your original colours are restored on removal. |
| Background | dark grey | Chart background in dark mode. |
| Bull candle | dark blue | Up-candle body and wick. |
| Bear candle | black | Down-candle body and wick. |
| Signal Panel | ||
| Show suggested-entry panel | true | Show the trend / strength / trade panel. |
| Panel position | Bottom Left | One of nine chart anchors. |
| Start in dark mode | true | Initial theme; the sun/moon icon toggles it live. |
| TP1 distance in R | 1.0 | First target, in multiples of the entry-to-stop risk. |
| TP2 distance in R | 2.0 | Second target, in R. |
| Rendering | ||
| Supertrend history (bars) | 500 | How many recent bars the Supertrend line is drawn for. |
| Intrabar redraw throttle (ms) | 400 | Minimum interval between live redraws (performance). |
Good to know
- Closed-bar committed — historical scores are fixed once a bar closes; only the forming bar updates live. The engine recomputes from full chart history, so more data means more reliable statistics.
- Indicator, not an EA — NeuronSurface analyses and draws. It does not place, modify or close orders; the trade panel is guidance you act on yourself.
- Platform — MetaTrader 5, any symbol and timeframe. Rendered through the built-in Canvas, with no DLLs. The 3D surface sits in its own sub-window; the panels overlay the price chart.
- Light & dark — one click re-themes the chart, the surface and both panels together. Your original chart colours are saved on attach and restored when you remove the indicator.




















































L'utilisateur n'a laissé aucun commentaire sur la note