Failed Auction

Failed Auction — Professional Failed Auction Detection MT5

Version 1.05 

The Problem With Volume in CFDs

Every serious trader understands that volume is the lifeblood of market analysis. It is the one variable that reveals intention behind price movement. Yet the vast majority of CFD instruments — indices, forex pairs, commodities — operate without access to centralized exchange volume. What brokers provide is tick volume: a raw count of price changes per bar, devoid of directional context.

Most traders accept this limitation. The FA Confluence Engine does not.

Through proprietary volume decomposition algorithms, the FA Confluence Engine reconstructs directional order flow from tick volume data, extracting buy-side and sell-side pressure with remarkable fidelity. Where the market gives you noise, this engine gives you structure. Where CFDs strip away depth, this indicator rebuilds it — bar by bar, tick by tick.

What Is a Failed Auction?

Auction Market Theory — the institutional framework that governs how markets actually move — defines price as an ongoing two-sided auction between buyers and sellers. Markets move directionally to discover new prices, and when they find a boundary where one side overwhelms the other, the auction fails and price reverses.

A Failed Auction occurs when price breaches a significant structural level — penetrating beyond it to test for acceptance — only to encounter decisive rejection. The breach itself is not the signal. What matters is how the market behaves during and immediately after the breach:

  • Was there genuine commitment behind the move? Or was it a low-conviction probe driven by stop-hunting algorithms and thin liquidity?
  • Did volume confirm the breakout? Or did participation collapse the moment price crossed the threshold?
  • Did directional flow support continuation? Or did the opposing side absorb every contract and force a reversal?

When price pushes through a level on declining participation, lopsided directional flow, and rapid contraction — the auction has failed. The breakout is a trap. Institutional participants have rejected the new price, and a reversal is structurally underway.

This is not retail conjecture. This is the foundational principle behind how market profile practitioners, auction theorists, and institutional flow desks have analyzed markets for decades. The FA Confluence Engine translates this principle into a precise, algorithmically scored detection system.

What This Indicator Is — And What It Is Not

The FA Confluence Engine is not a buy/sell signal generator. It does not tell you when to enter or exit a trade. It does not draw support and resistance lines for you to blindly follow. It does not promise a win rate.

It is a confluence tool — purpose-built to identify high-probability Failed Auction events at structurally significant price levels. Its role within your trading system is to provide a layer of institutional-grade confirmation that no other retail indicator offers.

A Failed Auction detected in the middle of a range, with no structural context, carries limited weight. But a Failed Auction occurring precisely at the Value Area High of a volume profile, at the previous session's high, at a daily high/low, at a psychological round number, or at the convergence of multiple structural boundaries — that is an event of extraordinary significance.

The FA Confluence Engine is designed to surface exactly these moments. Pair it with your existing framework — volume profiles, market profile, order flow analysis, supply and demand zones — and it becomes the confirmation layer that separates high-probability setups from noise.

Architecture & Core Modules

The FA Confluence Engine is built on a multi-layered analytical architecture, each module engineered to isolate a specific dimension of market behavior:

Adaptive Volatility Normalization

All internal calculations are dynamically scaled against real-time volatility conditions. The engine does not use static thresholds. Every measurement — from proximity calculations to rejection depth analysis — adjusts to the current volatility regime, ensuring consistent performance across instruments, timeframes, and market conditions. Whether applied to a low-volatility forex pair or a high-beta index CFD, the engine's sensitivity self-calibrates.

Statistical Volume Anomaly Detection

At the core of the engine lies a proprietary statistical model that identifies anomalous volume events — institutional-grade transactions that deviate significantly from the local volume distribution. Using advanced probability scoring, the engine isolates bars where participation exceeds normal bounds by a statistically meaningful margin, flagging them as potential institutional footprints. These are not arbitrary volume spikes. They are mathematically validated outliers.

Directional Flow Decomposition

Raw tick volume is decomposed into estimated buy-side and sell-side components using a proprietary intra-bar distribution model. This process reconstructs what CFD brokers cannot provide: a synthetic order flow delta that approximates the directional intent behind each bar's volume. The engine then tracks cumulative directional flow across critical breach sequences to determine whether the market's commitment matches its movement.

Multi-Level Structural Mapping

The engine continuously tracks and updates a dynamic grid of structurally significant price levels derived from multiple temporal frameworks:

  • Session architecture — Previous and current session highs and lows
  • Daily architecture — Prior day's high and low boundaries
  • Swing structure — Algorithmically detected pivot highs and lows using multi-bar confirmation
  • Institutional volume benchmarks — Volume-weighted reference prices derived exclusively from statistically significant volume events

Each level category carries its own weighting coefficient within the scoring engine, reflecting the empirical significance of that structural type.

Proprietary Confluence Scoring Engine

Every potential Failed Auction event is evaluated through a multi-criteria scoring matrix that synthesizes:

  • Volume commitment analysis — Was the breach supported by above-average participation, or was it a vacuum move?
  • Directional flow imbalance — Did the flow during the breach align with continuation, or did the opposing side dominate?
  • Approach velocity profiling — How did volume behave as price moved toward the level? Accelerating commitment or exhaustion?
  • Wick distribution analysis — Did price action during the approach exhibit signs of absorption and rejection?
  • Contraction detection — Did volatility compress during the breach sequence, signaling loss of momentum?
  • Breach depth quantification — How far beyond the level did price penetrate before failing?
  • Institutional footprint cross-referencing — Were anomalous volume events present during the breach, and did their directional bias conflict with the breakout direction?

Each criterion contributes a weighted component to a final Confidence Score scaled from 0 to 100. Only events that meet or exceed the user-defined confidence threshold are rendered on the chart.

User Controls

Parameter Description
Engine Sensitivity (1–10) Controls the statistical threshold for volume anomaly detection. A setting of 1 applies the strictest filtering, surfacing only the most extreme institutional events. A setting of 10 casts a wider net. Default: 1.
FA Confidence Score (0–100) Sets the minimum score a Failed Auction event must achieve to be displayed. Higher values demand stronger multi-factor confirmation. Default: 95.

Two inputs. No clutter. The complexity lives inside the engine — not on your screen.
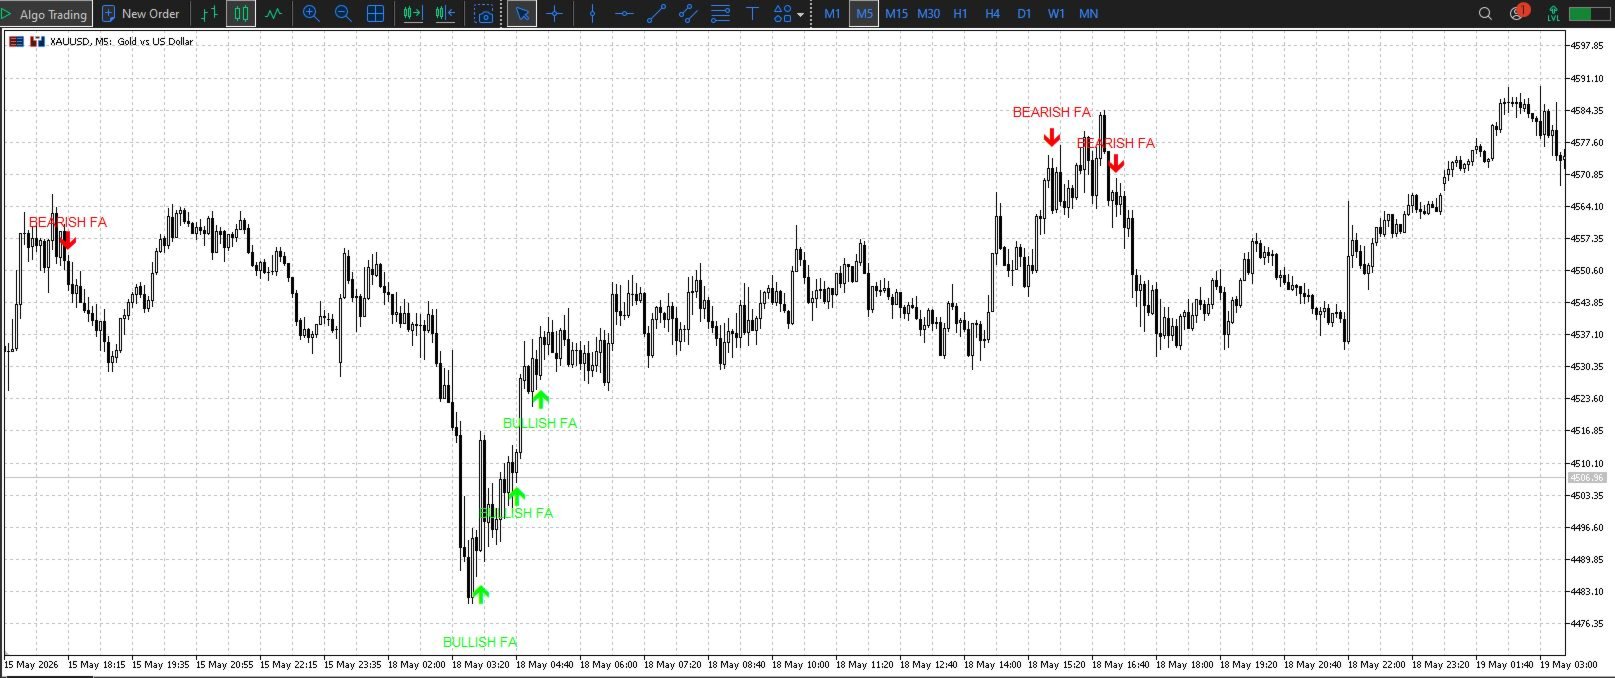
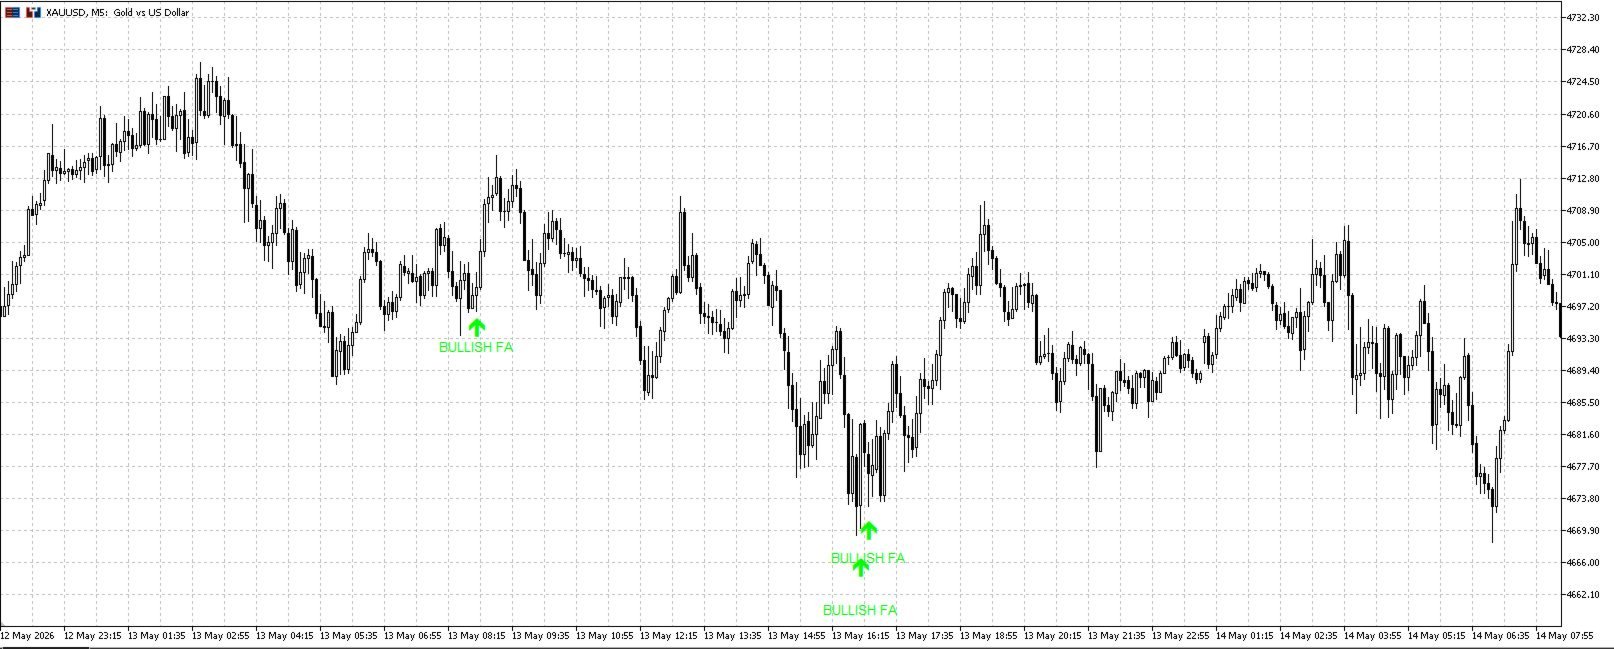
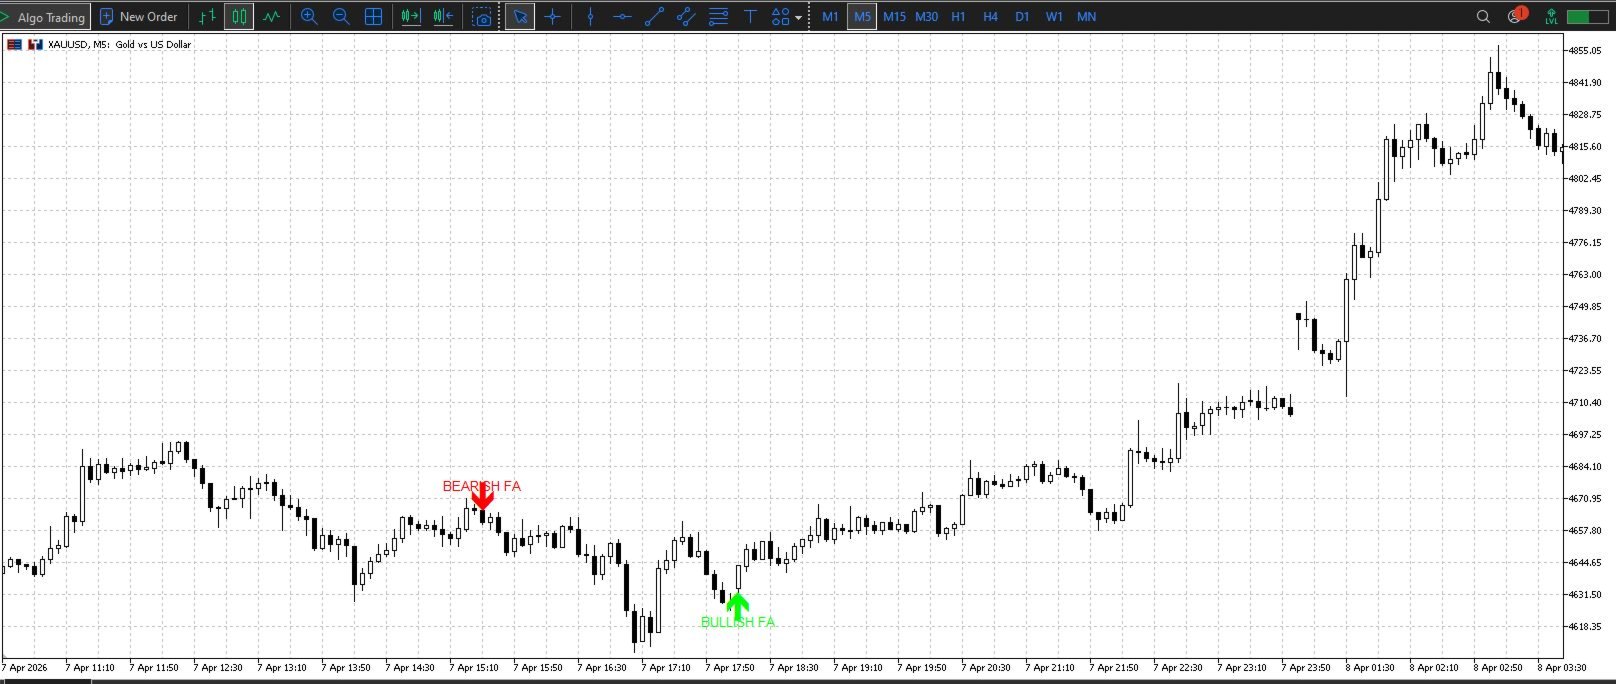
Visual Output

  • Bullish Failed Auction — Lime upward arrow with "BULLISH FA" label, rendered below the bar where the engine detected a bearish auction failure (i.e., sellers failed to sustain a breakdown — expect upward reversal).
  • Bearish Failed Auction — Red downward arrow with "BEARISH FA" label, rendered above the bar where the engine detected a bullish auction failure (i.e., buyers failed to sustain a breakout — expect downward reversal).

Clean. Unambiguous. Institutional.

Designed for CFD Markets

While most volume-based tools were conceived for centralized exchanges where true volume data is available, the FA Confluence Engine was engineered from the ground up for the realities of CFD trading. Every algorithm, every decomposition model, every statistical threshold has been calibrated to extract maximum insight from tick volume — the only volume data CFD brokers provide.

This is not a futures indicator ported to forex with a disclaimer. This is a purpose-built analytical engine for instruments that lack real volume — and it closes the gap.

How to Deploy

  1. Apply the FA Confluence Engine to any CFD chart (forex, indices, commodities, crypto CFDs).
  2. Use your existing structural analysis — volume profiles, market profile, supply/demand, psychological levels — to identify key areas of interest.
  3. When the engine fires a Failed Auction signal at or near one of those key areas, you have confluence. The market has spoken: the auction failed where it mattered most.
  4. Integrate the signal into your trade plan as a confirmation layer alongside your existing entry criteria.

The FA Confluence Engine does not replace your edge. It sharpens it.

Technical Specifications

  • Platform: MetaTrader 5
  • Chart Window: Main chart overlay
  • Buffers: 2 (Bullish FA, Bearish FA)
  • Dependencies: None — fully self-contained
  • Resource Footprint: Optimized for real-time calculation with minimal CPU overhead
  • Compatibility: All CFD instruments with tick volume data

The FA Confluence Engine represents a fundamental rethinking of how retail traders can access institutional-grade auction analysis on CFD instruments. Built on the bedrock of Auction Market Theory, powered by proprietary statistical and flow decomposition models, and distilled into a surgical confluence tool — it delivers the kind of structural insight that was once the exclusive domain of professional trading desks.

Two inputs. One engine. Zero guesswork.


Produtos recomendados
Destaques das funcionalidades do EA Gestão inteligente de ordens: suporta chave geral, cálculo dinâmico de posições máximas, controle de intervalo, etc. TP/SL flexível: suporta stop loss dinâmico, proteção contra perdas flutuantes, trailing stop e outros mecanismos de proteção de lucro. Filtragem de sinais SAR: usa sinais de tendência Parabolic SAR para pontos de entrada mais precisos. Controle avançado de risco: mecanismos integrados de saldo, razão de margem, etc., para garantir segurança. Su
Was: $249  Now: $99   Market Profile defines a number of day types that can help the trader to determine market behaviour. A key feature is the Value Area, representing the range of price action where 70% of trading took place. Understanding the Value Area can give traders valuable insight into market direction and establish the higher odds trade. It is an excellent addition to any system you may be using. Inspired by Jim Dalton’s book “Mind Over Markets”, this indicator is designed to suit the
Indicador único que implementa uma abordagem profissional e quantitativa para significar negociação de reversão. Ele capitaliza o fato de que o preço desvia e retorna à média de maneira previsível e mensurável, o que permite regras claras de entrada e saída que superam amplamente as estratégias de negociação não quantitativas. [ Installation Guide | Update Guide | Troubleshooting | FAQ | All Products ] Sinais de negociação claros Incrivelmente fácil de negociar Cores e tamanhos personalizáveis
WolfSight AI
Marius Ovidiu Sunzuiana
The WolfSight AI  is a next‑generation market analyzer built for traders who demand speed, clarity, and institutional‑grade intelligence. Powered by a multi‑layer AI decision framework, this indicator evaluates market conditions in real time and transforms them into clear BUY, SELL, or WAIT signals — all displayed through a sleek, interactive panel. This system doesn’t rely on simple crossovers or retail‑grade formulas. Instead, it uses a proprietary AI‑inspired scoring model that processes mul
O indicador SMC Venom Model BPR é uma ferramenta profissional para os traders que trabalham com o conceito Smart Money (SMC). Identifica automaticamente dois padrões principais no gráfico de preços: FVG   (Fair Value Gap) é uma combinação de três velas, em que existe um gap entre a primeira e a terceira velas. Forma uma zona entre níveis onde não há suporte de volume, o que geralmente leva a uma correção de preço. BPR   (Balanced Price Range) é uma combinação de dois padrões FVG que formam uma
O indicador cria cotações atuais, que podem ser comparadas com as históricas e, com base nisso, fazer uma previsão do movimento dos preços. O indicador possui um campo de texto para navegação rápida até a data desejada. Opções: Símbolo - seleção do símbolo que o indicador exibirá; SymbolPeriod - seleção do período do qual o indicador coletará dados; IndicatorColor - cor do indicador; HorisontalShift - deslocamento das cotações desenhadas pelo indicador pelo número especificado de barras; I
Versão MT4: https://www.mql5.com/en/market/product/166784 Versão MT5: https://www.mql5.com/en/market/product/166785 PERFIL DE LIQUIDEZ O PERFIL DE LIQUIDEZ é uma ferramenta visual de estrutura de mercado que mapeia as zonas de liquidez potenciais no gráfico utilizando um perfil dinâmico em formato de mapa de calor. Este indicador analisa a ação histórica do preço e o volume de ticks, destacando as áreas de preço onde a liquidez está provavelmente concentrada. Ele desenha: Linhas de liquidez
Ugenesys AI MT5
Odaine Ramon Mcmillan
uGenesys AI - 90% Accurate Daytrading Indicator Introducing the ultimate forex trading indicator system, uGenesys AI, powered by cutting-edge AI technology and advanced analytical techniques, including Time-Series Analysis and Genetic Algorithms. Our AI-powered trading system leverages the power of time-series analysis to identify trends and patterns in historical price data, allowing traders to make informed predictions about future market movements. By analyzing vast amounts of data, our syst
My products:   https://www.mql5.com/ru/users/astra077/seller In the product line: Candlestick Pattern Detector   — a free basic version. Candlestick Patterns Standard   — a paid single-chart version with extended patterns and filters:  https://www.mql5.com/ru/market/product/174530 Japanese Candlestick Patterns Pro MT5   — a professional single-chart version with a summary table:  https://www.mql5.com/ru/market/product/173411 Multi-Currency Candlestick Pattern Scanner   — the ultimate version: a
Introducing RSIScalperPro - the revolutionary RSI-based indicator for Metatrader 5, specifically designed for scalping in the one-minute chart. With RSIScalperPro, you'll have a powerful toolkit for precise entry and exit signals to take your trading to the next level. RSIScalperPro utilizes two different RSI indicators that provide clear signals for overbought and oversold areas. You can customize the time periods and limit values of the two RSIs according to your preferences to achieve the be
No Demand No Supply MT5
Trade The Volume Waves Single Member P.C.
No Demand No Supply   This indicator identifies   No Demand –No Supply candles to your chart and plots volume bars colored according to the signal. It can be applied to all timeframes or to a specific one only. It can also be used as regular volume indicator  with exceptional future of WEIGHTED VOLUME. Furthermore is has an alert notification, sound and email when a signals occurs. The indicator does not repaint but the alert will come on two candles back due to the definition of No Demand No Su
Max Min Delta Indicator - Market Volume Imbalance Analysis Gain Deeper Insights into Market Volume Imbalance with Delta Analysis What is the Max Min Delta Indicator? The Max Min Delta Indicator is a powerful market volume analysis tool that visually represents maximum and minimum delta values using a histogram. It helps traders identify market strength, weakness, absorption, and aggressive buying/selling activity with precision. Key Features Histogram Visualization: Displays Max Delta (Green) an
SMC Smart Flow Pro
Thitipong Nookhunthod
Short Description: SMC Smart Flow Pro is an advanced Smart Money Concept indicator that automatically detects Break of Structure (BOS), Change of Character (CHoCH), and projects precise TP/SL target levels on all timeframes — built for serious traders who trade with institutional flow. Full Description: SMC Smart Flow Pro is a premium Smart Money Concept (SMC) indicator for MetaTrader 5, engineered for traders who want to trade alongside institutional order flow. By automatically mapping m
ALIEN Dashboard
Youssef Esseghaiar
ALIEN DASHBOARD FULL EDITION – Professional ICT & Precision Trading Dashboard for MT5 ( HYBRID ENGINE ) Overview The   Alien Dashboard Full Edition   is a comprehensive, all‑in‑one technical indicator for MetaTrader 5 that merges the most powerful concepts from Inner Circle Trader (ICT) methodology with advanced precision‑entry logic, multi‑timeframe analysis, and an intuitive on‑chart dashboard. Designed for serious traders who want to visualise institutional order flow, identify high‑probabili
The "MR Volume Profile 5" indicator is a charting tool that displays trading volume at different price levels rather than time intervals. A key concept in volume profile is the point of control (POC)—the price level with the highest volume traded during the session or time range. While tools like VWAP or OBV provide volume trends, the "MR Volume Profile 5" indicator offers granular detail about where the most market activity occurs at specific price levels. This makes it a more precise tool for
Breakout Boxes with Volume Pressure This indicator automates the identification of key consolidation zones (Supply and Demand) based on Market Pivots and Volatility (ATR). Unlike standard support/resistance tools, this indicator provides a unique   Volume Pressure Analysis   inside every box, giving you insight into the battle between Buyers and Sellers before a breakout occurs. Key Features Automated Supply & Demand Zones:   Automatically detects significant Pivot Highs and Lows to draw dyna
Você utiliza o volume na sua leitura do mercado? Certamente muitos traders usam, e não se imaginam operando sem ele. O indicador Color Histogram Volume Set permite que o usuário escolha o valor que ele considera interessante para monitorar. Ao ultrapassar este você terá a confirmação visual e se quiser terá também o alerta sonoro que é dado pelo indicador. Claro que existem outras maneiras de tentar encontrar um volume elevado, como avaliar se o v olume está acima da média, se é o maior volum
Pips Architect EA
Carl Marvin Fajardo
Pips Architect EA for MT5 Pips Architect EA is a disciplined XAUUSD trading system designed for traders who want structured entries, controlled execution, and stronger protection features. This Expert Advisor is built specifically for XAUUSD and uses an internal Custom Trend Validator Bias together with pending order execution to follow market direction with more control. Instead of blindly chasing price, it waits for alignment, validates conditions, and places trades using a more calculated app
This z-score indicator shows the correct z-score of an asset, as it uses the normalized price data for calculation, which is the only correct way. Z-score is only applicable for normal distributed data, therefore not the actual price is considered, but the normalised returns, which were assumed to follow a normal distribution. Returns are mean reverting and assumed to follow a normal distribution, therefore z-score calculation of returns is more reliable than z-score on price, as price is NOT m
SPECIAL LAUNCH OFFER: $30 (1-Month Rent) Limited time offer to build our community and gather feedback! AmbM GOLD Institutional Scalper A high-precision M5 algorithm for XAUUSD (Gold) , engineered to trade exclusively at Institutional Liquidity Levels ($5/$10 psychological marks). PERFORMANCE DATA (BUY ONLY) • Win Rate: 87.09%. • Safe Growth: +$4,113 profit on $10k (13.75% Max Drawdown). • Extreme Stress Test: Successfully generated +$22,997 in a 5-year stress test (2020-2026), proving
Value Chart Candlesticks
Flavio Javier Jarabeck
4.57 (14)
The idea of a Value Chart indicator was presented in the very good book I read back in 2020 , " Dynamic Trading Indicators: Winning with Value Charts and Price Action Profile ", from the authors Mark Helweg and David Stendahl. The idea is simple and the result is pure genius: Present candlestick Price analysis in a detrended way! HOW TO READ THIS INDICATOR Look for Overbought and Oversold levels. Of course, you will need to test the settings a lot to find the "correct" one for your approach. It
FREE
The Simple Bot as the name suggests follows a very simple strategy, which guarantees the bot will work in the long run. The EA uses the below simple philosophy to guarantee profits for the user. 1. Odds of success inversely proportional to size of TP. The EA aims to capture just 250 points in GOLD(XAUUSD) when conditions are met.  2.  Avoids over-trading, takes utmost one trade per day 3. Only one trade managed at a time 4.  Robust risk management, every trade is protected with a tight SL Gue
Este indicador do painel de controle de zona de oferta e demanda com vários períodos e vários símbolos envia alertas quando o preço atinge uma zona de oferta / demanda. Também é possível usá-lo para ser alertado sobre topos / fundos duplos regulares em vez de zonas. Ele pode ser usado com todos os intervalos de tempo de M1 a MN.       No máximo 9 períodos de tempo podem ser mostrados no painel ao mesmo tempo.   É possível usar RSI, divergência (MACD, OsMA, RSI ou Awesome) e filtros de padrões de
Volume Profile for MetaTrader 5 Price movement alone does not explain where the market is actually traded . What matters is where volume is built and how these areas shift over time. This Volume Profile displays the volume distribution directly on the chart , making it clear which price levels were accepted by the market and where rejection occurred. This allows structurally relevant zones to be identified and integrated into individual decision-making processes. The tool is designed for high pe
The indicator highlights the points that a professional trader sees in ordinary indicators. VisualVol visually displays different volatility indicators on a single scale and a common align. Highlights the excess of volume indicators in color. At the same time, Tick and Real Volume, Actual range, ATR, candle size and return (open-close difference) can be displayed. Thanks to VisualVol, you will see the market periods and the right time for different trading operations. This version is intended f
FREE
BoxChart MT5
Evgeny Shevtsov
5 (7)
The market is unfair if only because 10% of participants manage 90% of funds. An ordinary trader has slim changes to stand against these "vultures". This problem can be solved. You just need to be among these 10%, learn to predict their intentions and move with them. Volume is the only preemptive factor that faultlessly works on any timeframe and symbol. First, the volume appears and is accumulated, and only then the price moves. The price moves from one volume to another. Areas of volume accumu
Cumulative Volume Delta (CVD) MA-X: Ferramenta Inteligente de Sentimento de Fluxo de Ordens Desvende a mecânica oculta do mercado com o Cumulative Volume Delta (CVD) MA-X . Enquanto os indicadores de volume padrão apenas dizem quanto foi negociado, o CVD MA-X diz QUEM está vencendo a batalha entre compradores e vendedores e QUANDO . Ao agregar a ação do preço em nível de tick e a distribuição de volume, este indicador fornece um mapa cristalino da convicção e exaustão do mercado. A Vantagem do
PipFinite Cluster Helix MT5
Karlo Wilson Vendiola
5 (2)
A combination of trend, pullback, range breakouts and statistics in one indicator Mainly functions as an Entry indicator. Works in any pair and timeframe. Suggested Combination Cluster Helix with Strength Meter Strategy: Confirm signals with ideal strength levels Watch Video: (Click Here) Features Detects range breakouts on pullback zones in the direction of the trend Analyzes statistics of maximum profits and calculates possible targets for the next signal Flexible tool, can be used in many w
Before installing the HeatMap indicator make sure you are using a broker that gives you access to the Depth of market (DOM) !! This indicator creates a heatmap on your chart allowing you to see the buy or sell limit orders easily and in real time. You have the possibility to change the setting and the colors of the HeatMap in order to adapt to all markets and all charts. Here is an example of a setting you can use with the NASDAQ100 on the AMPGlobal broker :  https://www.youtube.com/watch?v=x0Y
PROMETHEUS TECHNICAN VERSION Free | By THE SONS A gift from The Sons — no strings, no trial, no expiry. Every trader deserves access to professional-grade market intelligence. That belief is why Prometheus Technical Version exists, and why it costs nothing. Consider it our handshake to the trading community. What You're Getting This is not a simplified tool dressed up as a gift. Prometheus Technican Version is a fully built, institutional-quality technical analysis indicator running a dual-model
FREE
Os compradores deste produto também adquirem
SuperScalp Pro
Van Minh Nguyen
4.64 (25)
SuperScalp Pro – Sistema avançado de scalping com múltiplos filtros SuperScalp Pro é um indicador avançado de scalping que combina o clássico Supertrend com múltiplos filtros inteligentes de confirmação para ajudar a identificar oportunidades de trading. Funciona de forma eficiente em vários timeframes de M1 até H4, com desempenho otimizado para XAUUSD, BTCUSD e principais pares Forex. O indicador fornece sinais claros de Buy e Sell, juntamente com níveis calculados automaticamente de entrada, S
Divergence Bomber
Ihor Otkydach
4.9 (89)
Cada comprador deste indicador recebe adicionalmente, e de forma gratuita: A ferramenta exclusiva "Bomber Utility", que acompanha automaticamente cada operação, define os níveis de Stop Loss e Take Profit e fecha operações de acordo com as regras da estratégia; Arquivos de configuração (set files) para ajustar o indicador em diferentes ativos; Set files para configurar o Bomber Utility nos modos: "Risco Mínimo", "Risco Balanceado" e "Estratégia de Espera"; Um vídeo tutorial passo a passo que aju
SignalTech MT5 is an unique fully rule based trading system for EURUSD, USDCHF, USDJPY, AUDUSD, NZDUSD, EURJPY, AUDJPY, NZDJPY, CADJPY.  All the winning trades with chart setups are published on the comments page. 2026-05 3493 Pips (Until 05-21 NY Closed) 2026-04 2243 Pips 2026-03 2165 Pips 2026-02 2937 Pips 2026-01 2624 Pips 2025-12 1174 Pips It can generate signals with Buy/Sell Arrows and Pop-Up/Sound Alerts. Each signal has clear Entry and Stop Loss levels, which should be automatically flag
Entry In The Zone and SMC Multi Timeframe is a real-time 2-in-1 market analysis tool that combines market structure analysis and a No Repaint BUY / SELL signal system into a single indicator, built on Smart Money Concepts (SMC) — a widely adopted framework used by professional traders to understand market structure. This indicator helps you see the market more clearly, make decisions based on structure rather than guesswork, and focus on high-probability zones where price is more likely to react
Vamos ser honestos primeiro. Nenhum indicador sozinho vai te tornar lucrativo. Se alguém te disser o contrário, está te vendendo um sonho. Qualquer indicador que mostre setas perfeitas de compra/venda pode ser feito para parecer impecável — basta dar zoom na parte certa da história e tirar um print das operações vencedoras. Nós não fazemos isso.  SMC Intraday Formula é uma ferramenta. Ela lê a estrutura do mercado para você, identifica as zonas de maior probabilidade de preço e mostra exatament
Azimuth Pro
Ottaviano De Cicco
5 (7)
Azimuth Pro V2: Estrutura Fractal Sintética e Entradas Confirmadas para MT5 Visão geral Azimuth Pro é um indicador de estrutura swing multinível da Merkava Labs . Quatro camadas de swing aninhadas, VWAP ancorado em swings, detecção de padrões ABC, filtragem estrutural de três timeframes e entradas confirmadas em barra fechada — um gráfico, um fluxo de trabalho dos micro-swings aos macro-ciclos. Este não é um produto de sinais cegos. É um fluxo de trabalho baseado em estrutura para traders que v
Power Candles MT5
Daniel Stein
5 (8)
Power Candles V3 - Indicador de força com auto-otimização O Power Candles V3 transforma a força da moeda e do instrumento num plano de negociação prático em todos os gráficos aos quais está associado. Em vez de se limitar a colorir as velas, executa uma otimização automática em tempo real em segundo plano e apresenta-lhe os melhores valores de Stop Loss, Take Profit e limiar de sinal para o símbolo em questão. Basta um clique para o adotar na negociação em tempo real — as linhas de entrada, Stop
INDICADOR TREND CATCHER O Indicador Trend Catcher analisa os movimentos de preços do mercado, utilizando uma combinação de indicadores de análise de tendências adaptativos, proprietários e personalizados pelo autor. Identifica a verdadeira direção do mercado, filtrando o ruído de curto prazo e focando a força do momentum subjacente, a expansão da volatilidade e o comportamento da estrutura de preços. Utiliza também uma combinação de indicadores personalizados de suavização e filtragem de tendê
Se você comprar este indicador, receberá meu Gerenciador de Operações Profissional + EA  GRATUITAMENTE. Primeiramente, vale ressaltar que este Sistema de Trading é um Indicador Não Repintado, Não Redesenho e Não Atrasado, o que o torna ideal tanto para o trading manual quanto para o automatizado. Curso online, manual e download de predefinições. O "Sistema de Trading Inteligente MT5" é uma solução completa de trading projetada para traders novos e experientes. Ele combina mais de 10 indicadores
FX Trend MT5 NG
Daniel Stein
5 (6)
FX Trend NG: A Nova Geração de Inteligência de Tendência Multi-Mercado Visão Geral FX Trend NG é uma ferramenta profissional de análise de tendências e monitoramento de mercado em múltiplos períodos de tempo. Permite compreender a estrutura completa do mercado em segundos. Em vez de alternar entre vários gráficos, você visualiza instantaneamente quais ativos estão em tendência, onde o momentum está enfraquecendo e onde existe alinhamento forte entre diferentes timeframes. Oferta de Lançamento
ARIPoint
Temirlan Kdyrkhan
1 (1)
ARIPoint is a powerful trading companion designed to generate high-probability entry signals with dynamic TP/SL/DP levels based on volatility. Built-in performance tracking shows win/loss stats, PP1/PP2 hits, and success rates all updated live. Key Features: Buy/Sell signals with adaptive volatility bands Real-time TP/SL/DP levels based on ATR Built-in MA Filter with optional ATR/StdDev volatility Performance stats panel (Success, Profit/Loss, PP1/PP2) Alerts via popup, sound, push, or email Cu
Gann Made Easy   é um sistema de negociação Forex profissional e fácil de usar, baseado nos melhores princípios de negociação usando a teoria do sr. W. D. Gann. O indicador fornece sinais precisos de COMPRA e VENDA, incluindo níveis de Stop Loss e Take Profit. Você pode negociar mesmo em movimento usando notificações PUSH. Entre em contato comigo após a compra para receber instruções de negociação e ótimos indicadores extras gratuitamente! Provavelmente você já ouviu muitas vezes sobre os método
Antes de tudo, vale ressaltar que esta Ferramenta de Negociação é um Indicador Não Repintante, Não Redesenhante e Não Atrasado, o que a torna ideal para negociação profissional. Curso online, manual do utilizador e demonstração. O Indicador de Conceitos de Ação de Preço Inteligente é uma ferramenta muito poderosa tanto para traders novos quanto experientes. Ele combina mais de 20 indicadores úteis em um único, combinando ideias avançadas de negociação como Análise do Trader do Círculo Interno
Trend Screener Pro MT5
STE S.S.COMPANY
4.85 (104)
Desbloqueie o poder da negociação de tendências com o indicador Trend Screener: sua solução definitiva de negociação de tendências, alimentada por lógica difusa e sistema de múltiplas moedas! Eleve sua negociação de tendências com o Trend Screener, o revolucionário indicador de tendências alimentado por lógica difusa. É um poderoso indicador de acompanhamento de tendências que combina mais de 13 ferramentas e recursos premium e 3 estratégias de negociação, tornando-o uma escolha versátil para to
KT Alpha Hunter Arrows MT5
KEENBASE SOFTWARE SOLUTIONS
A maioria dos indicadores de setas mostra um sinal e deixa você descobrir todo o resto sozinho. O KT Alpha Hunter Arrows entrega um plano de trade completo. Cada seta de sinal aparece com um plano completo já desenhado: linha de entrada, stop loss, quatro níveis de take profit e um veredito de edge em tempo real, indicando se aquele ativo e timeframe valem a pena ser operados naquele momento. O Trade Manager EA incluído cuida da execução depois que você entra na operação, ajudando a manter a dis
Market Structure Order Block Dashboard MT5 é um indicador MT5 projetado para traders que querem ler a estrutura de mercado e as principais zonas de reação do preço diretamente no gráfico. Combina BOS, ChoCH, Order Blocks, Fair Value Gaps (FVG), Liquidez, Kill Zones, Volume Profile e um painel compacto para análise rápida. Este indicador é voltado para traders que usam estrutura de mercado, conceitos ICT e Smart Money como quadro de decisão. Pode ajudar a identificar continuações de tendência, po
Atomic Analyst MT5
Issam Kassas
3.94 (31)
Primeiramente, vale ressaltar que este Indicador de Negociação não repinta, não redesenha e não apresenta atrasos, tornando-o ideal tanto para negociação manual quanto automatizada. Manual do utilizador: configurações, entradas e estratégia. O Analista Atômico é um Indicador de Ação de Preço PA que utiliza a força e o momentum do preço para encontrar uma vantagem melhor no mercado. Equipado com filtros avançados que ajudam a remover ruídos e sinais falsos, e aumentam o potencial de negociação.
Apresentando       Quantum Breakout PRO   , o inovador Indicador MQL5 que está transformando a maneira como você negocia Breakout Zones! Desenvolvido por uma equipe de traders experientes com experiência comercial de mais de 13 anos,       Quantum Breakout PRO       foi projetado para impulsionar sua jornada comercial a novos patamares com sua estratégia de zona de fuga inovadora e dinâmica. O Quantum Breakout Indicator lhe dará setas de sinal em zonas de breakout com 5 zonas-alvo de lucro e su
FX Levels MT5
Daniel Stein
5 (14)
FX Levels: Suporte e Resistência com Precisão Excepcional para Todos os Mercados Visão Geral Rápida Procurando um meio confiável de identificar níveis de suporte e resistência em qualquer mercado—incluindo pares de moedas, índices, ações ou commodities? FX Levels combina o método “Lighthouse” tradicional com uma abordagem dinâmica de vanguarda, fornecendo uma precisão quase universal. Baseado em nossa experiência real com corretores e em atualizações automáticas diárias mais as de tempo real,
FX Power MT5 NG
Daniel Stein
5 (32)
FX Power: Analise a Força das Moedas para Decisões de Negociação Mais Inteligentes Visão Geral FX Power é a sua ferramenta essencial para compreender a força real das principais moedas e do ouro em quaisquer condições de mercado. Identificando moedas fortes para comprar e fracas para vender, FX Power simplifica as decisões de negociação e revela oportunidades de alta probabilidade. Quer você prefira seguir tendências ou antecipar reversões usando valores extremos de Delta, esta ferramenta adap
OrderFlux | Orderflow de Footprint para MetaTrader 5 Versão 2.0 – Visualização Bid/Ask em tempo real para Traders Ativos O OrderFlux é um indicador de footprint e orderflow para MT5. Ele não mostra apenas para onde o preço se moveu, mas o que acontece dentro do movimento: volume de Bid/Ask por nível de preço, delta, imbalance e distribuição de volume. Muitos gráficos mostram apenas o resultado final de uma vela. O OrderFlux mostra o caminho para chegar lá. É exatamente isso que ajuda quando você
Btmm state engine pro
Garry James Goodchild
5 (4)
BTMM State Engine Pro is a MetaTrader 5 indicator for traders who use the Beat The Market Maker approach: Asian session context, kill zone timing, level progression, peak formation detection, and a multi-pair scanner from a single chart. It combines cycle state logic with a built-in scanner dashboard so you do not need the same tool on many charts at once. What it does Draws the Asian session range; session times can follow broker server offset or be set in inputs. Tracks level progression (L
Quantum TrendPulse
Bogdan Ion Puscasu
5 (25)
Apresentando   Quantum TrendPulse   , a ferramenta de negociação definitiva que combina o poder do   SuperTrend   ,   RSI   e   Stochastic   em um indicador abrangente para maximizar seu potencial de negociação. Projetado para traders que buscam precisão e eficiência, este indicador ajuda você a identificar tendências de mercado, mudanças de momentum e pontos de entrada e saída ideais com confiança. Principais características: Integração SuperTrend:   siga facilmente a tendência predominante do
RelicusRoad Pro MT5
Relicus LLC
4.96 (24)
RelicusRoad Pro: Sistema Operacional Quantitativo de Mercado 70% DE DESCONTO ACESSO VITALÍCIO (TEMPO LIMITADO) - JUNTE-SE A 2.000+ TRADERS Por que a maioria dos traders falha mesmo com indicadores "perfeitos"? Porque eles operam Conceitos Únicos no vácuo. Um sinal sem contexto é uma aposta. Você precisa de CONFLUÊNCIA . RelicusRoad Pro não é um simples indicador de seta. É um Ecossistema Quantitativo de Mercado completo. Ele mapeia a "Estrada do Valor Justo", distinguindo ruído de rupturas estru
Trend Forecaster
Alexey Minkov
5 (7)
Trend Forecaster – Since 2023. The Trend Forecaster indicator utilizes a unique proprietary algorithm to determine entry points for a breakout trading strategy. The indicator identifies price clusters, analyzes price movement near levels, and provides a signal when the price breaks through a level. The Trend Forecaster indicator is suitable for all financial assets, including currencies (Forex), metals, stocks, indices, and cryptocurrencies. You can also adjust the indicator to work on any time
Reversal Master for MT5 Reversal Master for MT5 is a non‑repainting reversal indicator for MetaTrader 5. It helps you detect potential market reversal points and shows the maximum favourable price movement after each historical signal, so you can better understand how price behaved after similar situations in the past. The MT5 version keeps the familiar reversal‑signal logic of the original Reversal Master for MT4, but adds improved visualisation, historical statistics and a points summary panel
Meridian Pro
Ottaviano De Cicco
5 (2)
Meridian Pro 2.00: Matriz profissional de tendência multi-timeframe para MT5 Meridian Pro 2.00 é uma matriz de tendência adaptativa profissional para MetaTrader 5. Combina o motor original de tendência Meridian, um ribbon limpo no gráfico, setas de sinal em barra fechada, um dashboard de 8 timeframes, Fuel momentum, consenso ponderado, processamento HTF sintético e linhas de contexto de timeframe superior diretamente no gráfico. O objetivo é simples: ler tendência atual, estrutura multi-timefram
Este painel mostra os últimos   padrões harmónicos   disponíveis para os símbolos seleccionados, pelo que poupará tempo e será mais eficiente /   versão MT4 . Indicador gratuito:   Basic Harmonic Pattern Colunas do indicador Symbol :   aparecem os símbolos seleccionados Trend :   de alta ou de baixa Pattern :   tipo de padrão (gartley, borboleta, morcego, caranguejo, tubarão, cifra ou ABCD) Entry :   preço de entrada SL:   preço de paragem de perda TP1:   preço do 1º take profit TP2:   preço
Smart Structure Concepts MT5
Cristhian Alexander Gaibor Cuasquer
Smart Structure Concepts MT5 é o toolkit SMC institucional mais completo para MetaTrader 5 — com tooltips educativos em 4 idiomas e alertas push em tempo real no instante em que o preço entra numa zona. A maioria dos indicadores SMC desenha caixas e deixa você adivinhando. Este explica cada sinal diretamente no gráfico. Passe o cursor sobre qualquer BOS, CHoCH, Order Block, FVG ou nível de liquidez e veja o que significa e o que fazer a seguir — em inglês, espanhol, português ou francês. O QUE
Market Structure Patterns
Samuel Manoel De Souza
4.47 (19)
Market Structure Patterns   é um indicador baseado em   smart money concepts   que apresenta elementos de   SMC/ICT   capazes de elevar suas decisões de negociação a um novo patamar. Aproveite os   alertas ,   notificações   push   e   mensagens  por  e-mail   para ser informado sobre quando um elemento se forma no gráfico, o preço cruza um nível e/ou entra em uma região delimitada por uma retângulo. Desenvolvedores podem acessar valores dos elementos do indicador por meio de   variáveis globai
Mais do autor
Garch
Giorgi Abuladze
GARCH(1,1) Volatility Estimator This indicator provides a computational implementation of the Generalized Autoregressive Conditional Heteroskedasticity (GARCH) model of order (1,1). It is designed to estimate the current volatility of a financial asset by factoring in both past shocks and previous variance estimates. Unlike standard moving averages, this model accounts for "volatility clustering"—the phenomenon where large price changes tend to be followed by further large changes. It's basicall
FREE
Volume Proxy
Giorgi Abuladze
Volume Proxy: The Ultimate Order Flow Synthesizer for CFDs Built Exclusively for Synthetic and CFD Markets (XAUUSD, NAS100, US30). If you are trading decentralized assets on MetaTrader 5, you are trading blind. Unlike centralized futures markets, CFDs do not have real volume data. Standard retail volume on these assets is fundamentally broken—it tells you how many ticks occurred, but it completely blinds you to the actual intent, aggression, and institutional weight behind the moves. The MT5 Ord
Big Trades
Giorgi Abuladze
Big Trades — Institutional Order Flow Indicator for MetaTrader 5 Built for CFD traders who are tired of trading blind. MetaTrader 5 is a phenomenal platform — except for one glaring weakness: it has   no real order flow . No consolidated tape, no aggregated volume profile across venues, no native way to see when the   big money   is actually stepping in. For CFD traders, this gap is even more painful: your broker feed is fragmented, volume is synthetic, and the footprint of institutional activit
DSP Trend
Giorgi Abuladze
DSP State-Space Trend Engine You don't need another signal. You need clarity.  *READ THE DESCRIPTION, THIS IS NOT A BUY/SELL INDICATOR* Most tools on the market will hand you an arrow and a prayer. We don't do that. We don't promise you wins. We don't sell dreams. We built a machine — and we're handing you the keys. The DSP State-Space Trend Engine   is an institutional-grade confluence and trend regime system engineered from the ground up using proprietary digital signal processing architecture
Filtro:
Sem comentários
Responder ao comentário