MACD intel
- Indicadores
- Versão: 3.5
- Ativações: 5

MACD intel
Professional MACD Oscillator with Adaptive Noise Filtering and Divergence Detection
The Problem MACD intel Solves
| Trader Question | How MACD intel Answers |
|---|---|
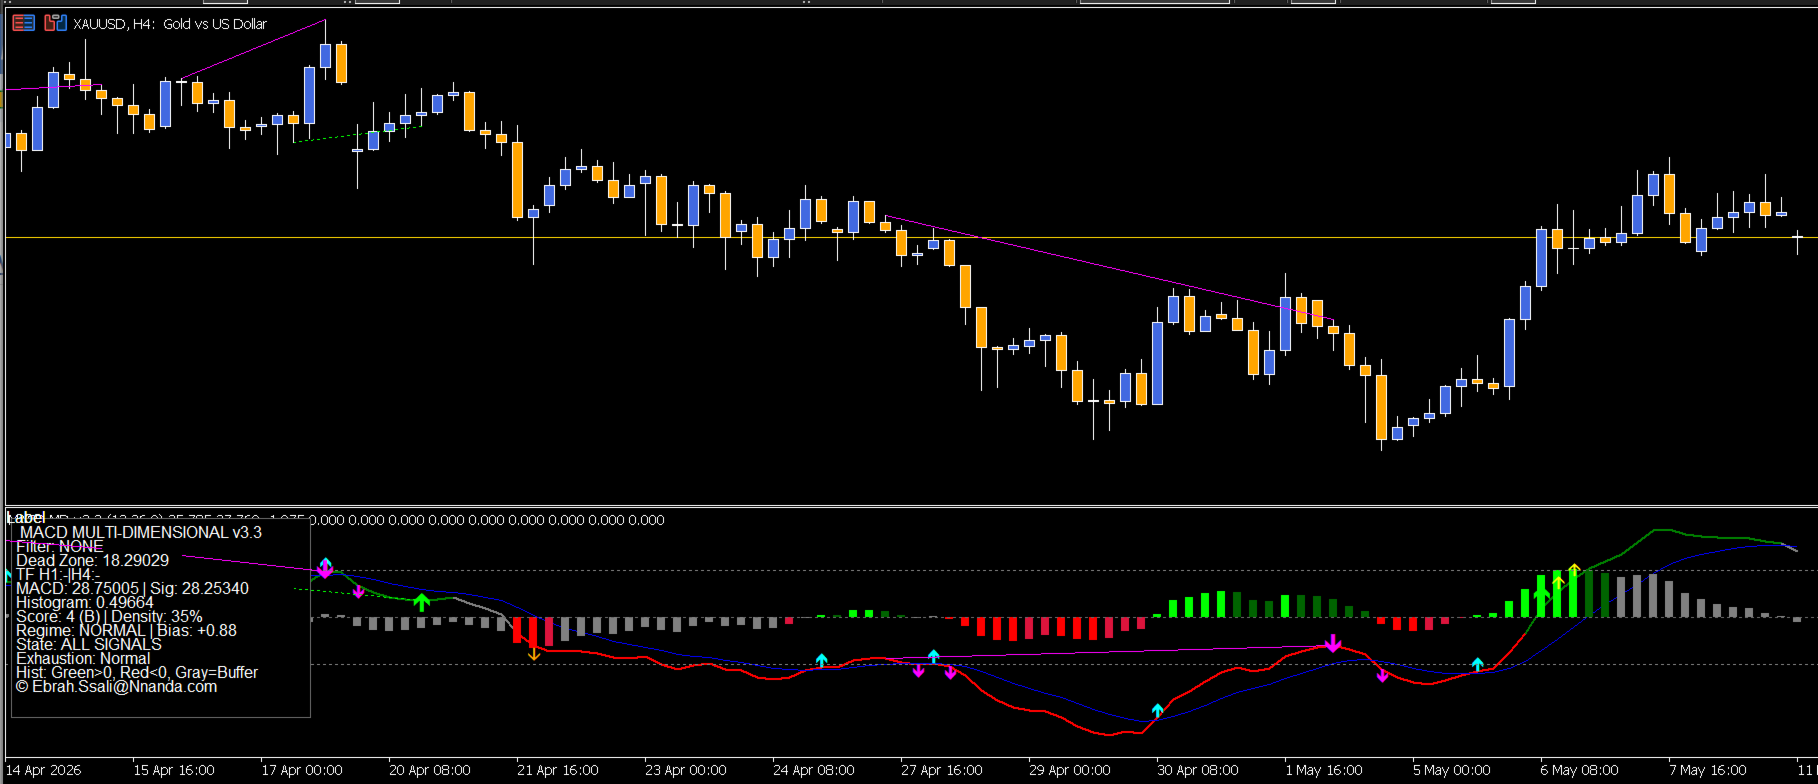
| "Is this crossover real or just market noise?" | Adaptive Dead Zone filters out false signals. Grey histogram = noise zone. Only decisive moves generate arrows. |
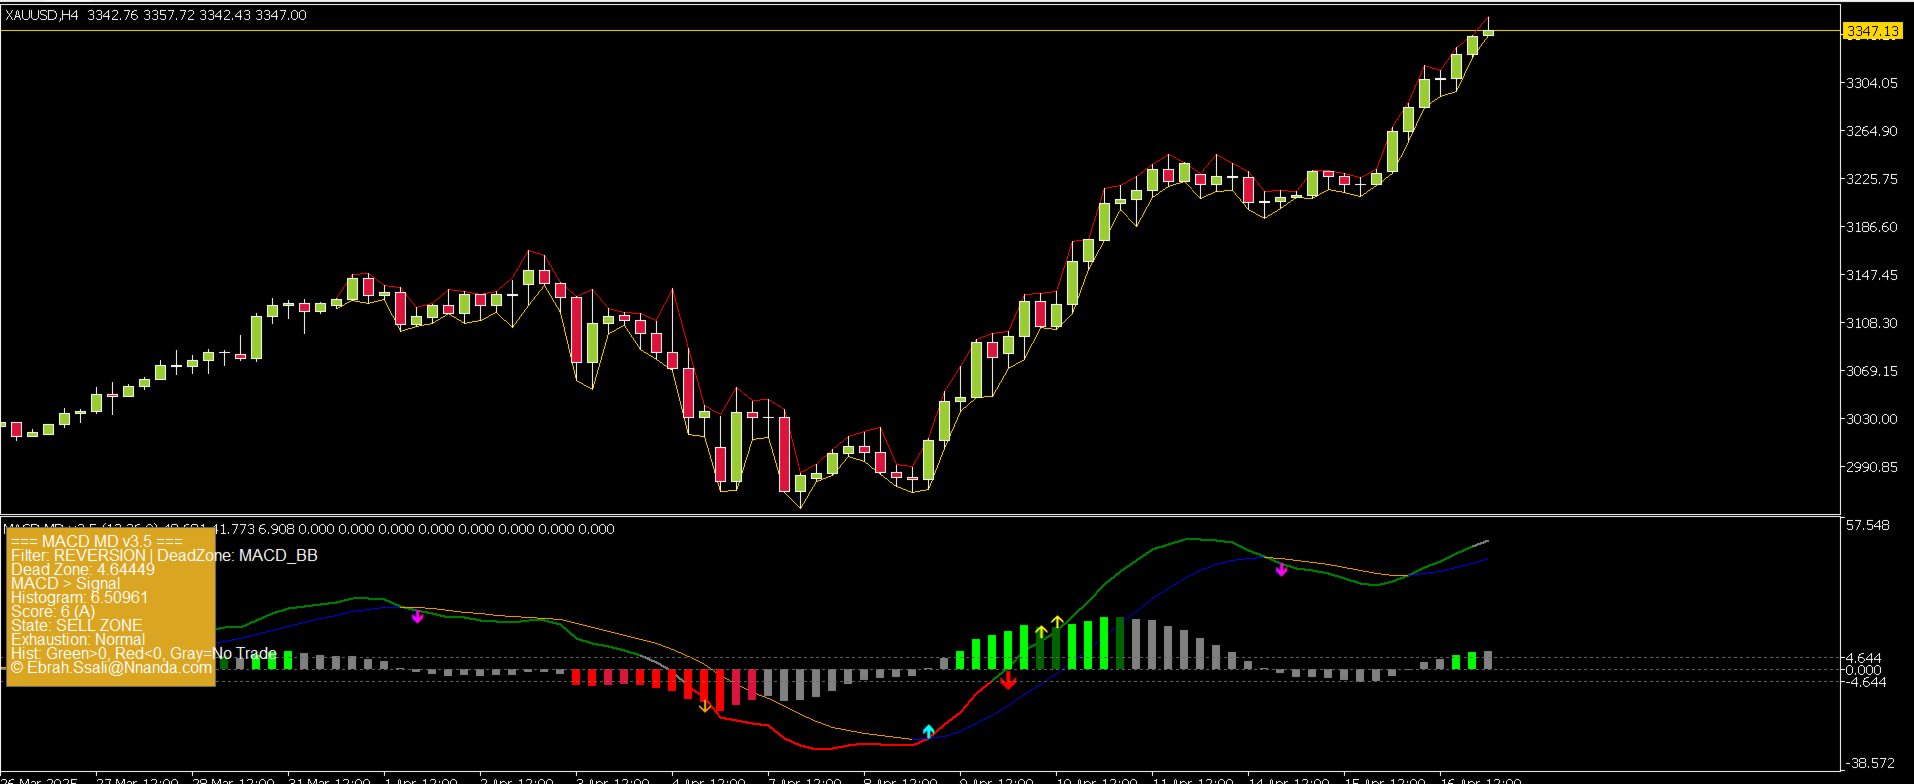
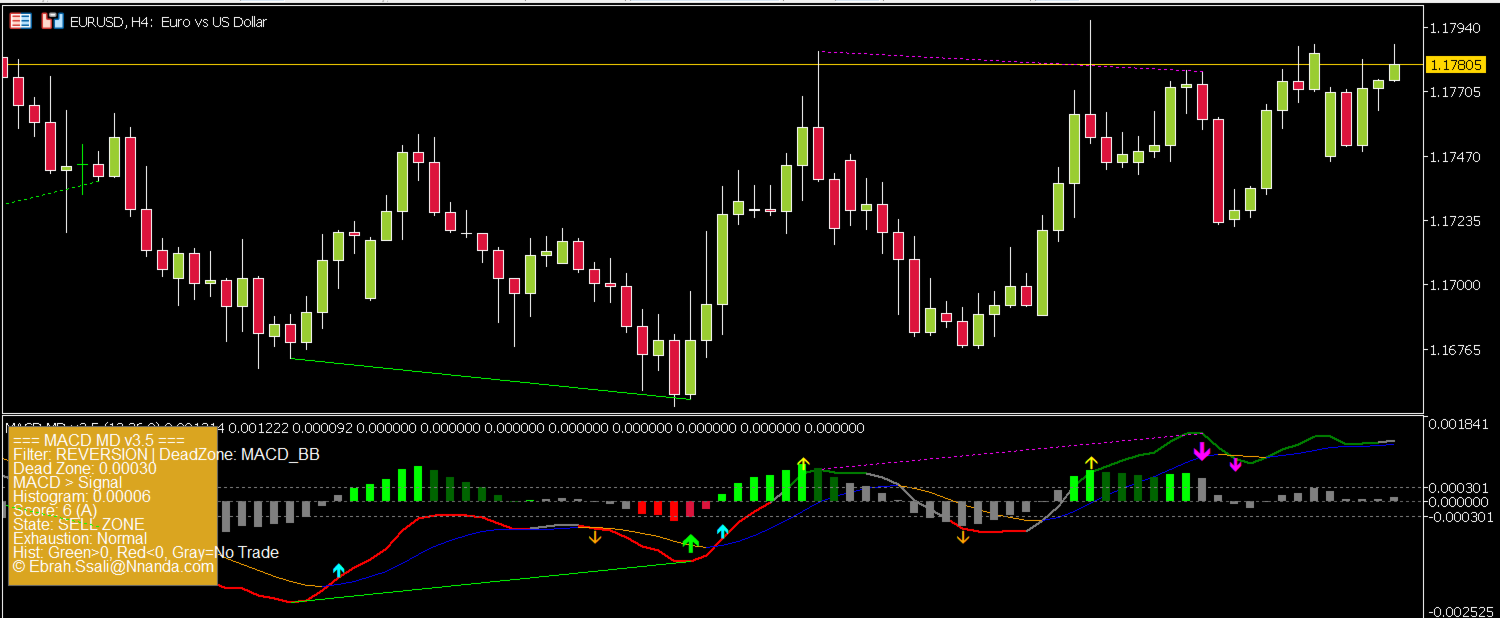
| "Should I follow the trend or fade the move?" | 3-Mode Zero-Line Filter lets you switch between TREND (follow momentum) and REVERSION (fade extremes) with one click. |
| "Why did MACD give a signal but price reversed?" | Divergence Detection catches these reversals early. Solid lines = classical reversal, dotted = trend continuation. |
| "How reliable is this signal?" | Signal Scoring (A+ to C) grades every setup mathematically. Only trade when dashboard turns GOLDENROD (A/A+ grade). |
| "Is the market trending or chopping?" | Exhaustion Alert shows signal density. >20% = choppy market. Reduce size or switch to REVERSION mode. |
| "Where is momentum accelerating vs dying?" | 5-State Histogram shows acceleration (bright colours) vs deceleration (dark colours) at a glance. |
| "When does momentum actually confirm?" | Acceleration Arrows fire when MACD breaks decisively OUT of the dead zone, validating the move. |
| "Can my EA trade these signals?" | 8 EA-Ready Buffers expose every arrow type for automated trading. |
Key Features
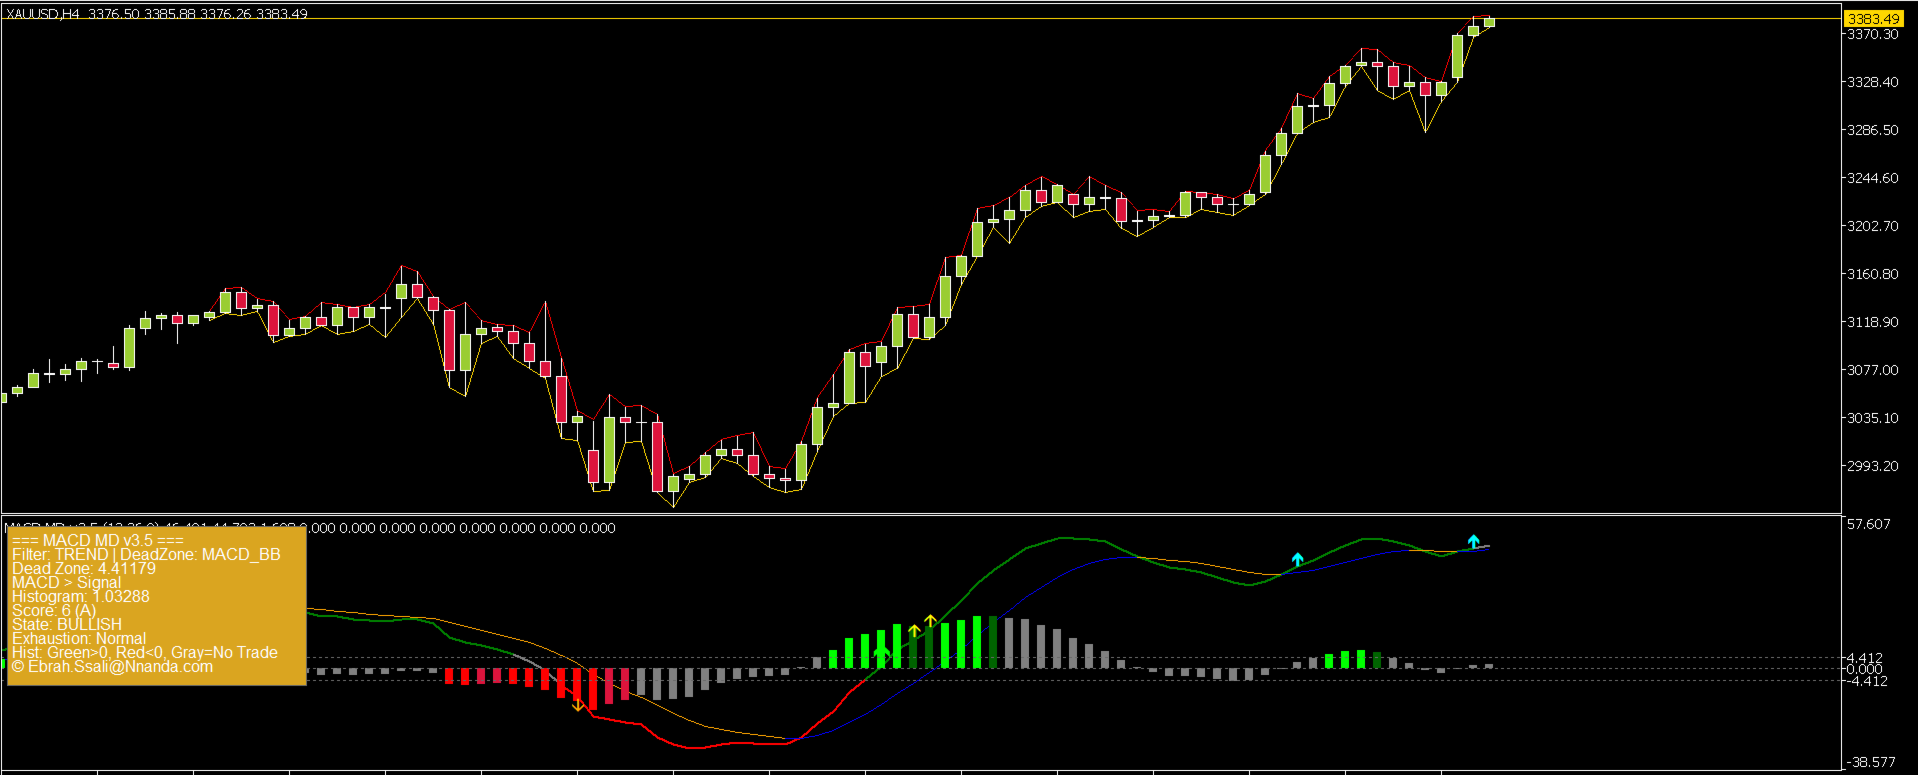
1. Zero-Line Filter (3 Strategic Modes)
| Mode | Logic | Best For |
|---|---|---|
| NONE | Classic mode; all crossovers generate signals | Scalping, all signals |
| TREND | Buy only above zero, Sell only below zero | Trending markets |
| REVERSION | Buy below zero (fading extremes), Sell above zero | Ranging/choppy markets |
2. Adaptive Dead Zone
Filters out market noise around the zero line. The histogram turns Grey to indicate a "No Trade Zone."
-
MACD_BB Mode (Recommended): Uses Bollinger Bands on the MACD itself to automatically adjust to current market volatility
-
MANUAL Mode: Fixed value (e.g., 0.005 for EURUSD, 0.05 for Gold)
-
Set StdDev = 0 to disable dead zone completely
3. 5-State Histogram Colouring
| Colour | Meaning |
|---|---|
| Bright Green | Above zero + accelerating (strong bullish momentum) |
| Dark Green | Above zero + decelerating (weak bullish momentum) |
| Bright Red | Below zero + accelerating (strong bearish momentum) |
| Dark Red | Below zero + decelerating (weak bearish momentum) |
| Grey | Inside dead zone OR current forming candle (wait) |
4. Professional Divergence Detection
Automatically finds Classical and Reverse divergences between price and MACD.
| Divergence Type | Trend Line Style | Meaning |
|---|---|---|
| Classical | Solid line | Potential reversal |
| Reverse | Dotted line | Trend continuation signal |
Visual Feedback:
-
Lime arrows + Green lines = Bullish divergence
-
Magenta arrows + Magenta lines = Bearish divergence
-
Lines drawn on BOTH price chart and indicator window
5. Signal Grade and Scoring (A+ to C)
Every signal is graded based on three weighted factors:
-
Dead zone distance
-
Histogram acceleration
-
Signal line alignment
| Grade | Score | Interpretation |
|---|---|---|
| A+ | 7-10 | High-conviction setup - Strong signal |
| A | 5-6 | Actionable trade - Good probability |
| B | 3-4 | Weak signal - Consider context |
| C | 0-2 | Avoid - Wait for better setup |
6. Real-Time Dashboard (HUD)
Clean overlay showing:
-
Filter mode and Dead zone type
-
Current dead zone value
-
MACD vs Signal line relationship
-
Histogram value
-
Score and Grade (Goldenrod background for A/A+)
-
State (BULLISH/BEARISH/NEUTRAL based on filter mode)
-
Exhaustion Alert (>20% signal density = potential chop)
7. Multiple Signal Arrows (EA Ready)
| Arrow | Buffer | Signal Type | What It Tells You |
|---|---|---|---|
| Lime | Buffer 6 | Zero Cross BUY | MACD broke OUT of dead zone to the upside |
| Red | Buffer 7 | Zero Cross SELL | MACD broke OUT of dead zone to the downside |
| Cyan | Buffer 8 | Signal Cross BUY | MACD crossed ABOVE Signal line (early bullish) |
| Magenta | Buffer 9 | Signal Cross SELL | MACD crossed BELOW Signal line (early bearish) |
| Yellow | Buffer 10 | Bullish Dead Zone Exit (Acceleration) | MACD surged UP out of dead zone - momentum confirmed |
| Orange | Buffer 11 | Bearish Dead Zone Exit (Acceleration) | MACD plunged DOWN out of dead zone - momentum confirmed |
| Lime | Buffer 12 | Bullish Divergence | Price lower but MACD higher - reversal UP pending |
| Magenta | Buffer 13 | Bearish Divergence | Price higher but MACD lower - reversal DOWN pending |
Why Acceleration Arrows Matter: These arrows confirm that MACD has decisively broken OUT of the dead zone with momentum. They validate that a zero-line cross is genuine and not a false breakout.
How to Trade with MACD intel
Step 1: Match the Market Regime
| Market Condition | Filter Mode | What to Look For |
|---|---|---|
| Trending (strong up/down) | TREND | Zero cross arrows in direction of trend |
| Ranging (sideways/choppy) | REVERSION | Zero cross arrows OPPOSITE the extreme |
| Scalping (any condition) | NONE | All crossovers trigger arrows |
Step 2: Set the Dead Zone
-
RECOMMENDED: Dead Zone Mode = MACD_BB (automatically adapts to volatility of different instruments)
-
Manual alternative: Use 0.005 for EURUSD, 0.05 for Gold, adjust for other symbols
-
To disable: Set BB StdDev = 0
Step 3: Wait for Grade A
Only consider trades when the dashboard turns Goldenrod, signalling an A or A+ grade trade based on mathematical confluence.
Step 4: Watch the Exhaustion Alert
If Exhaustion shows "ALERT" (signal density >20%), the market may be choppy. This warns you to:
-
Reduce position size
-
Wait for clearer signals
-
Consider using REVERSION mode
Step 5: Look for Divergence Confluence
Highest probability setups occur when:
-
Divergence arrow + Zero cross arrow + Grade A/A+
-
Solid lines (classical divergence) are stronger than dotted (reverse)
Step 6: Use Acceleration Arrows for Confirmation
When you see Yellow (BUY) or Orange (SELL) arrows (Buffer 10-11):
-
MACD has decisively broken out of the dead zone
-
Confirms the zero-line cross is genuine (not a false breakout)
-
Use as additional confirmation alongside zero cross arrows
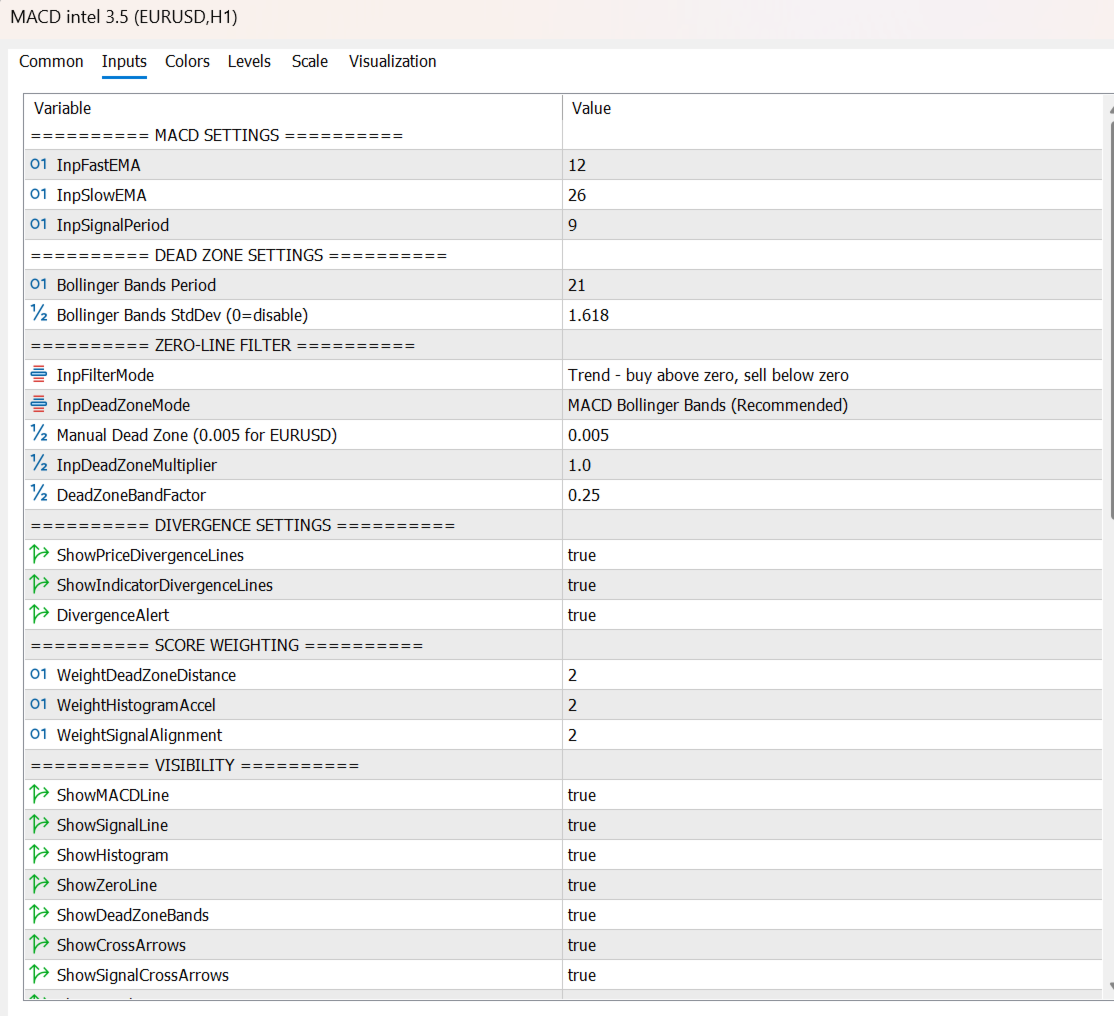
Input Parameters Quick Guide
| Parameter | Description | Recommended |
|---|---|---|
| Fast/Slow/Period | Standard MACD periods | 12, 26, 9 |
| BB Period | Bollinger Bands period | 21 |
| BB StdDev | Standard deviation (0 = disable dead zone) | 1.618 (Golden Ratio) |
| Filter Mode | TREND, REVERSION, or NONE | TREND |
| Dead Zone Mode | MACD_BB or MANUAL | MACD_BB |
| Manual Dead Zone | Fixed dead zone value | 0.005 (EURUSD) |
| Divergence Settings | Show lines, alerts | Enabled |
| Score Weighting | Adjust factor importance | Defaults |
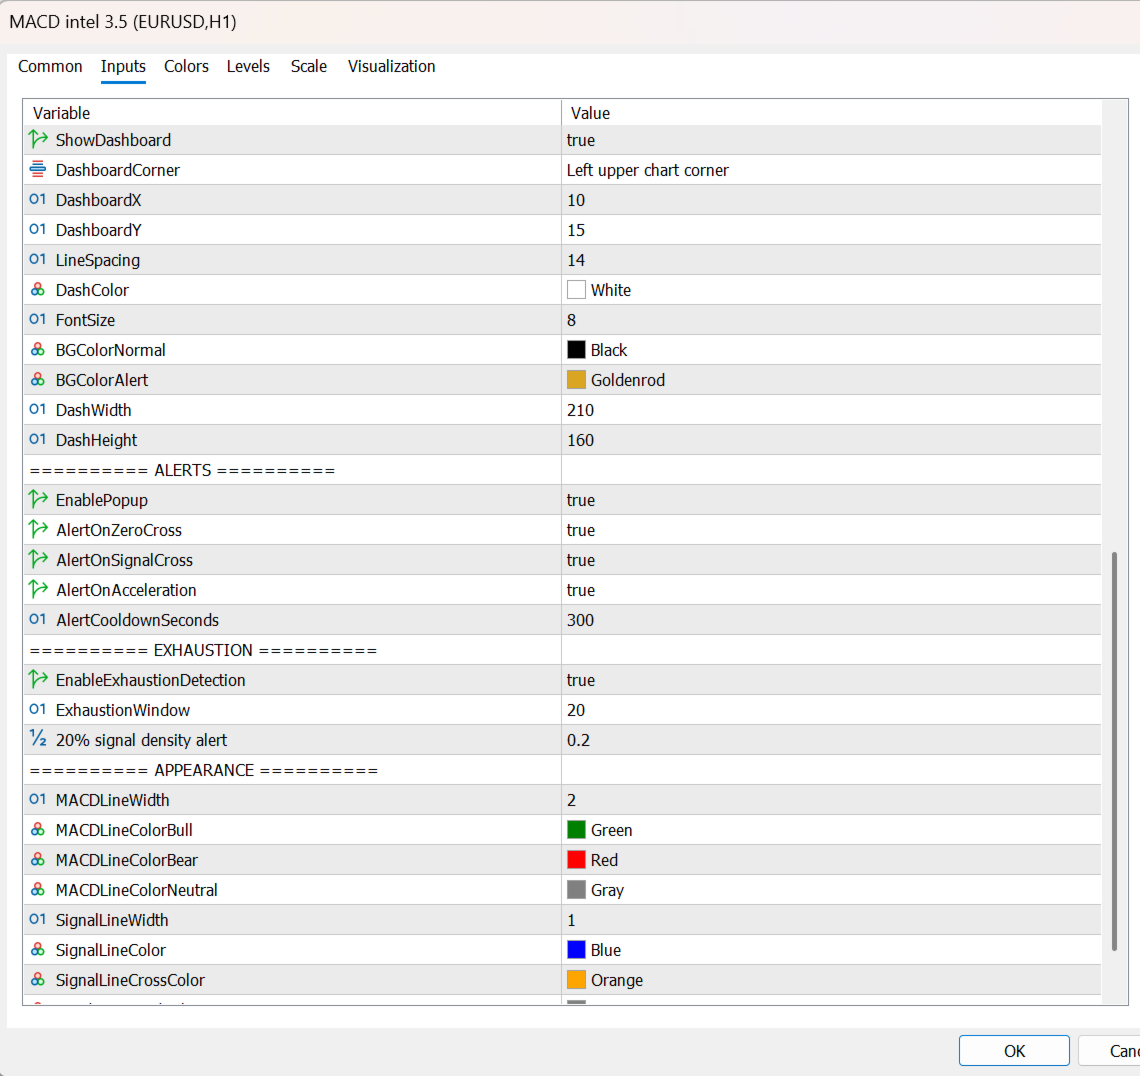
| Dashboard | Show/Hide, position, colours | Left corner |
| Alerts | Popup, cooldown | Enabled, 300 sec |
Pro Tips for Best Results
-
Respect the 'Grey area': If the histogram is grey, the market is in a "Dead Zone." Do not force trades.
-
Divergence + Grade A = High Probability: A Grade A signal combined with a Classical Divergence (solid line) is a high-probability "A+" setup.
-
Multiple Arrows = Stronger Signal: Higher probability when multiple arrows align (Zero cross + Signal cross + Divergence).
-
Acceleration Arrows = Confirmation: Yellow/Orange arrows validate that a zero-line cross is genuine, not a false breakout.
-
Current Candle Always Grey: The forming candle is always grey - wait for close before taking signals (no repainting).
-
Manual Dead Zone Adjustment: For very quiet instruments, use smaller manual dead zone (0.001-0.005). For volatile instruments, increase BB StdDev (2.0-2.5).
Technical Specifications
| Specification | Details |
|---|---|
| Asset Classes | Forex, Stocks, Crypto, Indices |
| Timeframes | All (optimized for M15, H1, H4) |
| EA Ready | 8 signal buffers for automated trading |
| Non-Repainting | All signals on confirmed closed bars |
| Divergence Lines | Price chart + indicator window |
| Alert Channels | Popup, Push notifications, Email |
| CPU Efficient | Smart calculation, only updates on new bars |
The Questions MACD intel Answers (Summary)
| You Ask | MACD intel Shows |
|---|---|
| Is this signal real or noise? | Grey histogram = noise. Coloured bars = real momentum. |
| Should I buy or sell? | Lime = BUY, Red = SELL, Cyan/Magenta = early signals. |
| How strong is this signal? | Score: A+ (strongest) to C (avoid). |
| Is momentum building or dying? | Bright colours = accelerating. Dark colours = decelerating. |
| Is the market trending or chopping? | Exhaustion Alert: >20% = chop. |
| Is a reversal coming? | Divergence lines + arrows. Solid lines = strong reversal. |
| Is the breakout genuine? | Yellow/Orange acceleration arrows confirm the move. |
| Can my EA trade this? | Yes - 8 dedicated buffers for every signal type. |
© Copyright 2026, Ebrah | ebrah.ssali@Nnanda.com | v3.5