Reality Engine Pro V2
- Utilitários
-
Leon Mackintosh
 I have been actively trading foreign exchange and market indices since 2017, with a focus on structured, data-driven approaches to analysis and execution.
 - Versão: 2.0
- Ativações: 10
Reality Engine Pro
| Advanced Execution Quality Monitor for MetaTrader 5
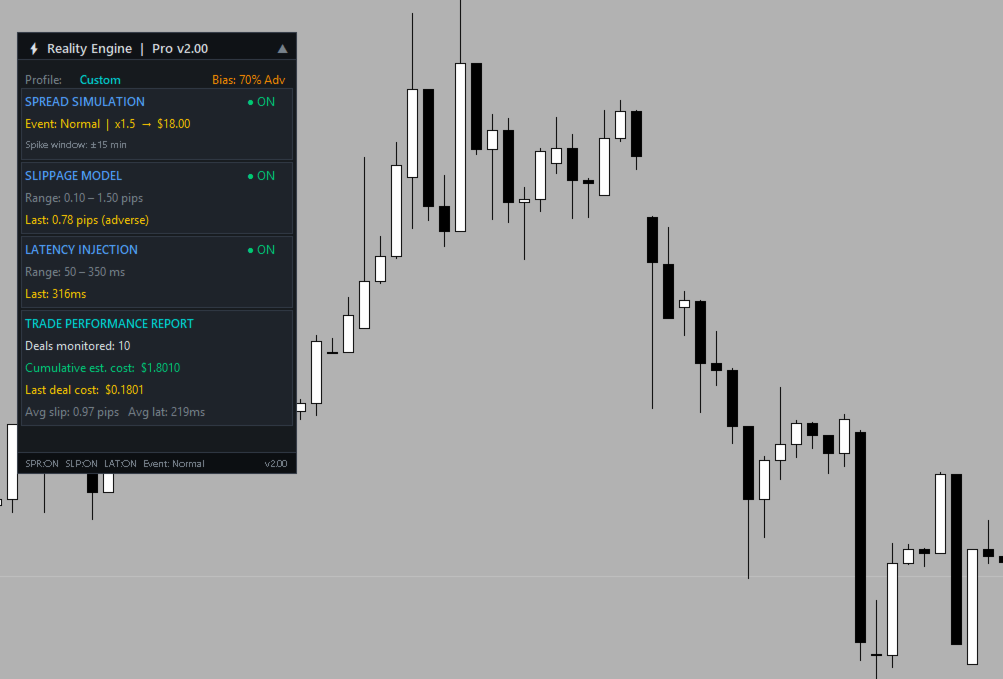
Reality Engine Pro is a passive, zero-interference MQL5 utility that attaches to any chart and silently monitors every trade execution in real time. It simulates the true cost of trading — spread, slippage, and latency — using intelligent broker profile presets, a live economic event calendar, and directional slippage bias curves. Every deal is captured the moment it fills, analysed, costed in your account currency, and logged to both the Experts tab and a clean in-terminal panel. No orders are placed. No strategy is altered. It watches, measures, and reports.
What It Does Exactly
- Detects every live deal via OnTradeTransaction the instant it fills
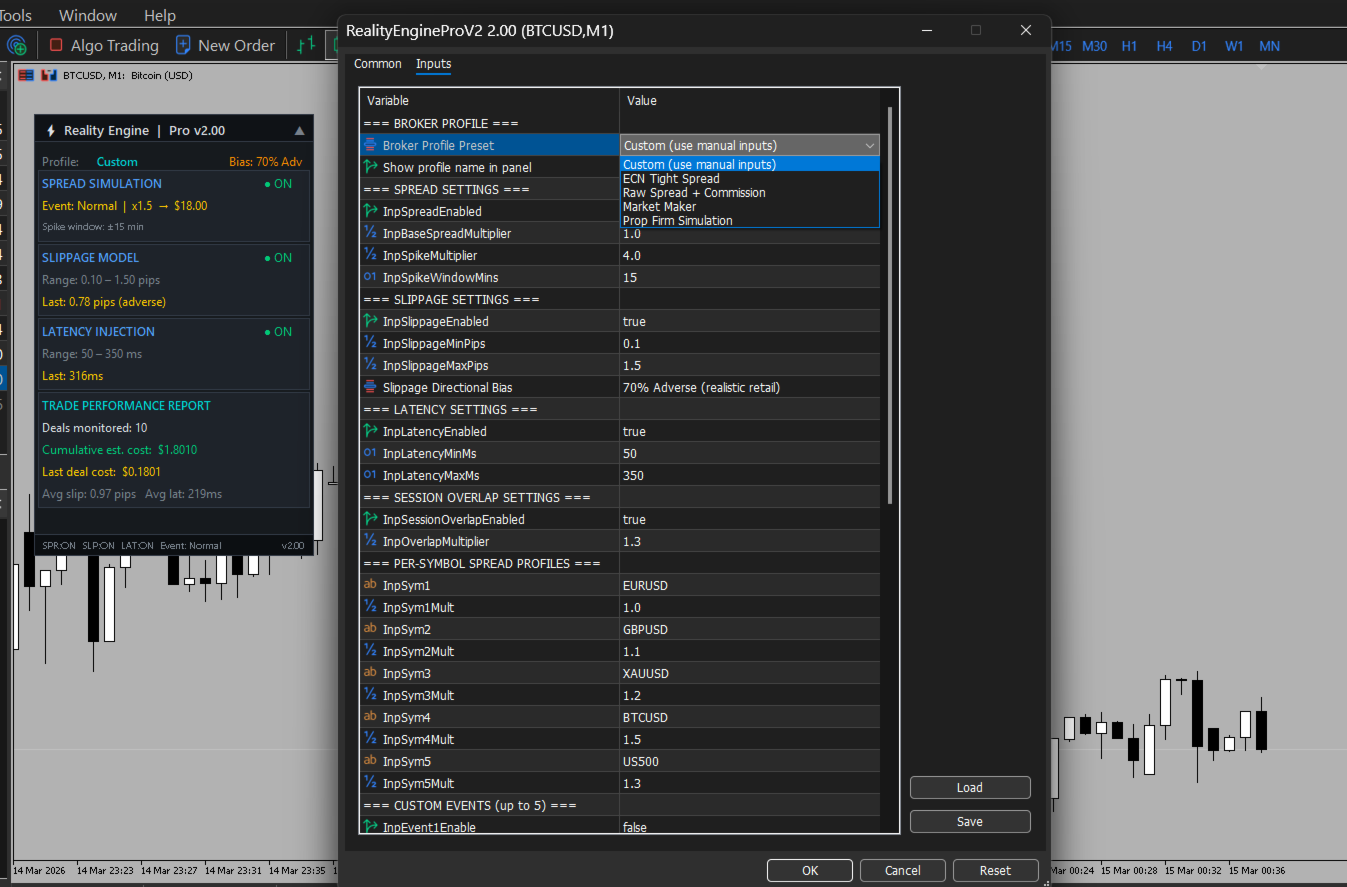
- Selects a broker profile pre-set (ECN Tight, Raw Spread, Market Maker, Prop Firm, or Custom) that auto-configures all spread, slippage, and latency ranges
- Simulates spread cost adjusted for the current market session and any active high-impact event — London Open, NY Open, NFP, FOMC, US CPI, ECB, BOE, or any of your 5 custom events
- Applies a slippage bias curve — Balanced (50/50), Adverse (70%), Heavy Adverse (85%), or Favourable — to model realistic directional fill behaviour
- Simulates execution latency within the configured range (e.g. 50–350ms for Custom, 15–100ms for Raw Spread)
- Calculates an estimated deal cost in account currency per trade combining spread + slippage × lot size × tick value
- Displays a live trade report panel on the chart showing: deals monitored, last deal cost, average slippage, and average latency — all updating in real time
- Formats output intelligently per asset class: pips for FX, points for indices, USD $ for crypto
Why It's Useful
Most retail traders have no idea what their trades actually cost beyond the quoted spread. Reality Engine Pro surfaces the hidden cost layer — the slippage you absorb on every fill, the latency between your click and your execution, and how those costs compound across a session or a strategy. With broker profile presets you can simulate how the same strategy would perform under ECN conditions vs a market maker. With custom events you can stress-test your execution around your own scheduled news. With the trade report panel you see cumulative data building in real time — not after the fact in a spreadsheet.
It is the difference between trading blind and trading informed.
Who Can Use It
| User | Why They'd Use It |
|---|---|
| Retail FX / Crypto traders | Understand the real cost of each execution, not just the headline spread |
| Prop firm traders | Simulate prop firm execution conditions and track cost per deal against drawdown limits |
| Strategy developers / EA coders | Validate that an automated strategy remains profitable after realistic execution friction |
| Back testing analysts | Identify the gap between back test assumptions and live execution reality |
| Broker comparison researchers | Run the same setup under different broker profiles to quantify execution quality differences |
| Risk managers | Monitor cumulative execution cost as a risk factor across a trading session |
What Changed: v1 Standard → v2 Pro
| Area | v1 Standard | v2 Pro |
|---|---|---|
| Broker Profiles | None — fixed ranges | 4 presets + Custom (auto-configure everything) |
| Slippage Bias | Hard-coded 67% adverse | 4 selectable modes: 50/50 → 85% adverse |
| Per-Symbol Spreads | Not available | 5 configurable symbol overrides in Inputs |
| Custom Events | Not available | Up to 5 user-defined events (name + date + multiplier) |
| Trade Report Panel | Not available | Live section: deals, cumulative cost, avg slip/lat |
| Deal Cost | Not calculated | EstimateDealCost() in account currency per deal |
| Panel Title | Standard v1.00 | Pro v2.00 + profile badge + bias label |
What's Coming in v3 — Reality Engine Elite
- Spread heatmap — visual heat overlay on the chart showing spread intensity over time
- Monte Carlo simulation — run thousands of execution scenarios on your history to get probability distributions of outcome
- CSV export — dump every logged deal with full execution metadata to a file for offline analysis
- Full analytics dashboard — session-level charts: slippage distribution, latency histogram, cost per symbol, cost per hour of day
- Multi-chart aggregation — single Elite panel that consolidates data from all monitored charts simultaneously
- Alert system — configurable alerts when slippage or cost exceeds thresholds