Trendlines5
- Indicadores
- Versão: 5.30
- Ativações: 5

Trendlines v5 — MACD-Based Multi-Timeframe Trendlines and Support Levels
Short description
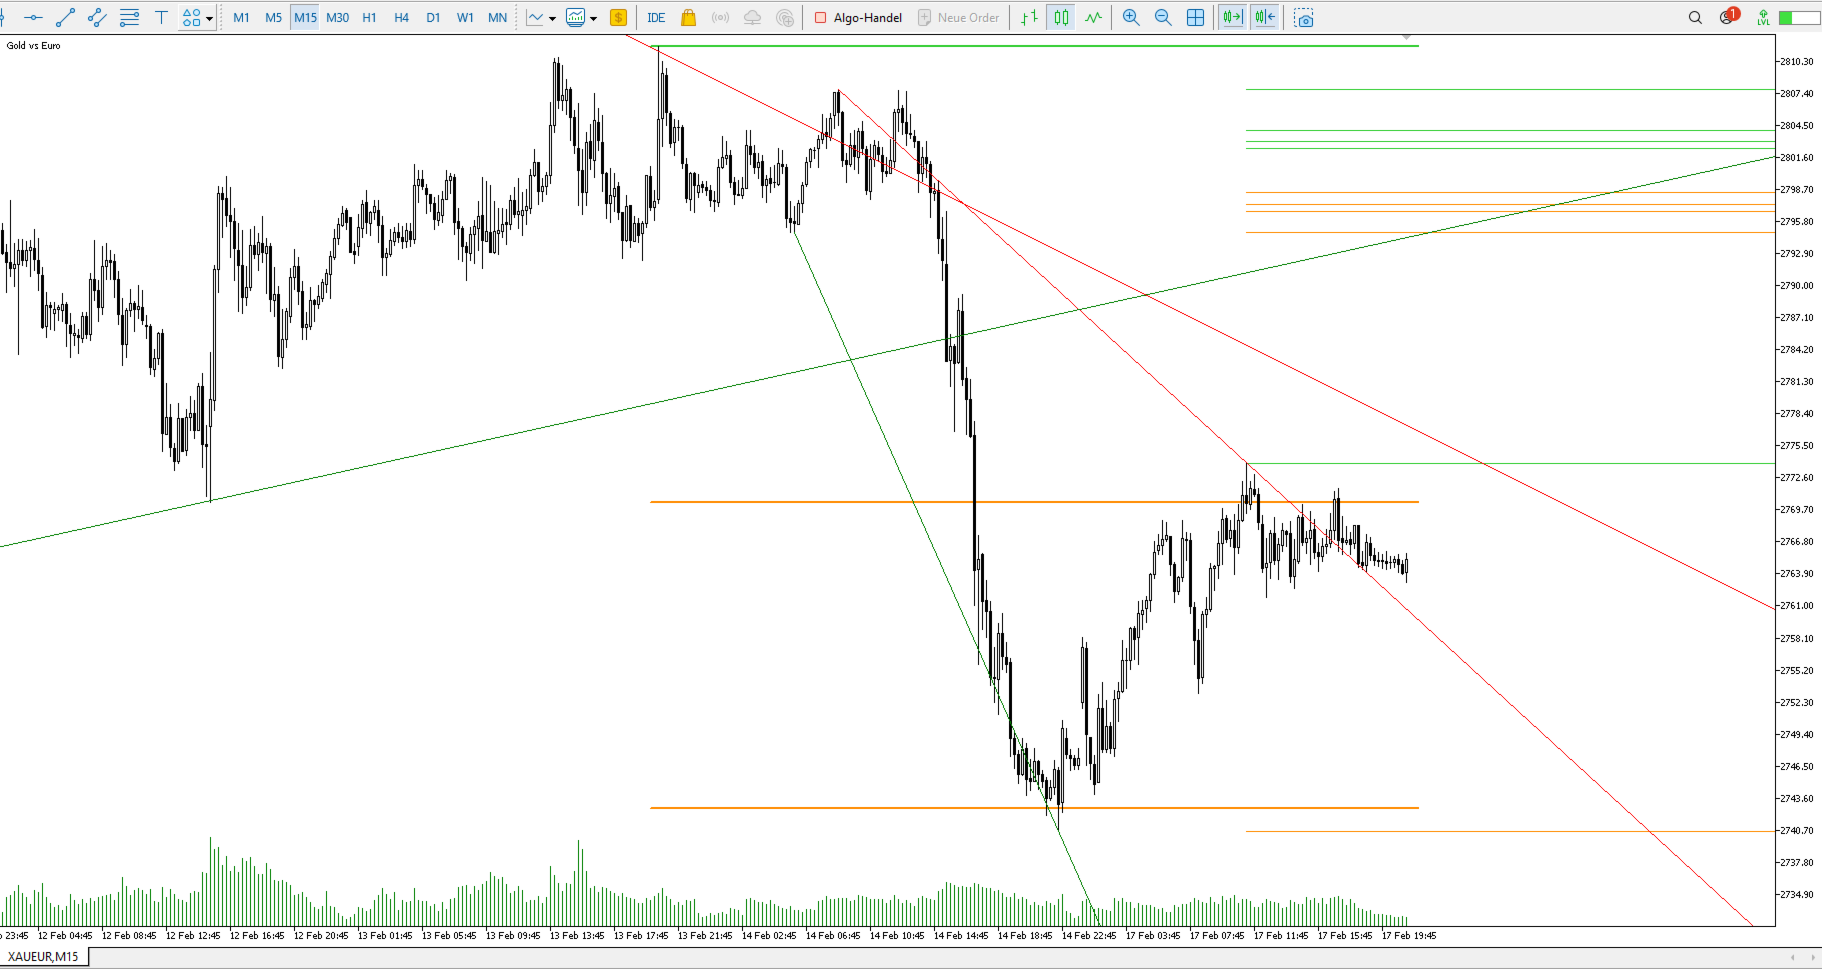
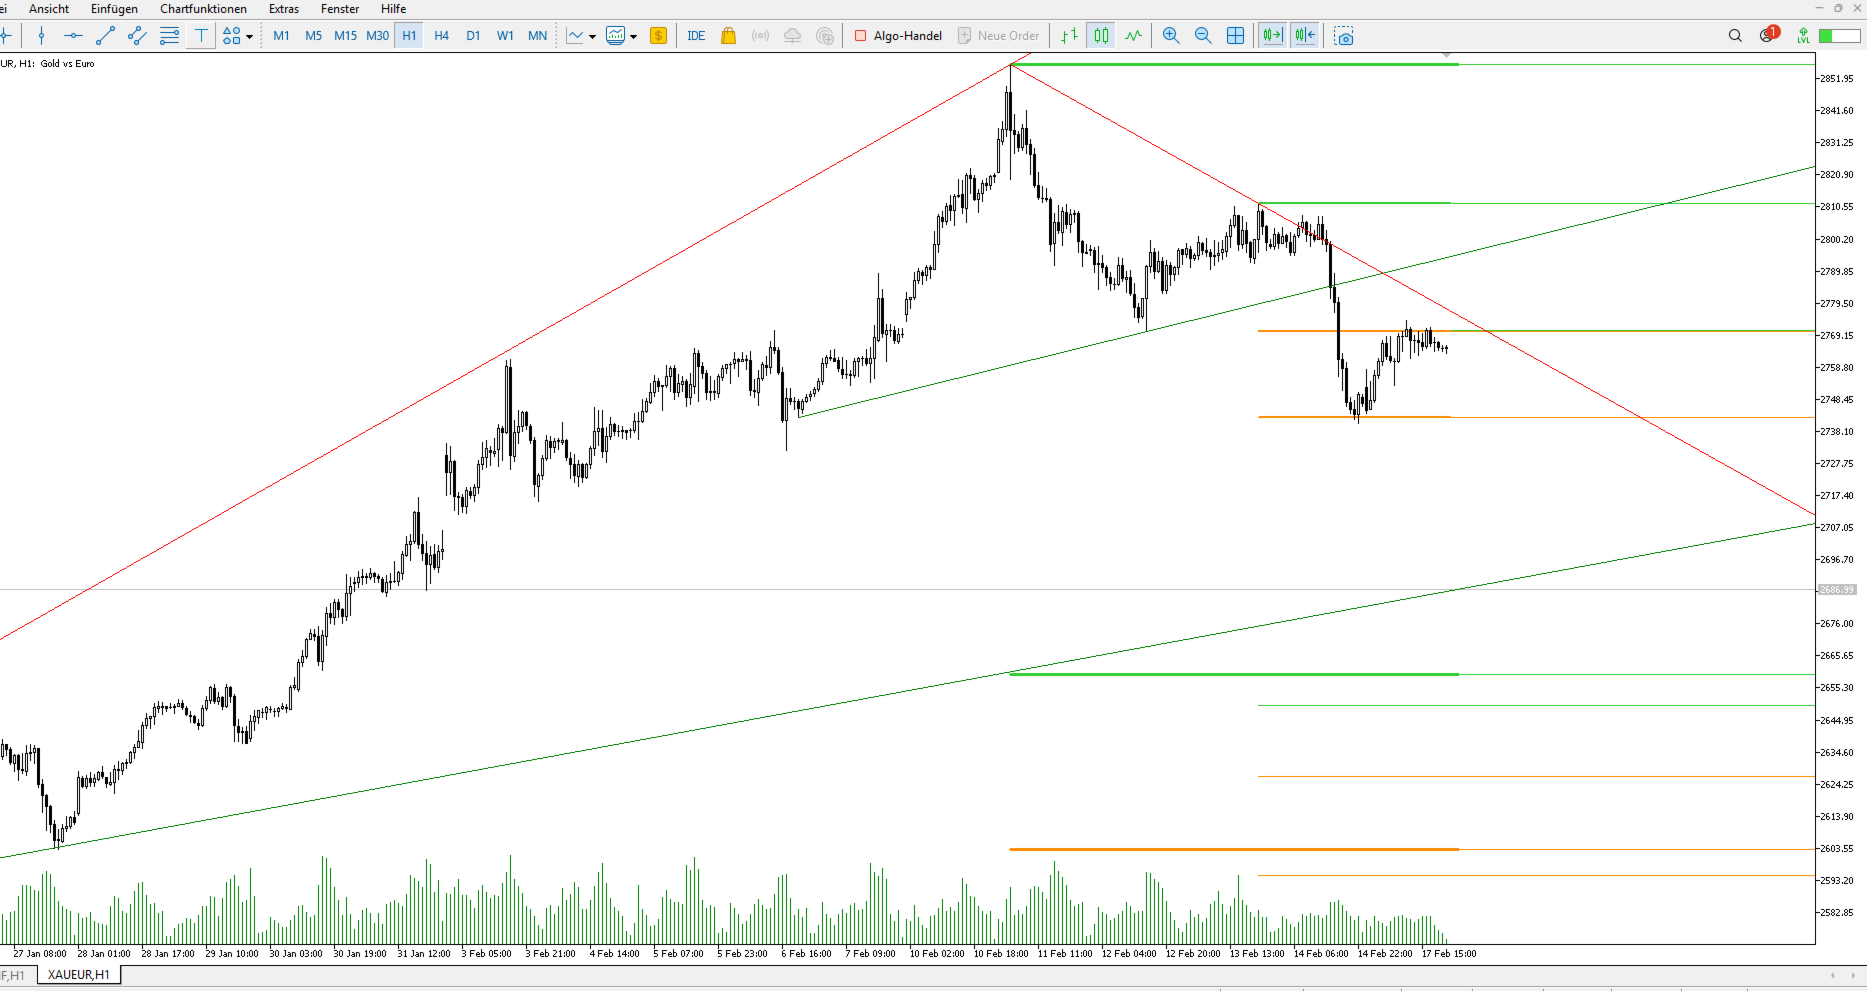
Trendlines v5 automatically draws clean, non-repainting trendlines and support levels derived from MACD phase pivots across D1, H4, H1 and the current chart timeframe, with strict timeframe visibility filtering for a clutter-free view.
Overview
Trendlines v5 is a chart-window indicator for MetaTrader 5 designed to help traders visualize market structure using automatically generated trendlines and support levels.
Core logic (how it works)
These extremes are used as pivots to construct upward and downward trendlines, while additional pivots form horizontal “Buy Support” and “Sell Support” levels for practical support/resistance mapping.
Multi-timeframe design with visibility control
Trendlines v5 can draw separate sets of lines for D1, H4, H1 and the current chart timeframe.
To keep the chart readable, each set is restricted to appropriate timeframes (e.g., H1 lines are not displayed on H4/D1 charts), implemented via object timeframe visibility settings.
Inputs (settings)
-
Enable/disable trendlines per timeframe: Current, H1, H4, D1.
-
Enable/disable support levels per timeframe: Current, H1, H4, D1.
-
Line widths per timeframe and customizable colors for uptrend, downtrend, and support levels.
-
Minimum bars requirement to ensure stable calculations.
All ON/OFF options are presented as clear drop-down selections (ON/OFF) in the indicator properties.