CiSD

CiSD | Change in State Delivery

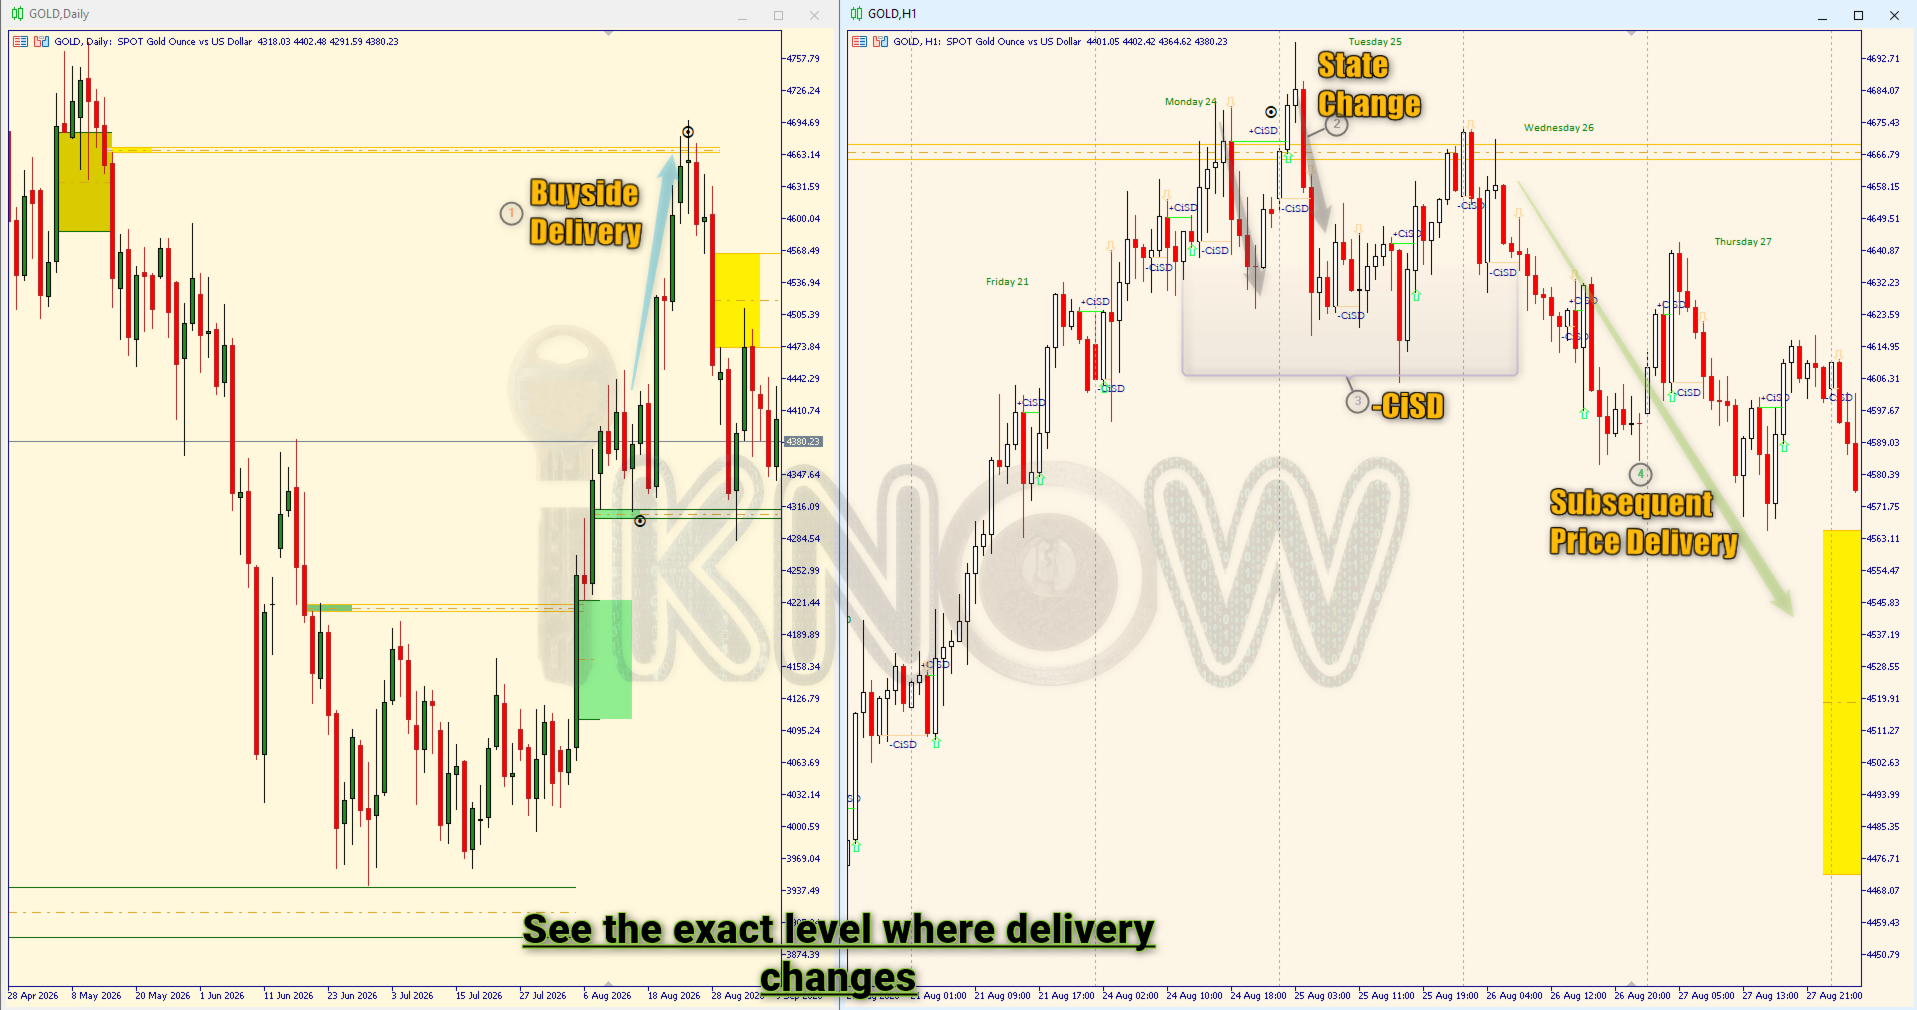
See exactly where price delivery changes direction.

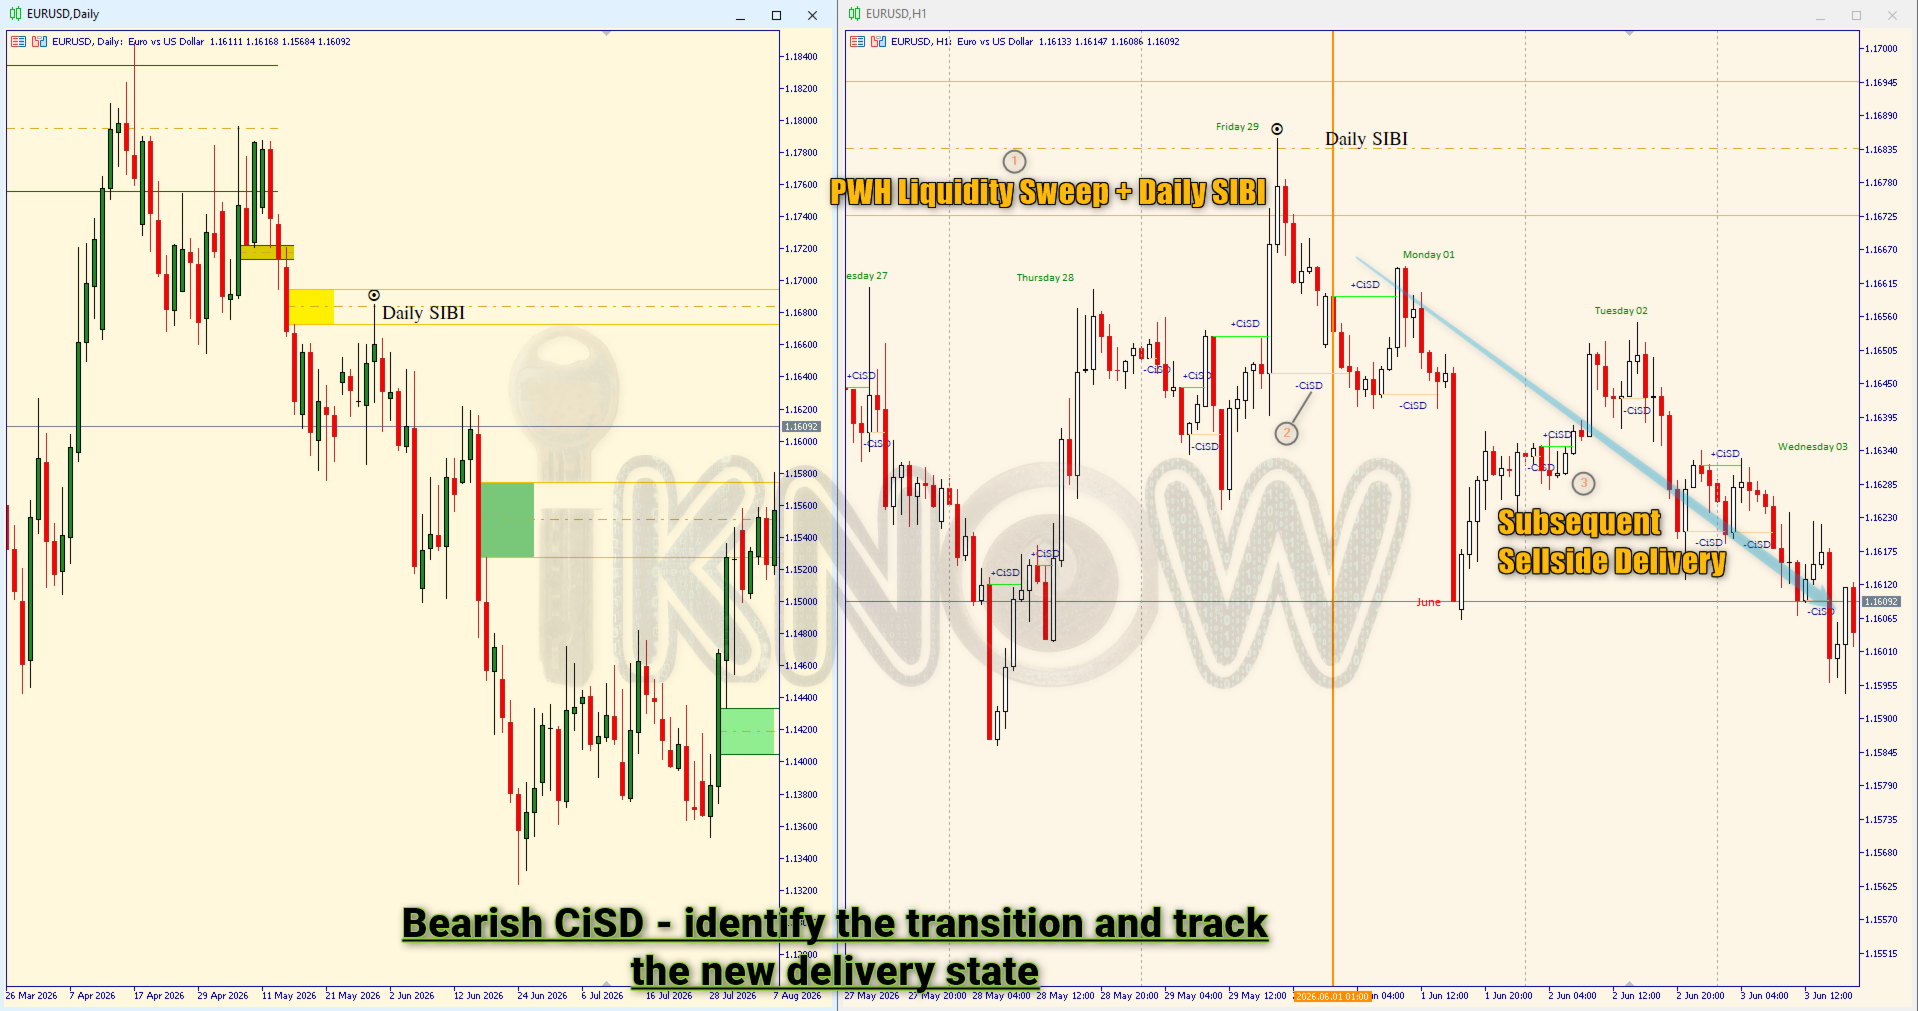
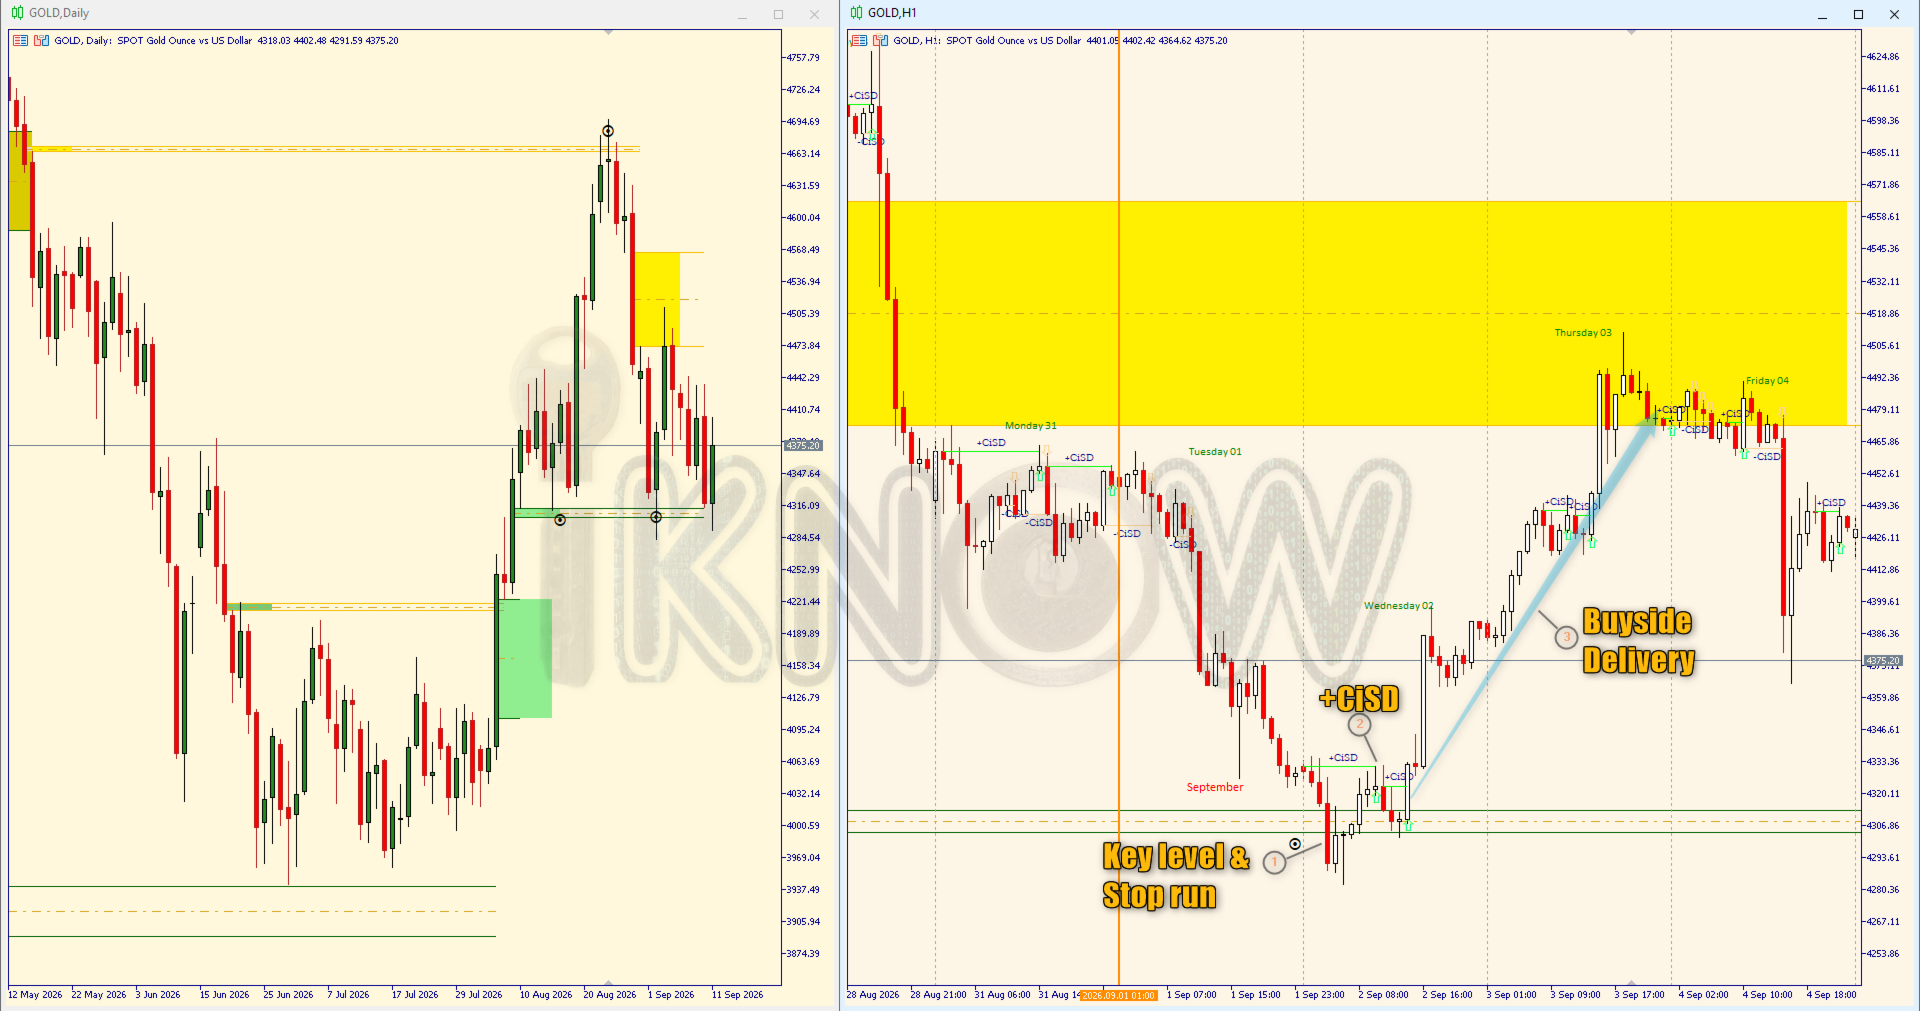
CiSD automatically detects Change in State Delivery and plots the critical price associated with the shift - giving ICT/SMC traders a precise reference level without manually searching through candle sequences.

DETECT → MARK → CONFIRM → ANALYZE

Figure 1: See the exact level where the delivery state changes.

CiSD is designed for traders who use liquidity, displacement, market structure, FVGs/Imbalances and premium/discount Arrays as part of their analysis.

Instead of manually identifying every delivery-state transition and marking the originating price, CiSD does the repetitive chart work for you.

The objective isn't to give you another buy/sell arrow. It's to show you the level where the delivery state changed.

What CiSD Gives You

🎯 Precise CiSD Levels

Automatically identifies and plots the relevant opening price associated with the Change in State Delivery.

↔ Bullish & Bearish State Changes.

Clearly distinguish transitions toward bullish or bearish delivery.

📍 Persistent Chart Reference

Keep the CiSD levels visible so you can study subsequent price action around the originating level.

📚 Historical Analysis

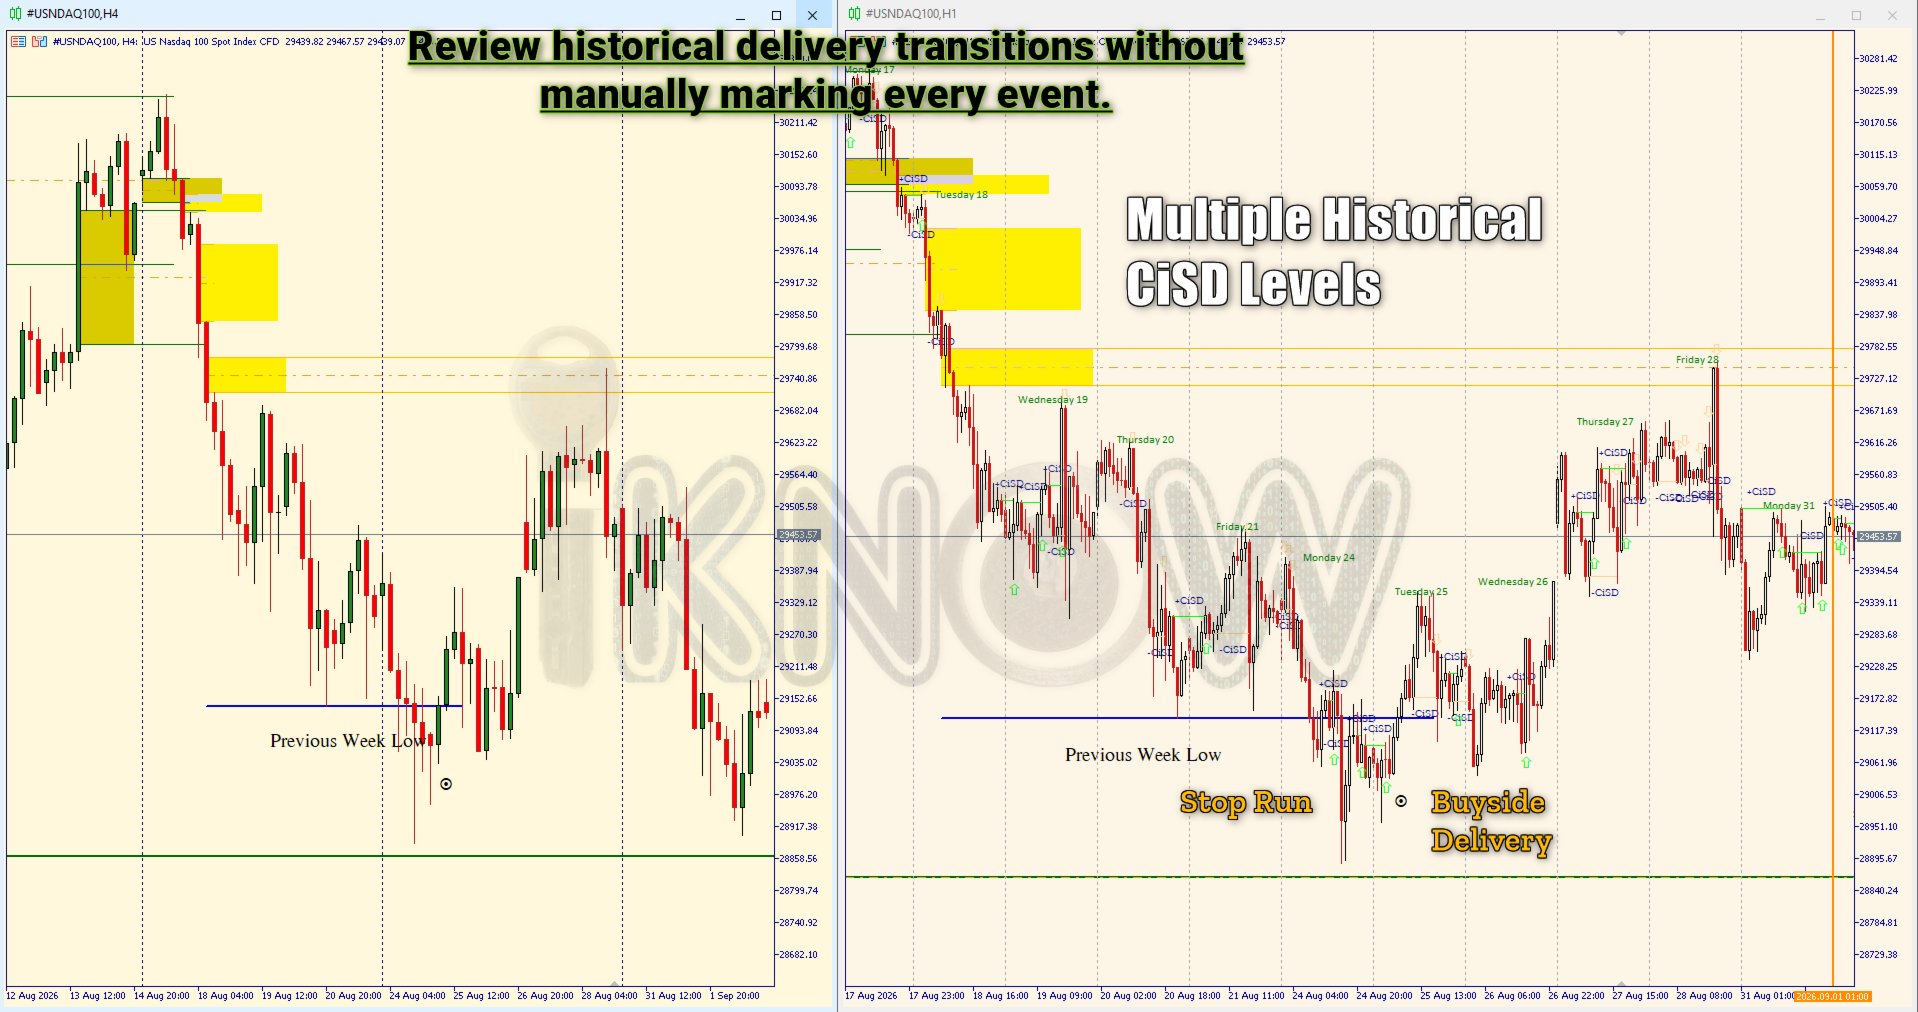
Review previous CiSD events directly on the chart instead of manually reconstructing historical examples.

🤖 Automated Detection

Continuously monitor price action for qualifying CiSD events while you focus on market interpretation.

⏱ Time-Saving Workflow

Reduce repetitive chart marking and focus your attention on context, confirmation and execution.


How It Works

01

Price Delivers

Price is delivering toward liquidity or inefficiency in one direction.

02

Delivery Changes

Price action satisfies the conditions defining a Change in State Delivery.

03

CiSD Is Identified

The indicator identifies the corresponding delivery transition.

04

Level Is Plotted.

The associated opening price is displayed directly on the chart

05

You Analyze the Context

Evaluate Continuation, Retracement, Liquidity targets, FVG/Imbalance interaction, Structure and invalidation.


How It Works

Why Traders Use CiSD

Manual CiSD analysis can require repeatedly:
Watch candles → identify the transition → located the correct candle →find its opening price → monitor price → repeat.
CiSD automates that repetitive process.

Instead of asking:

"Where exactly did the delivery change?"

You can immediately see:

"This is the CiSD level. Now what is price doing around it?"

That makes the tool useful for both live analysis and historical chart study.


Manual analysis vs. CiSD Automation?

Spend less time maintaining your chart and more time interpreting price action — no more drawing lines and second-guessing whether a true state change occurred.

Manual Process

  1. Watch candle sequences continuously.
  2. Identify delivery state transition
  3. Locate the specific initiating candle
  4. Manually draw line at opening price
  5. Monitor interaction and repeat

The CiSD Workflow

  1. Monitor: Indicator tracks algorithm behaviour
  2. Detect: Instant shift identification
  3. Mark:Automatic level plotting
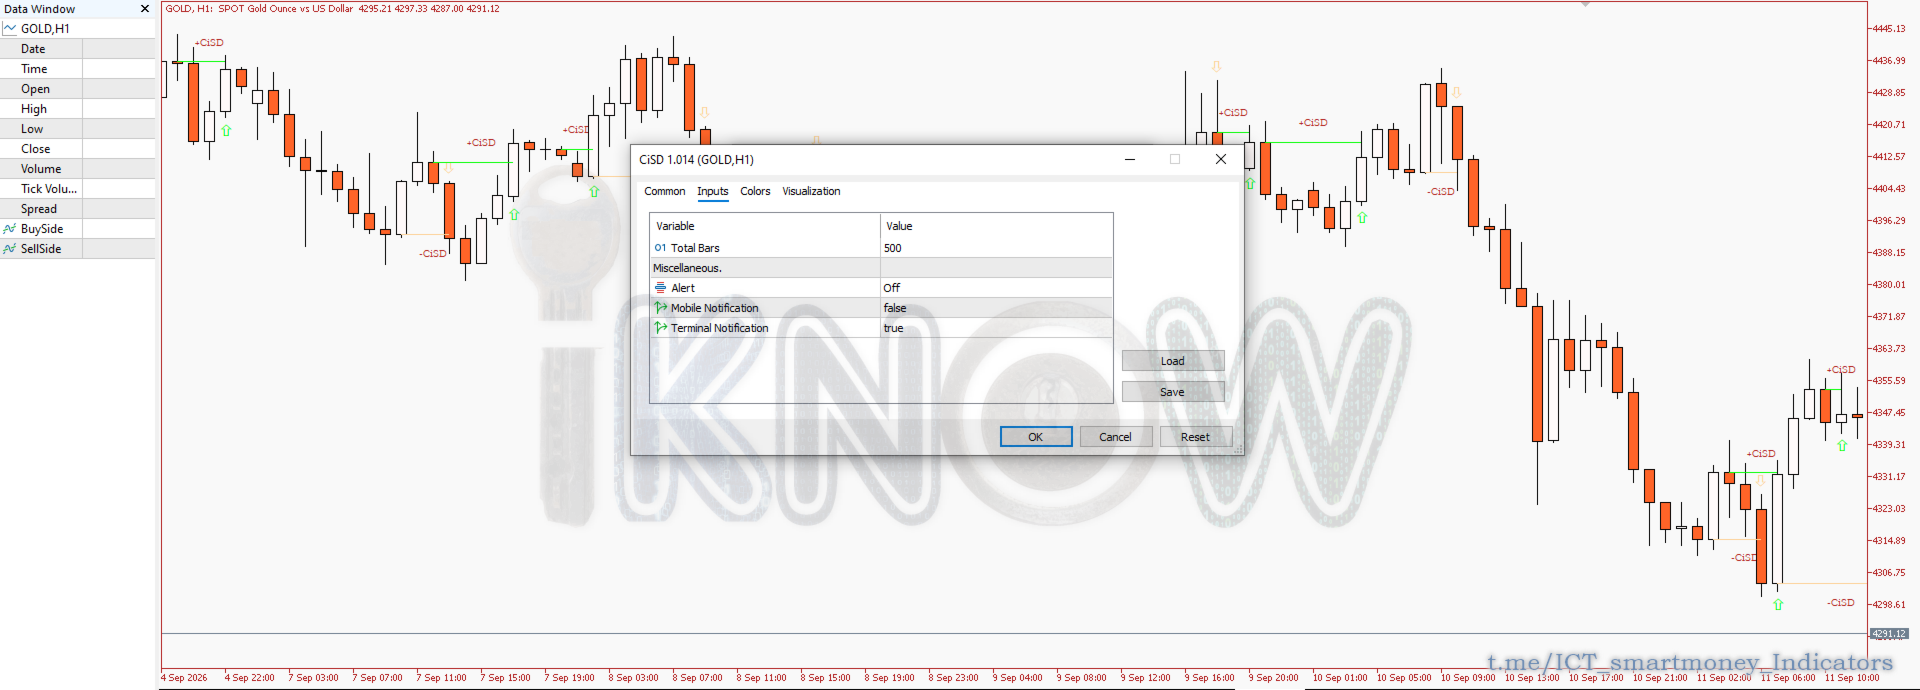
  4. Alert: Terminal & mobile notifications
  5. Analyze: Focus purely on trade execution

How to Trade with CiSD Levels

  1. Price Delivers: Price moves toward liquidity in a single direction.
  2. State Shifts: Candle conditions satisfy a CiSD transition.
  3. Level Plotted: The exact opening price level is locked onto the chart.
  4. Execution Analysis: Evaluate price action around the level for continuation setups, retracement entries, or invalidation.

Built for Traders who Already Understand the Framework

CiSD is intended for traders already familiar with concepts such as:

Change in State Delivery Buyside/Sellside Liquidity Displacement PD Arrays Fair Value Gaps/Imbalance. Market Structure Liquidity Sweeps

Already familiar with CiSD?

Go directly to the demo and verify the indicator's output on your own charts.

New to CiSD?

Learn the underlying ICT concept first. The indicator is an analysis tool, not a substitute for understanding the methodology.

CiSD does not replace your model - it adds the missing timing trigger.


Understanding Change in State Delivery

The Change in State delivery (CiSD) is a microstructure indicator that identifies critical pivotal points where the market (Price delivery Algorithm) shifts its directional focus from seeking liquidity on one side of the market to the other. Specifically, it signals a transition from buyside-driven liquidity to sellside-driven liquidity. CiSD marks the precise opening price that signals  a fundamental change in market structure and delivery direction.

What is State Delivery?

State delivery refers to the Market algorithm's active pursuit of liquidity pools and price inefficiencies. The market operates in two distinct delivery states:

  • Bullish State Delivery: Actively seeking Buyside liquidity (buystops, sell limits above highs) and premium inefficiencies.
  • Bearish State Delivery: Actively seeking Sellside Liquidity (sellstops, buy limits below lows) and discount inefficiencies.

What is a Change in State Delivery (CiSD)?

A CiSD occurs when price transitions from one delivery directive to the opposite:

  • Bullish to Bearish: Price stops seeking buyside liquidity and pivots to target sellside liquidity.
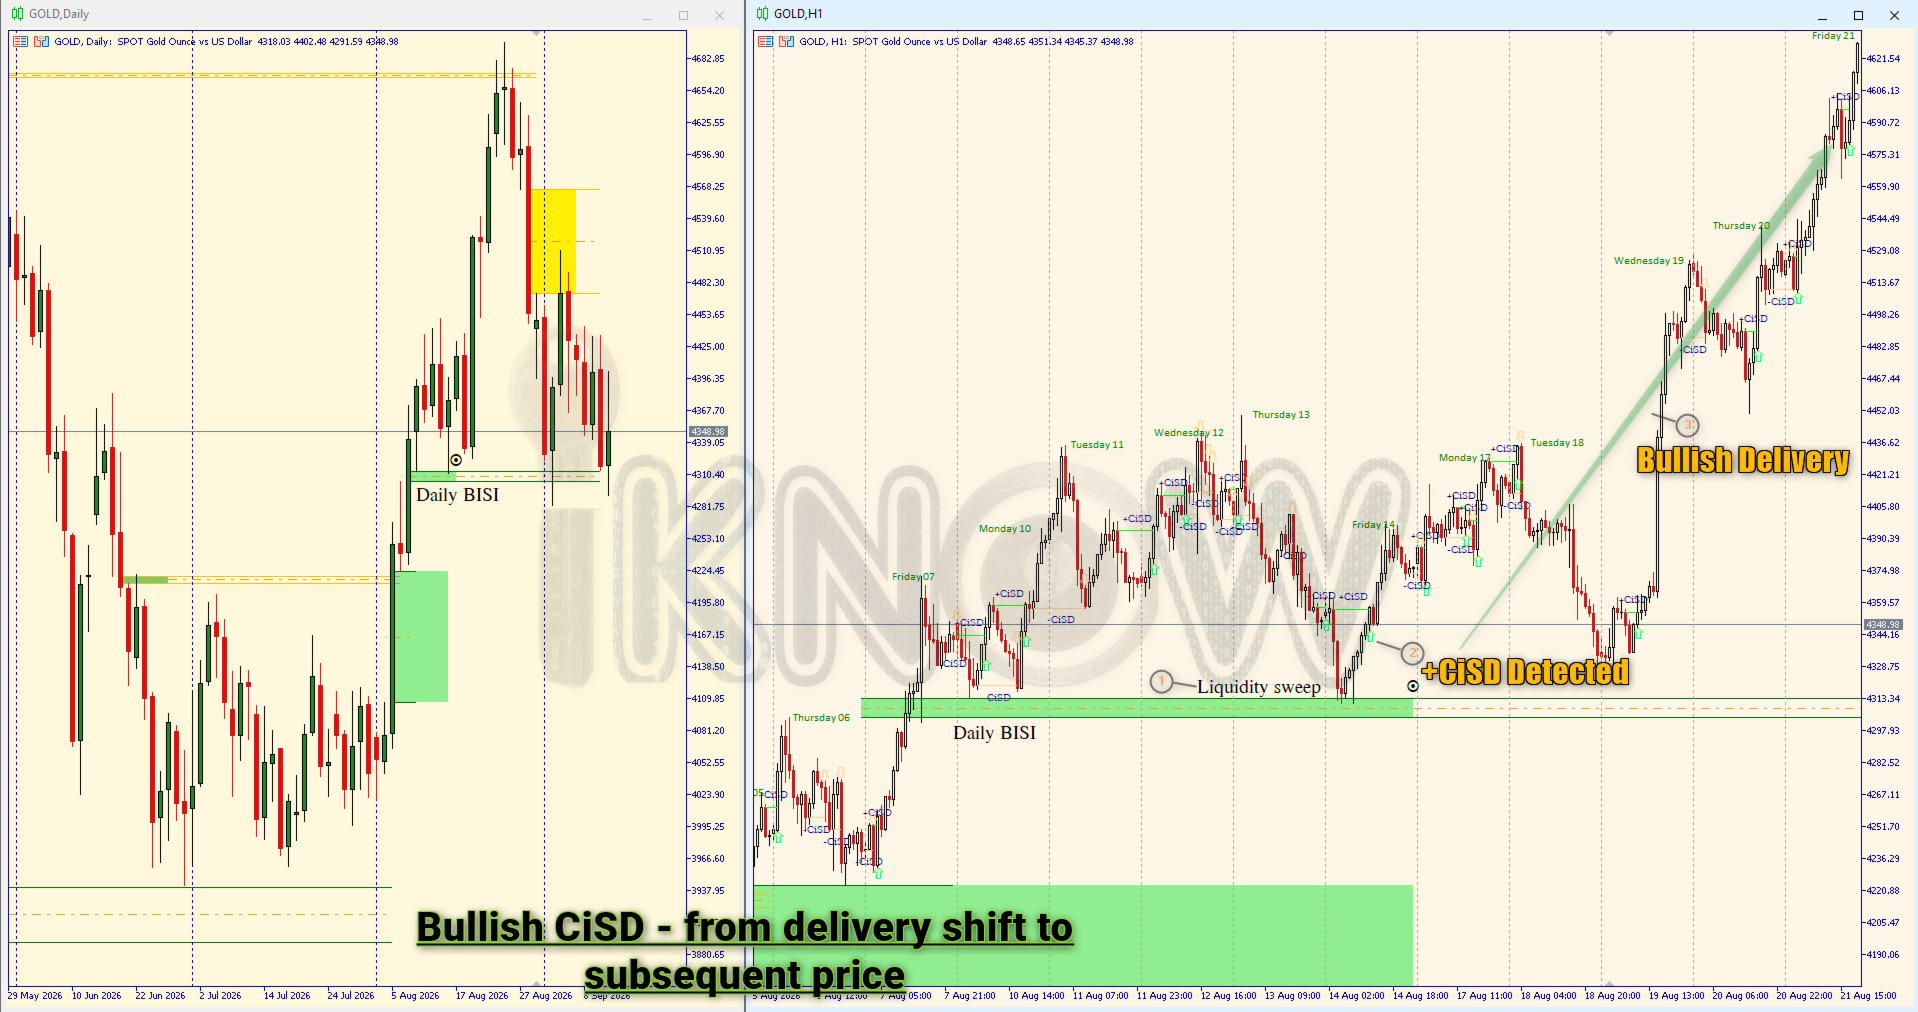
  • Bearish to Bullish: Price stops seeking sellside liquidity and pivots to target buyside liquidity.

The CiSD opening price is the specific candle open that initiates this directional shift. This level becomes a critical reference point as it marks where the market's intent changed, establishing a new delivery bias.


Key Components/Features

  1. CiSD Opening Price
  2. The opening price of the candle that triggers the change in state delivery. This price level acts as:

    • A pivot point for the new directional bias
    • A potential invalidation level for the current delivery state
    • A reference for measuring premium/discount zones

  3. Delivery Direction
  4. Once a CiSD is identified, the indicator determines the new market directive:

    • Bullish CiSD: Market now seeks premium inefficiencies and/or Buyside liquidity
    • Bearish CiSD: Market now seeks discount inefficiencies and/or Sellside liquidity

  5. Target Zones
  6. Based on the CiSD, the market will now pursue:

    • Premium Inefficiencies: Fair Value Gaps (FVG), imbalances, and unfilled orders above current price
    • Discount Inefficiencies: Fair Value Gaps (FVG), imbalances, and unfilled orders below current price
    • Liquidity Pools: Buyside (above) or Sellside (below) concentrations
    • Combination Targets: Both inefficiencies and liquidity on the same side

Features

The indicator displays:

  1. CiSD Level Line: Horizontal line at the opening price where state change occurred.
  2. Directional Arrow: Visual indicator showing new delivery direction.
  3. Color Coding:
    • -Bullish CiSD: Blue/Green tones
    • -Bearish CiSD: Red/Orange tones
  4. Label: Text showing "CiSD" with timestamp and price level

Pricing

Rent it to try CiSD in live market conditions, or buy once and keep it.

Monthly

$40
per month

Lower initial commitment for traders who want to test the product over a shorter period.

Best value

Lifetime

$100
one-time purchase

Own the current product permanently instead of paying a recurring monthly fee.

A free demo is available so you can verify the indicator's behaviour on your charts before purchasing.


Frequently Asked Questions

  • What is CiSD?
  • CiSD (Change in State Delivery) identifies a transition from one directional delivery state to the opposite state, according to the indicator's defined methodology.
  • How does CiSD work?
  • CiSD monitors price action for a change in delivery state. When the conditions are met, it marks the opening price of the candle that initiated the transition and indicates the new delivery direction.

  • Is CiSD a buy/sell signal?
  • No, CiSD is primarily a market-analysis reference. Evaluate a CiSD event alongside liquidity, market structure, displacement, FVGs/imbalance, and your own execution model.
  • Does CiSD predict reversals?
  • No. A CiSD identifies a change in delivery according to its rules. It does not guarantee that price will reverse or continue in a particular direction.
  • Can I use CiSD with ICT/SMC concepts?
  • Yes. It's designed to complement workflows involving liquidity, displacement, FVGs/imbalance, market structure, and PD arrays.
  • Can I use it for historical analysis?
  • Yes. You can display historical CiSD events so traders can study previous delivery transitions and subsequent price action.
  • Does it work on all timeframes?
  • Yes. CiSD is designed to work across all timeframes.
  • Does the indicator repaint?
  • No. The indicator does not repaint.
  • Which Markets does it work on?
  • CiSD works across various financial markets, including forex, stocks, and futures.
  • Which timeframes?
  • It works on all timeframes.
  • Can I use the demo before buying?
  • Yes. The demo lets you verify the indicator's behaviour on your own charts before purchasing.
  • I think the indicator generated an incorrect CiSD. What should I do?
  • Please provide the following:
    • Chart screenshot
    • Symbol
    • Timeframe
    • Date/Time
    • Relevant candles
    • Expected result
    • Methodology/Reference used

    This allows the result to be investigated properly.


    Glossary of Terms

    • Liquidity: Areas where large numbers of pending orders are concentrated (typically above/below key price levels).
    • Buyside Liquidity: Concentration of buy-stop orders above current price (targets for bearish moves).
    • Sellside Liquidity: Concentration of sell-stop orders below current price (targets for bullish moves).
    • State Delivery: The market's current directional focus in seeking liquidity pools.
    • Premium Zone: Price area above a reference level (generally considered "expensive").
    • Discount Zone: Price area below a reference level (generally considered "cheap").
    • Inefficiency: Price imbalances or gaps where one-directional order flow dominated, leaving unfilled orders.

    ⚠️ Risk Disclaimer

    This indicator is a tool for market analysis and does not guarantee trading profits. Past performance does not indicate future results. Trading forex, stocks, and other financial instruments involves significant risk of loss and is not suitable for all investors. Always use proper risk management and never risk more than you can afford to lose. You should carefully consider your investment objectives, level of experience, and risk appetite before making any trading decisions.
    Produtos recomendados
    Heiken_Ashi_Bars - Visualizador de Tendência Avançado para MT5 Visão Geral Heiken_Ashi_Bars é um indicador poderoso e visualmente intuitivo projetado para filtrar o ruído do mercado e destacar a verdadeira tendência subjacente. Os gráficos de velas tradicionais costumam ser erráticos, levando a sinais falsos. Ao calcular a média dos dados de preços, este indicador suaviza a ação do preço, tornando significativamente mais fácil identificar continuações de tendências, reversões e zonas de entrada
    RBreaker
    Zhong Long Wu
    RBreaker Gold Indicators é uma estratégia de negociação intradiária de curto prazo para futuros de ouro que combina duas abordagens: o seguimento de tendência e as reversões intradiárias. Ela permite capturar lucros durante mercados em tendência e também realizar lucros oportunamente e operar na direção oposta quando o mercado se reverte. Esta estratégia foi classificada por 15 anos consecutivos entre as dez estratégias de negociação mais lucrativas pela revista americana Futures Truth. Ela pos
    Multi-Timeframe Heiken Ashi (Smoothed with Dashboard) Professional Market Structure Visualization with Weighted Confluence Scoring Transform your trading with crystal-clear multi-timeframe analysis. This indicator combines smoothed Heiken Ashi candles with an intelligent weighted scoring system to give you unprecedented clarity in any market condition. YOUR TRADING QUESTIONS – ANSWERED INSTANTLY: 1. What's the REAL trend direction? Dashboard Reveals:   Higher timeframe (MN1, W1, D1, H4) trend a
    Price Magnet — Price Density and Attraction Levels Indicator Price Magnet is a professional analytical tool designed to identify key support and resistance levels based on statistical Price Density. The indicator analyzes a specified historical period and detects price levels where the market spent the most time. These zones act as “magnets,” attracting price action or forming a structural base for potential reversals. Unlike traditional Volume Profile tools, Price Magnet focuses on price-time d
    Chỉ báo này sẽ thông báo cho bạn nếu cấu hình xu hướng thành công. Tín hiệu theo xu hướng không nên được tăng theo, nhưng tín hiệu mua ở mức giá thấp theo mô hình giao dịch thông thường của bạn, hoặc tín hiệu bán ở mức giá tốt, là một lựa chọn rất tốt. Hãy thiết lập nó trên khung thời gian lớn hơn và theo dõi các khung thời gian nhỏ hơn, bám sát các xu hướng chính. Tôi thường thiết lập ba khung thời gian gần nhau nhất và không bao giờ đi ngược tín hiệu của INdicator này. INdicator   này không có
    STRICTLY FOR BOOM INDEX ONLY!!!!! Here I bring the Maximum Trend Arrows OT1.0 MT5 indicator. This indicator is made up of a combination of different trend indicators for entries and exits, for entries an orange arrow will paint on the chart below the current market and a red flag for closing of trades and it produces buy arrows only. When the orange arrow appears, it will appear along with it's sound to notify you. The 1H timeframe is recommended, don't use it anywhere else than on the 1H timefr
    What Is Trend Master Pro? Trend Master Pro   is a professional-grade trend trading indicator built for MetaTrader 5. It was designed with one goal in mind — to keep you on the right side of the market at all times by combining three powerful technical tools into a single, clean, easy-to-read display directly on your price chart. Instead of cluttering your screen with multiple separate indicators, Trend Master Pro fuses an   EMA Ribbon trend filter , a   ZigZag swing point engine , and a   breako
    HAS RSI Signal — Indicador de Tendência Profissional com Cálculo de SL/TP O HAS RSI Signal é uma ferramenta de negociação poderosa que combina clássicos comprovados com algoritmos modernos de filtragem de ruído. O indicador analisa o mercado através das velas Heiken Ashi Smoothed (HAS) e do oscilador RSI , fornecendo sinais de entrada claros em momentos de reversão de tendência ou na saída de zonas de sobrecompra/sobrevenda. Principais Vantagens: Filtragem Dupla: O uso do Heiken Ashi Smoothed pe
    Structure King AI Signal Structure King AI Signal is a professional MetaTrader 5 trading indicator designed to help traders analyze market structure, trend direction, multi-timeframe confirmation and trade management from one clean dashboard. Key Features • Market Structure & Trend Analysis • BUY / SELL Signals • Multi-Timeframe (HTF) Confirmation • Entry Price Levels • Dynamic Stop Loss (SL) • TP1 / TP2 / TP3 Levels • ATR Volatility Analysis • ADX Trend Strength Filter • Adaptive Market Filter
    Footprint — é um indicador para análise de order flow e volume. Ele ajuda a identificar a estrutura do mercado no nível de clusters, encontrar zonas-chave com alta atividade e trabalhar com filtros diretamente no gráfico, sem a necessidade de abrir constantemente a janela de configurações. Recursos do indicador Footprint gráfico de clusters Bid x Ask, Delta; painel de controle no gráfico; controles deslizantes (sliders) para ajuste de filtros; Absorption; Initiative; Stacked Imbalances; Big Trad
    Fabii Half Trend Baseline
    Fabien Georges Andre Guillemaud
    Pare de operar contra a tendência do timeframe superior. Duas baselines, um gráfico. Sem repaint. Qualquer par, qualquer timeframe. No seu gráfico em 2 minutos. Demo gratuita no Strategy Tester. Get more indicators here Baselines, volatility filters and oscillators. No repaint. Por que você precisa Você entra em uma operação porque uma linha ficou verde no seu gráfico. Depois abre um timeframe superior e vê que a tendência maior aponta para o outro lado. O sinal era real. A tendência ao redor
    TradeAQ
    Guo Sheng Zhao
    LuoMo Volume & Price Structure 8.98 A multi-function chart indicator for   MetaTrader 4 and MetaTrader 5 , designed to display key volume, volatility, sentiment, and price-structure information directly on the main chart. Main Features Volume and price-based Support & Resistance Volume spike and exhaustion signals ATR volatility expansion alerts Volume Profile with HVN and LVN Bullish and bearish sentiment distribution Developing or fixed POC VAH and VAL levels Supply and Demand zones Volume-wei
    CosmiCLab SMC FIBO CosmiCLab SMC FIBO is a professional trading indicator designed for traders who use Smart Money Concepts (SMC), market structure analysis and Fibonacci retracement levels. The indicator automatically detects market swings and builds Fibonacci levels based on the latest impulse movement. It also identifies market structure changes such as BOS (Break of Structure) and CHOCH (Change of Character), helping traders understand the current market direction. CosmiCLab SMC FIBO also pr
    Heiken Ashi Smoothed Strategy is a very simple but powerful system to get forex market trend direction. This indicator is actually 2 indicators in 1 pack, Heiken Ashi and Heiken Ashi Smoothed Moving Average both included. Because HA (Heiken Ashi) and HAS (Heiken Ashi Smoothed) are calculated in the same one system event with necessary buffers and loop only, so it is the FAST, OPTIMIZED and EFFICIENT HA having the combined indicator of MetaTrader 5. You can choose to display HA and HAS in the sam
    Renko System
    Marco Montemari
    This indicator can be considered as a trading system. It offers a different view to see the currency pair: full timeless indicator, can be used for manual trading or for automatized trading with some expert advisor. When the price reaches a threshold a new block is created according to the set mode. The indicator beside the Renko bars, shows also 3 moving averages. Features renko mode median renko custom median renko 3 moving averages wicks datetime indicator for each block custom notification
    IC Flat Pro The True Math
    Aruncharan Ganapathy Sivakumar
    IC FLAT PRO – THE TRUE MATH   Early Adopter Pricing Secure IC FLAT PRO – THE TRUE MATH at the current launch price. Once the first 10 purchases  have been sold, the price will increase by USD 300 . Institutional-Grade Market Structure Analysis for MetaTrader 5 IC FLAT PRO – THE TRUE MATH is a premium institutional-grade market structure indicator developed for serious traders who demand precision, consistency, and high-quality trade opportunities. Built using advanced mathematical algorithms
    Smart Support And Resistance Indicator See the Market Levels That Matter. Make your chart clearer and your technical analysis more organized with Smart Support And Resistance Indicator — a powerful trading tool designed to help traders identify important support and resistance levels directly on their MetaTrader 5 charts. Whether you trade Forex, Gold, Indices, or other available markets, this indicator helps you focus on key price areas, monitor potential market reactions, and analyze price act
    Harraz Scalper System Pro
    Muhammad Azraf Bin Dzul Fauzi
    Harraz Neural Scalper PRO – The Future of XAUUSD Scalping ​Experience the next generation of precision trading with the Harraz Neural Scalper System. ​Are you tired of cluttered charts and lagging signals? Harraz Neural Scalper v2.8 is not just an indicator; it’s a high-performance AI Neural HUD designed specifically for the fast-paced world of Gold (XAUUSD) scalping. ​Built with a surgical crossover logic and filtered by a 200-period Major Trend Engine, this system ensures you are always on th
    Indicador Crypto_Forex "Padrão Martelo e Estrela Cadente" para MT5, sem repintura, sem atraso. - O indicador "Padrão Martelo e Estrela Cadente" é um indicador muito poderoso para negociação de Price Action. - O indicador detecta padrões Martelo de alta e Estrela Cadente de baixa no gráfico: - Martelo de alta - Sinal de seta azul no gráfico (veja as imagens). - Estrela Cadente de baixa - Sinal de seta vermelha no gráfico (veja as imagens). - PC, Mobile alerts. - O indicador "Padrão Martelo e Est
    AutoTrend Pro
    Aram Hussein Mohammed
    TL Method — Automatic Trendline Detection & Strength Indicator Tired of drawing trendlines manually? TL Method does it for you — automatically detecting, drawing, and scoring trendlines in real time. What it does: Scans up to 1000 bars to find valid support and resistance trendlines Scores each trendline by counting confirmed anchor touches Generates buy/sell signal arrows when price approaches strong trendlines Alerts you via popup, push notification, or sound — with smart cooldown to avoid spa
    Liquidity Order Blocks MT5
    Johan Adrian Nieto Resendiz
    Liquidity Order Blocks MT5 Liquidity Order Blocks MT5 is a professional visual indicator for MetaTrader 5 designed to help traders identify and monitor potential bullish and bearish liquidity areas directly on the chart. The indicator detects pivot-based order block zones and displays each zone with a structured visual breakdown of estimated bullish volume, bearish volume, relative strength and delta. Its purpose is to make liquidity areas easier to read, compare and monitor during market analys
    "Adjustable Fractals" - é uma versão avançada do indicador fractal, uma ferramenta de negociação muito útil! - Como sabemos, o indicador padrão fractals MT5  não tem qualquer configuração - isto é muito inconveniente para os comerciantes. - Fractais Ajustáveis ​​resolveu este problema - tem todas as configurações necessárias: - Período ajustável do indicador (valores recomendados - acima de 7). - Distância ajustável dos máximos/mínimos do preço. - Design ajustável de setas fractais. - O indicad
    Hunter trend
    Yaroslav Varankin
    Hunter Trend: Arrow Indicator for Binary Options Trading Hunter Trend is an arrow indicator designed for trading binary options (turbo options) on the M1 timeframe, allowing for short-term trading opportunities. How to Trade with this Tool: Signals may appear when a candlestick forms. Once such a signal appears, wait for the closure of that candlestick. Upon the opening of a new candlestick, open a trade for 1-2 candlesticks in the indicated direction. In this case, for 1-2 minutes. A blue dot
    Kalman Cone Forecast MT5 Kalman Filter indicator for MT5 with adaptive trend smoothing, a forward price prediction cone, volatility bands and non-repainting exhaustion dots. Find Clarity in Noisy Markets Short-term price noise makes it hard to tell a real move from random wiggles. Ordinary moving averages either lag too much or react to every spike. Kalman Cone Forecast gives you a clean trend line, a realistic price range ahead, and a clear answer on whether conditions suit a trade. Kalman Fil
    Order Book, known also as Market Book, market depth, Level 2, - is a dynamically updated table with current volumes of orders to buy and to sell specific financial instument at price levels near Bid and Ask. MetaTrader 5 provides the means for receiving market book from your broker, but in real time only, without access to its history. The indicator OrderBook Cumulative Indicator accumulates market book data online and visualizes them on the chart. In addition, the indicator can show the market
    Divergent Stochastic Filter II Catch Reversals Early, Filter Noise, Trade with Confidence The Edge: Why This Stochastic is Different  Every trader knows the Stochastic oscillator. But knowing when to trust its signals, that's the real challenge. The Divergent Stochastic Filter II transforms this classic indicator into a precision reversal detection system by adding critical elements: divergence intelligence, signal filtering and exhaustion detection.  While standard Stochastic oscillators fire s
    Oscillator trading signals - это динамический индикатор, определяющий состояние к продолжению тенденции роста или падению цены торгового инструмента и отсечению зон с нежелательной торговлей. Индикатор состоит из 2 линий осцилляторов. Медленная и быстрая сигнальная линия.  Шкала отображения перевернутая. Зоны вблизи 0 свидетельствуют о тенденции роста цены валютной пары. Зоны -100 свидетельствуют о падении цены валютной пары. На основном графике в виде стрелок отображается потенциально выгодные
    AW Heiken Ashi MT5
    AW Trading Software Limited
    AW Heiken Ashi — Indicador inteligente de tendência e níveis de TP. Indicador avançado baseado no Heiken Ashi clássico, adaptado para traders, com maior flexibilidade e clareza. Ao contrário do indicador padrão, o AW Heiken Ashi ajuda a analisar a tendência, determinar metas de lucro e filtrar sinais falsos, proporcionando decisões de negociação mais seguras. Guia de configuração e instruções - Aqui / Versão MT4 - Aqui Vantagens do AW Heiken Ashi: Funciona em qualquer ativo e período de tempo, A
    KasTon Trend System: The Complete 2-in-1 Trading Strategy Identify the Trend, Confirm the Signal, and Trade with Confidence! Do you suffer from confusion while trading? Do you find it difficult to determine the market's direction? Are you tired of losing money on false signals? The KasTon Trend System is here as an integrated solution to all these problems. This is not just an indicator; it is a complete trading strategy built on the synergy of two powerful, custom-built indicators. Our main g
    Os compradores deste produto também adquirem
    Trend Sniper X
    Sarvarbek Abduvoxobov
    4.86 (43)
    Trend Sniper X é um indicador de acompanhamento de tendência para múltiplos tempos gráficos no MetaTrader 5 que ajuda os traders a identificar a direção da tendência e potenciais pontos de reversão com clareza e precisão. para MT4: https://www.mql5.com/en/market/product/193245 Informações sobre o preço: O preço atual é promocional e está sujeito a alterações à medida que novas atualizações e funcionalidades forem lançadas. Oferta Bônus: Para obter o Auto-Trade Assistant EA GRATUITO para este in
    Em 2019, mostrei ao mundo inteiro do que este indicador é capaz. Operei os sinais dele manualmente, em uma conta real, às claras — a conta era monitorada no Myfxbook, e eu relatava o meu experimento em detalhes no Facebook. Resultado: 10.000 dólares se transformaram em 941.411 em quatro meses. O risco foi deliberadamente extremo — o drawdown chegou a 54%, afinal, na nossa profissão, lucro e risco sempre andam de mãos dadas. A captura de tela do Myfxbook é a primeira imagem da galeria. Parece que
    O ULTRA é um indicador técnico que funciona numa base «tudo-em-um» — analisa o mercado de forma independente, gera sinais de negociação, apresenta níveis para definir ordens de stop-loss e sugere quando encerrar as negociações para garantir lucros ou minimizar perdas. Por outras palavras, não importa se não sabe analisar o mercado, determinar níveis — onde definir o seu stop-loss — ou se tem dificuldades com a gestão do capital. O ULTRA fará tudo isso por si! BÓNUS PARA O COMPRADOR: Após adquiri
    Gann Made Easy   é um sistema de negociação Forex profissional e fácil de usar, baseado nos melhores princípios de negociação usando a teoria do sr. W. D. Gann. O indicador fornece sinais precisos de COMPRA e VENDA, incluindo níveis de Stop Loss e Take Profit. Você pode negociar mesmo em movimento usando notificações PUSH. Entre em contato comigo após a compra para receber instruções de negociação e ótimos indicadores extras gratuitamente! Provavelmente você já ouviu muitas vezes sobre os método
    M1 Sniper MT5
    Oleg Rodin
    5 (7)
    O   M1 SNIPER   é um sistema indicador de negociação fácil de usar. É um indicador de seta projetado para o período M1. O indicador pode ser usado como um sistema independente para scalping no período M1 e pode ser usado como parte do seu sistema de negociação existente. Embora este sistema de negociação tenha sido projetado especificamente para negociação no M1, ele também pode ser usado em outros períodos. Originalmente, desenvolvi este método para negociar XAUUSD e BTCUSD. Mas considero-o úti
    Boba Analysis Suite
    Trade Ready Solutions LLC
    5 (2)
    Boba Analysis Suite O Boba Analysis Suite é um indicador de análise para o MetaTrader 5. Reúne a estrutura do mercado, as zonas de preço relevantes e o contexto geral do mercado numa única visualização do gráfico. Desenvolvido a partir da experiência prática como trader e formador de traders, apoia um processo de análise estruturado: avaliar a direção do mercado, identificar níveis importantes e analisar vários períodos gráficos em conjunto. Análise em contexto O significado de cada sinal depend
    Indicador multimoedas de força e momentum MT5 Dynamic Forex28 Navigator é a evolução dos nossos indicadores populares de longa data e reúne a potência de três ferramentas numa só: Advanced Currency Strength28 Indicator (700 avaliações) Advanced Currency IMPULSE with ALERT (530 avaliações) CS28 Combo Signals (bónus atual) Os dois indicadores anteriores somam mais de 1.200 avaliações no MQL5 Market e são uma referência na comunidade MT4 desde 2016. O Dynamic Forex28 Navigator MT5 continua com a me
    Zain Gold Scalping
    Ahmed Gamal Abdel Nasser Mohamed
    A complete price-action analysis tool built around dual independent entry logic, each confirmed against a volatility band, combined with a configurable set of nine optional confirmation filters that let you shape exactly how conservative or aggressive the tool's signals behave. Core Strategy Two independent entry setups, each triggering only when price moves outside a dynamic volatility band — giving two distinct ways to spot potential reversal points, which can be used together or separately.
    Quantum TrendPulse
    Bogdan Ion Puscasu
    5 (26)
    Apresentando   Quantum TrendPulse   , a ferramenta de negociação definitiva que combina o poder do   SuperTrend   ,   RSI   e   Stochastic   em um indicador abrangente para maximizar seu potencial de negociação. Projetado para traders que buscam precisão e eficiência, este indicador ajuda você a identificar tendências de mercado, mudanças de momentum e pontos de entrada e saída ideais com confiança. Principais características: Integração SuperTrend:   siga facilmente a tendência predominante do
    Superhero
    Ihor Otkydach
    5 (3)
    O indicador SUPERHERO é um sistema de negociação multimoeda concebido numa base «tudo incluído». O indicador analisa o mercado de forma independente e fornece sinais sobre quando abrir e encerrar posições. Utiliza ordens Stop Loss e Take Profit. O rácio R:R é de 1:1. Este sistema pode enviar notificações push para o seu smartphone, para que possa realizar transações «em qualquer lugar», sem precisar de estar preso a um computador. É perfeito para empresas de negociação por conta própria. UM BÓNU
    Neuro Poseidon MT5
    Daria Rezueva
    4.75 (52)
    Neuro Poseidon is a new indicator by Daria Rezueva. It combines precise trading signals with adaptive TP/SL levels - creating best possible trades as a result! Message me and get  Neuro Poseidon Assistant  as a gift to automize your trading process! What makes it stand out? 1. Proven profitability on all assets and timeframes 2. Only confirmed BUY and SELL signals present on the chart 3. Adaptive TP & SL levels generated by the software for each trade 4. Easy to understand - suitable for al
    Azimuth Pro
    Ottaviano De Cicco
    5 (7)
    Azimuth Pro V2: Estrutura Fractal Sintética e Entradas Confirmadas para MT5 Visão geral Azimuth Pro é um indicador de estrutura swing multinível da Merkava Labs . Quatro camadas de swing aninhadas, VWAP ancorado em swings, detecção de padrões ABC, filtragem estrutural de três timeframes e entradas confirmadas em barra fechada — um gráfico, um fluxo de trabalho dos micro-swings aos macro-ciclos. Este não é um produto de sinais cegos. É um fluxo de trabalho baseado em estrutura para traders que v
    OrderFlux – Indicador de Footprint de Order Flow, Volume Profile e Market Profile para MetaTrader 5 O OrderFlux é um indicador de footprint de order flow para MetaTrader 5 que se explica por si próprio. Abre cada vela individual e mostra o que acontece no seu interior: o volume negociado em cada nível de preço, dividido entre compradores agressivos e vendedores agressivos. A partir dos ticks, constrói em tempo real um gráfico de footprint completo com delta, desequilíbrios, absorção, volume prof
    CGE Trading Suite
    Carl Gustav Johan Ekstrom
    5 (3)
    Institutional-Grade Analytics for MT5 The full analytical edge of a professional trading desk, built into your MT5 chart. A full guided tour walks you through every feature step by step. Standard retail platforms lack the depth required for professional market analysis. The CGE Trading Suite bridges this gap, transforming MetaTrader 5 into a comprehensive workspace. By integrating 18 proprietary modules into a single, unified chart interface, the suite eliminates fragmented analysis. It provide
    O Scalper Vault é um sistema de negociação poderoso e completo, projetado para traders que buscam consistência em operações intraday. Este indicador de alta precisão funciona como um sistema de negociação autônomo, oferecendo análises de nível institucional tanto para o mercado Forex quanto para Opções Binárias. ENTRE EM CONTATO COMIGO APÓS A COMPRA PARA RECEBER DICAS DE NEGOCIAÇÃO E UM BÔNUS EXCLUSIVO! Ao eliminar suposições e análises manuais complexas, o Scalper Vault permite que você foque
    Divergence Bomber
    Ihor Otkydach
    4.89 (94)
    Cada comprador deste indicador recebe adicionalmente, e de forma gratuita: A ferramenta exclusiva "Bomber Utility", que acompanha automaticamente cada operação, define os níveis de Stop Loss e Take Profit e fecha operações de acordo com as regras da estratégia; Arquivos de configuração (set files) para ajustar o indicador em diferentes ativos; Set files para configurar o Bomber Utility nos modos: "Risco Mínimo", "Risco Balanceado" e "Estratégia de Espera"; Um vídeo tutorial passo a passo que a
    FX Analysis is an all-in-one MT5 indicator dashboard that combines eight analytical tools in a single panel, helping traders identify high-probability setups without switching between charts or indicators. Designed for standard forex pairs on MetaTrader 5. Best results on M15 - H4 timeframes when all components are used together as part of the included workflow. Components Volatility Analyzer Displays historical average movement by hour and by day of the week. A real-time Pip Balance shows the
    PainX GainX Blue Spike Fusion AI Synthetic Index Spike Analysis Indicator for MetaTrader 5 Overview PainX GainX Blue Spike Fusion AI is a technical analysis indicator for MetaTrader 5, designed to help traders monitor potential spike setups on compatible synthetic indices. The indicator combines signal monitoring, market-condition analysis, chart markers, notifications, and an on-chart information panel. It presents relevant market information in an organized format to help traders evaluate pote
    Olá, traders! A maioria dos traders de retalho depende de scripts web lentos. Para operar com verdadeira rentabilidade, é necessário um framework institucionalizado. O indicador Astro AI não é uma sobreposição gráfica padrão. Trata-se de uma rede neural compilada contendo dois agentes que são executados diretamente no seu terminal. Eis a tecnologia específica por trás do sistema: 1. Agente 1: Analista (Rede Neural Gráfica - GNN) Os mercados não são barras de preço isoladas; são redes de dad
    ARIPoint
    Temirlan Kdyrkhan
    1 (4)
    ARIPoint is a powerful trading companion designed to generate high-probability entry signals with dynamic TP/SL/DP levels based on volatility. Built-in performance tracking shows win/loss stats, PP1/PP2 hits, and success rates all updated live. Key Features: Buy/Sell signals with adaptive volatility bands Real-time TP/SL/DP levels based on ATR Built-in MA Filter with optional ATR/StdDev volatility Performance stats panel (Success, Profit/Loss, PP1/PP2) Alerts via popup, sound, push, or email Cu
    A Melhor Solução para qualquer Trader Novato ou Experiente! Este Indicador é uma ferramenta de trading única, de alta qualidade e acessível, porque incorporámos várias funcionalidades proprietárias e uma nova fórmula. Com apenas UM gráfico você consegue ler a Força das Moedas de 28 pares de Forex! Imagine como o seu trading vai melhorar porque consegue identificar o ponto de trigger exato de uma nova tendência ou de uma oportunidade de scalping? Manual do utilizador: clique aqui Procura a versão
    KURAMA GOLD SIGNAL PRO (MT5) — Filtro de 7 camadas · TP/SL automático · Pontuação de qualidade · Salvamento do histórico de sinais | Sistema completo de trading para XAUUSD Sem repintura em tempo real. No instante em que um sinal aparece, a seta, a entrada, o TP e o SL ficam travados no lugar e nunca mais se movem. O que você opera é esse sinal em tempo real. E na v7.20, cada sinal realmente enviado é salvo automaticamente e restaurado com exatidão após reiniciar. BÔNUS PARA
    Advanced Supply Demand MT5
    Bernhard Schweigert
    4.53 (15)
    Atualmente com 33% de desconto! A melhor solução para qualquer Trader Novato ou especialista! Este indicador é uma ferramenta de negociação exclusiva, de alta qualidade e acessível porque incorporamos uma série de recursos proprietários e uma nova fórmula. Com esta atualização, você poderá mostrar fusos horários duplos. Você não só será capaz de mostrar um TF mais alto, mas também mostrar ambos, o TF do gráfico, MAIS o TF mais alto: MOSTRANDO ZONAS ANINHADAS. Todos os traders de Oferta e Demanda
    O   SR Liquidity   é um indicador de trading projetado para revelar as zonas ocultas onde a liquidez do mercado se concentra e o preço reage com maior intensidade. Essas áreas específicas de liquidez funcionam como níveis poderosos de suporte e resistência, oferecendo um mapa claro de onde é mais provável que o mercado reverta. Em vez de traçar linhas comuns de Suporte e Resistência, o SR Liquidity analisa o comportamento real dos preços para detectar as zonas onde se acumulam pressões de compra
    Apresentando       Quantum Breakout PRO   , o inovador Indicador MQL5 que está transformando a maneira como você negocia Breakout Zones! Desenvolvido por uma equipe de traders experientes com experiência comercial de mais de 13 anos,       Quantum Breakout PRO       foi projetado para impulsionar sua jornada comercial a novos patamares com sua estratégia de zona de fuga inovadora e dinâmica. O Quantum Breakout Indicator lhe dará setas de sinal em zonas de breakout com 5 zonas-alvo de lucro e su
    Volatility Master for MetaTrader is a real-time dashboard tool that scans up to  50 symbols  to identify high-volatility , trending markets instantly. With bullish/bearish signals, customizable alerts, and a user-friendly interface, it helps you avoid range-bound conditions and focus on high-probability trades. Clarity leads to confidence. Trade confidently and protect your capital effectively with this powerful dashboard. We don't offer free or bonus indicators in exchange of reviews from you.
    Graded Liquidity Sweep
    Kaustubh Pradeep Deshmukh
    This indicator marks the candles where price runs through a liquidity level and turns back. It finds and ranks the levels by itself, so there is nothing to draw by hand. It is made for manual trading on any symbol and timeframe. What you see on the chart A buy or sell arrow on the candle that confirms the reversal. Arrows appear only after that candle has closed, and they do not repaint. For every signal: the level that was swept, a stop level and two target levels. A label with the type of leve
    Btmm state engine pro
    Garry James Goodchild
    5 (4)
    BTMM State Engine Pro by G-Labs — Beat The Market Maker indicator for MetaTrader 5. Asian session range, London and New York kill zones, level progression (L1/L2/L3), peak formation detection (PFH/PFL), entry signals, and a multi-pair scanner from one chart. Stop scanning charts one pair at a time. The State Engine tracks the BTMM daily cycle automatically — Asian box, room boundaries, level blocks, peak formations, and filtered entries — while the scanner dashboard shows level, peak status, d
    RelicusRoad Pro MT5
    Relicus LLC
    4.96 (25)
    Pare de chutar suas operações. Saiba quando entrar, onde sair e para que lado o mercado está pendendo, tudo em um único gráfico. O RelicusRoad Pro reúne quase vinte ferramentas em um só indicador, e você liga apenas as que combinam com o seu jeito de operar. Entradas claras. Saídas claras. Um plano em cada gráfico. Parece familiar? Você compra, e o preço vira contra você um minuto depois. Você fecha cedo demais e depois vê o movimento continuar sem você. Cinco indicadores no gráfico, cinco respo
    O UZFX {SSS} Scalping Smart Signals v5.0 MT5 é um indicador de negociação de alto desempenho, sem repintura, concebido para scalpers, day traders e swing traders que exigem sinais precisos e em tempo real em mercados em rápida evolução. Desenvolvido pela (UZFX-LABS), este indicador combina a análise da ação do preço, a confirmação de tendências e a filtragem inteligente para gerar sinais de compra e venda de alta probabilidade, sinais de alerta e oportunidades de continuação de tendências em tod
    Mais do autor
    IPDA and PD Ranges MT4
    Thank-god Avwerosuoghene Odukudu
    5 (1)
    IPDA AND PD RANGES. Interbank Price Delivery Algorithm (IPDA) Range Liquidity and trades in the FX market take place in a decentralized manner as banks, brokers and electronic communication networks (ECNs) interact with one another to set prices. In FX, and ECN is a trading platform or electronic broker that hosts bids and offers and transmit them to users worldwide. ECN broadcasts a price around the world as various participants leave orders to buy and sell. Banks provide streaming prices based
    CiSD MT4
    Thank-god Avwerosuoghene Odukudu
    CiSD | Change in State Delivery See exactly where price delivery changes direction. CiSD automatically detects Change in State Delivery and plots the critical price associated with the shift - giving ICT/SMC traders a precise reference level without manually searching through candle sequences. DETECT → MARK → CONFIRM → ANALYZE Figure 1: See the exact level where the delivery state changes. CiSD is designed for traders who use liquidity, displacement, market structure, FVGs/Imbalances and premi
    IPDA and PD Ranges
    Thank-god Avwerosuoghene Odukudu
    IPDA AND PD RANGES. Interbank Price Delivery Algorithm (IPDA) Range Liquidity and trades in the FX market take place in a decentralized manner as banks, brokers and electronic communication networks (ECNs) interact with one another to set prices. In FX, and ECN is a trading platform or electronic broker that hosts bids and offers and transmit them to users worldwide. ECN broadcasts a price around the world as various participants leave orders to buy and sell. Banks provide streaming prices base
    Filtro:
    刘华钦
    36
    刘华钦 2026.01.10 13:23 

    O usuário não deixou nenhum comentário para sua avaliação

    Thank-god Avwerosuoghene Odukudu
    3963
    Resposta do desenvolvedor Thank-god Avwerosuoghene Odukudu 2026.01.10 14:28
    Hi there! Thank you for downloading the indicator.
    ​This tool is designed to represent complex concepts taught by InnerCircleTrader (ICT). If you are familiar with concepts such as PD Arrays and Liquidity Runs, you can use the indicator for additional confirmation. If you are not familiar with ICT, you can simply use it to identify a change in delivery once the price reaches your desired buy or sell levels.
    ​Please let me know if you are an ICT student or if you notice the indicator producing a signal that differs from what is shown in the videos.
    ​Regards,
    IKnow.
    Responder ao comentário