CiSD

CiSD | Change in State Delivery

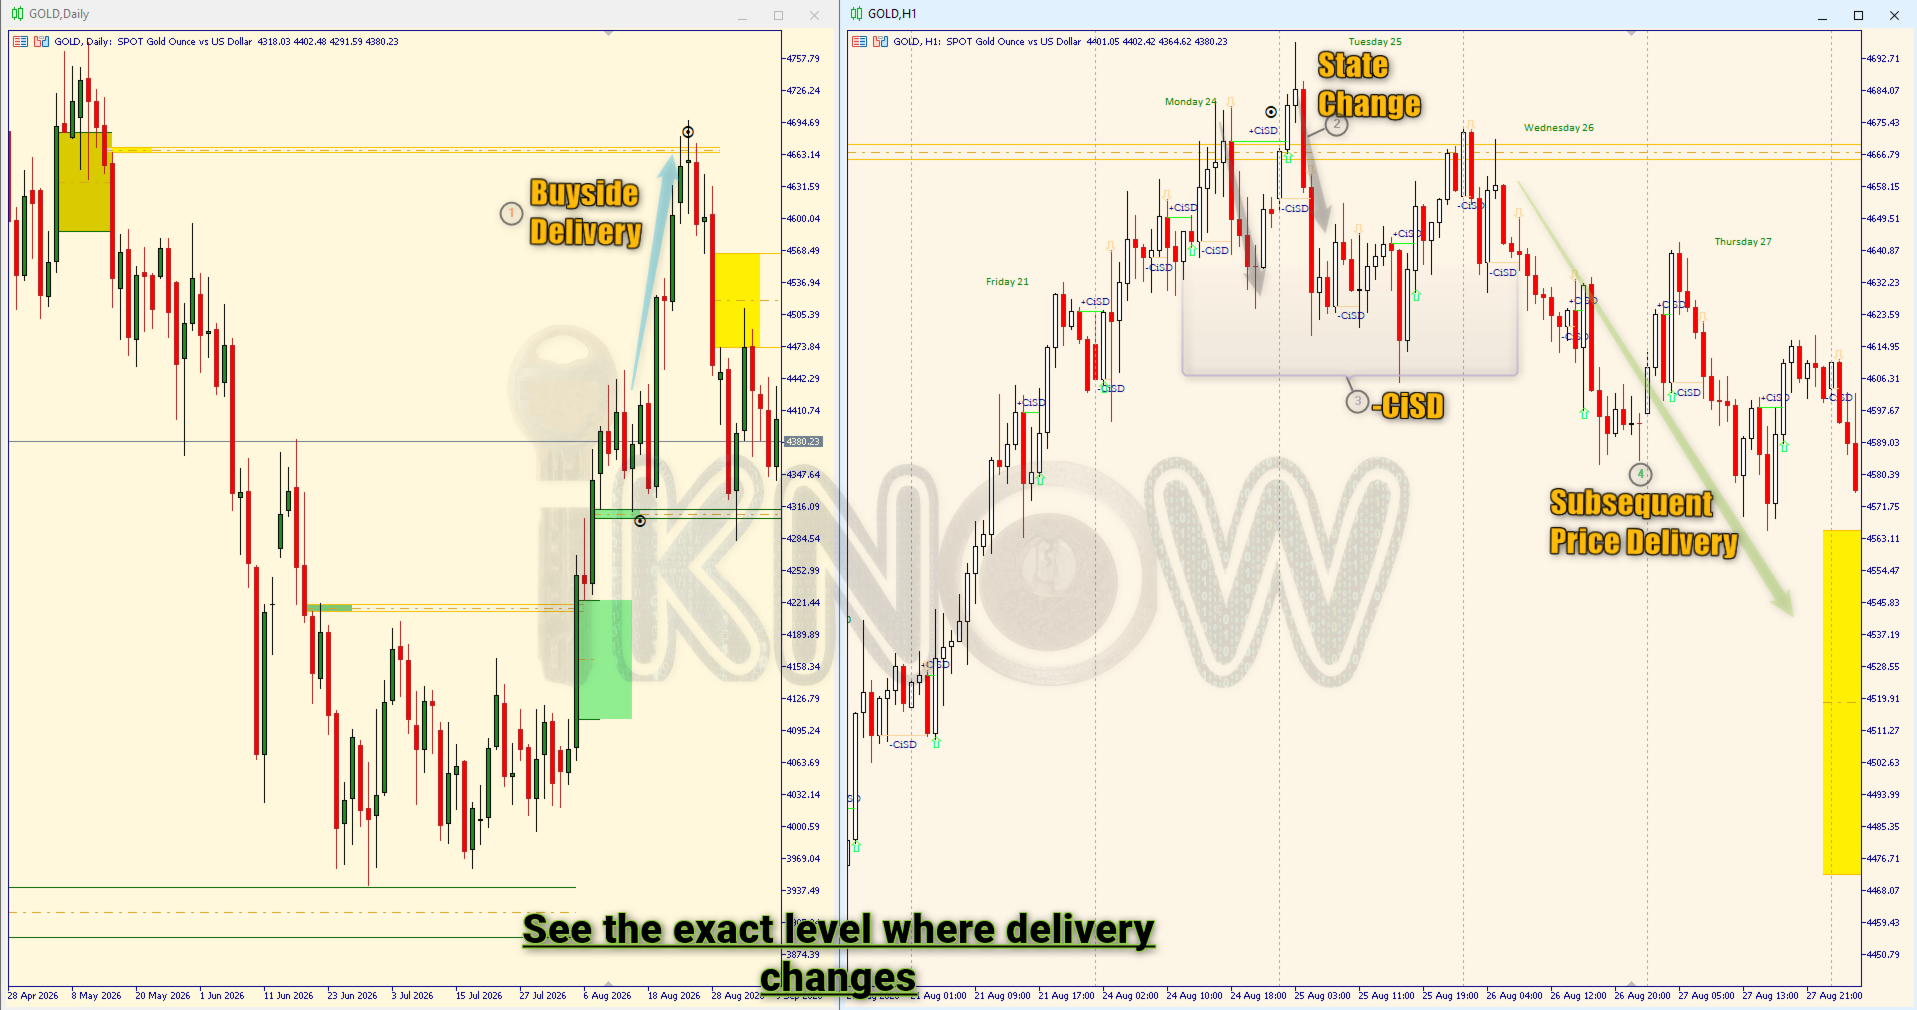
See exactly where price delivery changes direction.

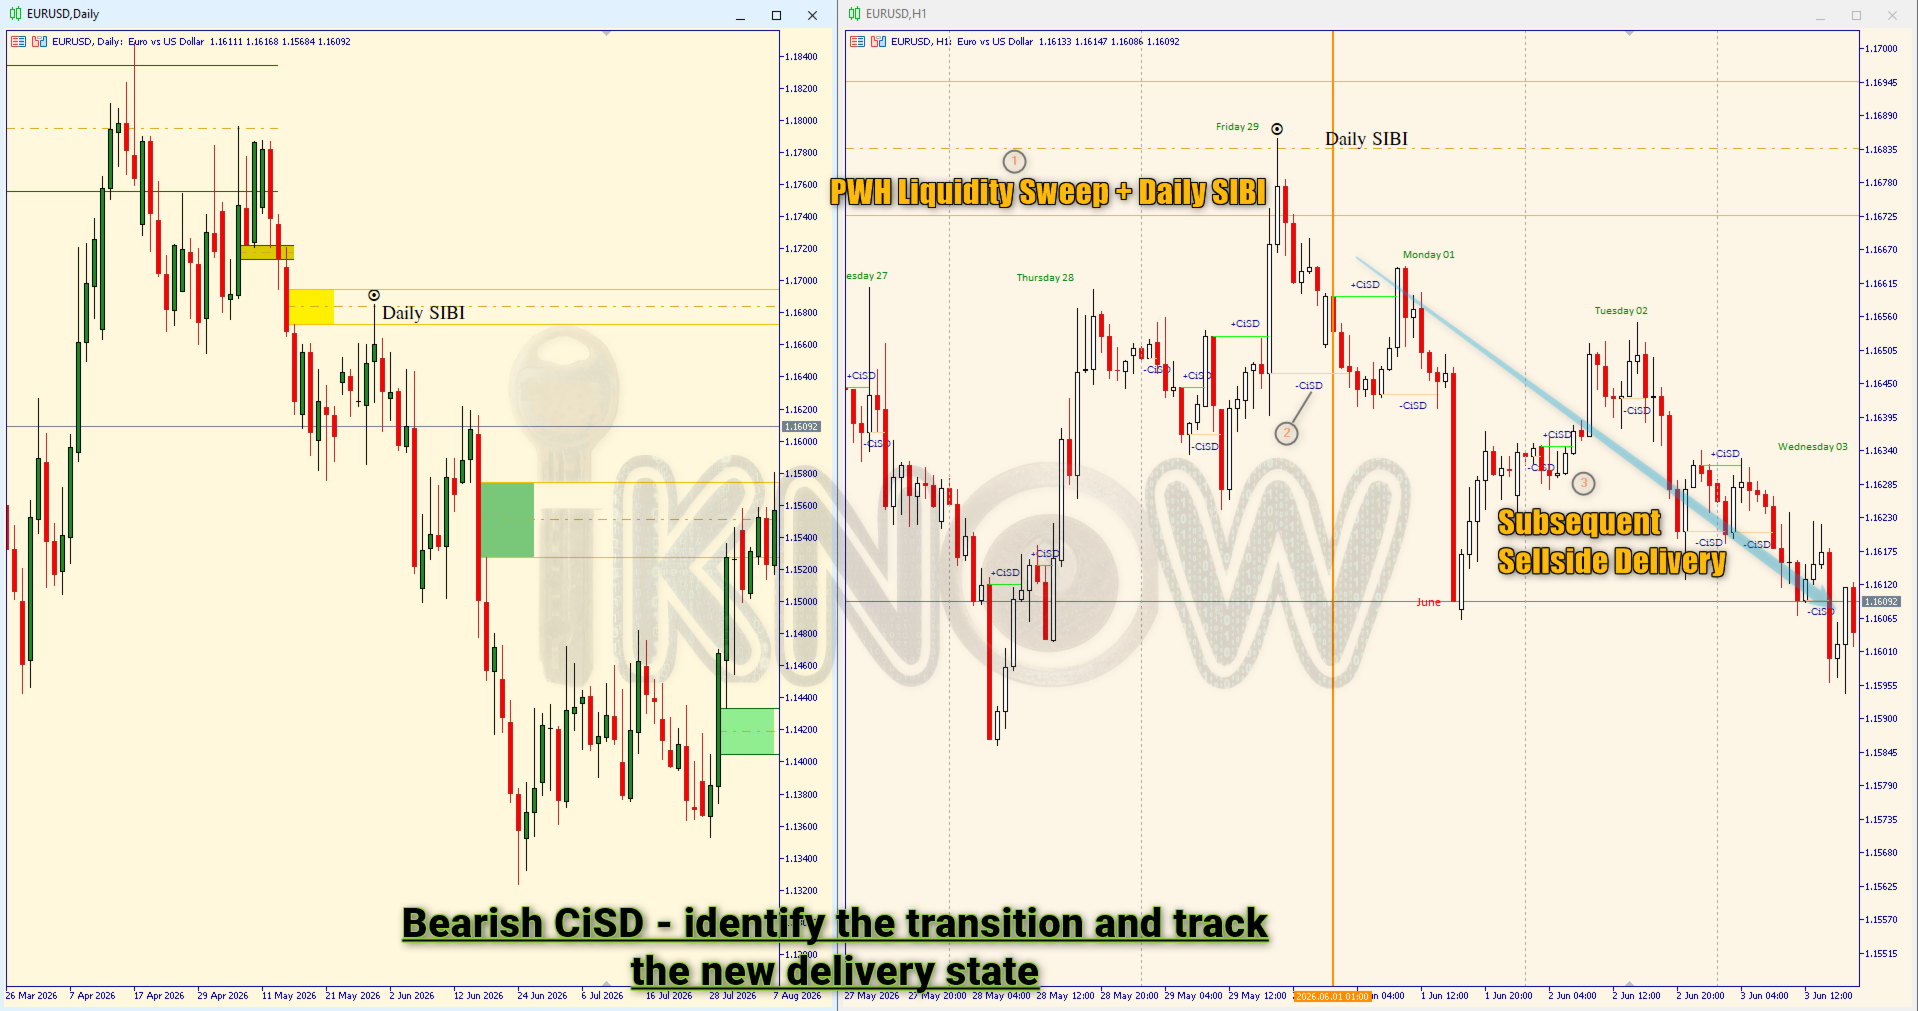
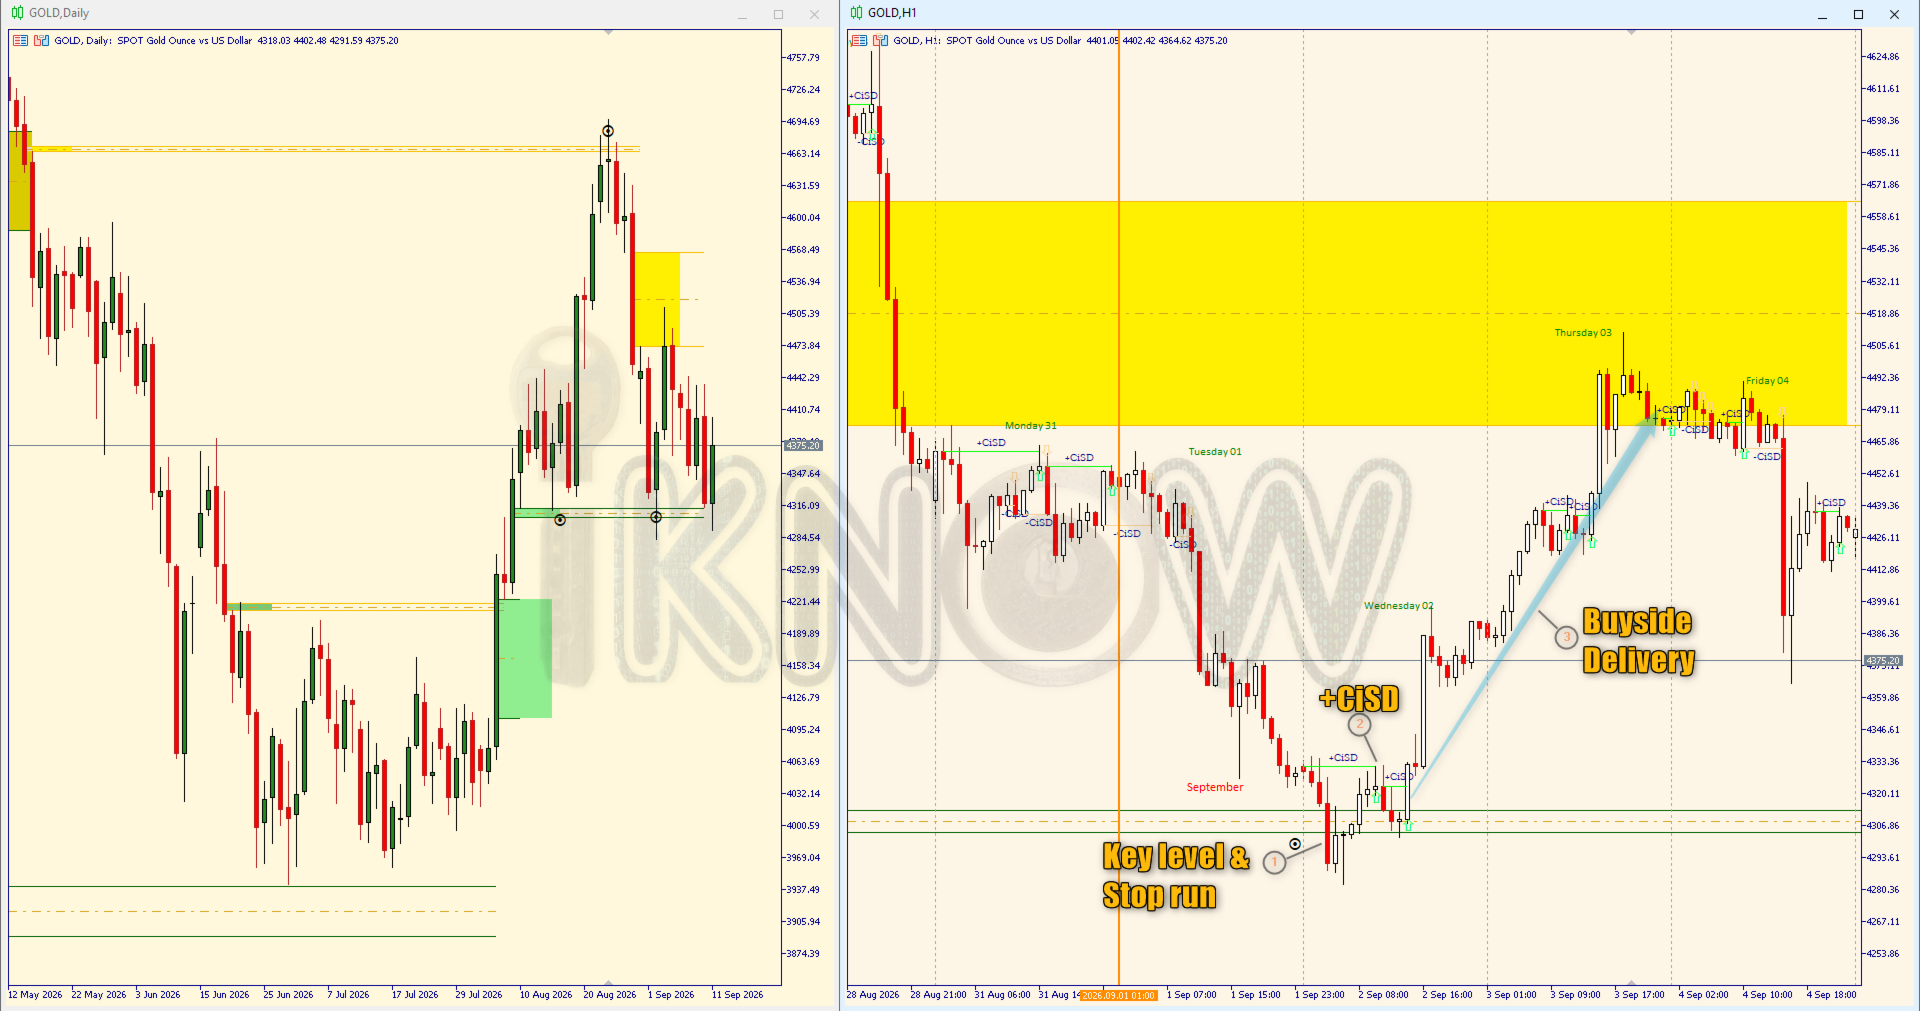
CiSD automatically detects Change in State Delivery and plots the critical price associated with the shift - giving ICT/SMC traders a precise reference level without manually searching through candle sequences.

DETECT → MARK → CONFIRM → ANALYZE

Figure 1: See the exact level where the delivery state changes.

CiSD is designed for traders who use liquidity, displacement, market structure, FVGs/Imbalances and premium/discount Arrays as part of their analysis.

Instead of manually identifying every delivery-state transition and marking the originating price, CiSD does the repetitive chart work for you.

The objective isn't to give you another buy/sell arrow. It's to show you the level where the delivery state changed.

What CiSD Gives You

🎯 Precise CiSD Levels

Automatically identifies and plots the relevant opening price associated with the Change in State Delivery.

↔ Bullish & Bearish State Changes.

Clearly distinguish transitions toward bullish or bearish delivery.

📍 Persistent Chart Reference

Keep the CiSD levels visible so you can study subsequent price action around the originating level.

📚 Historical Analysis

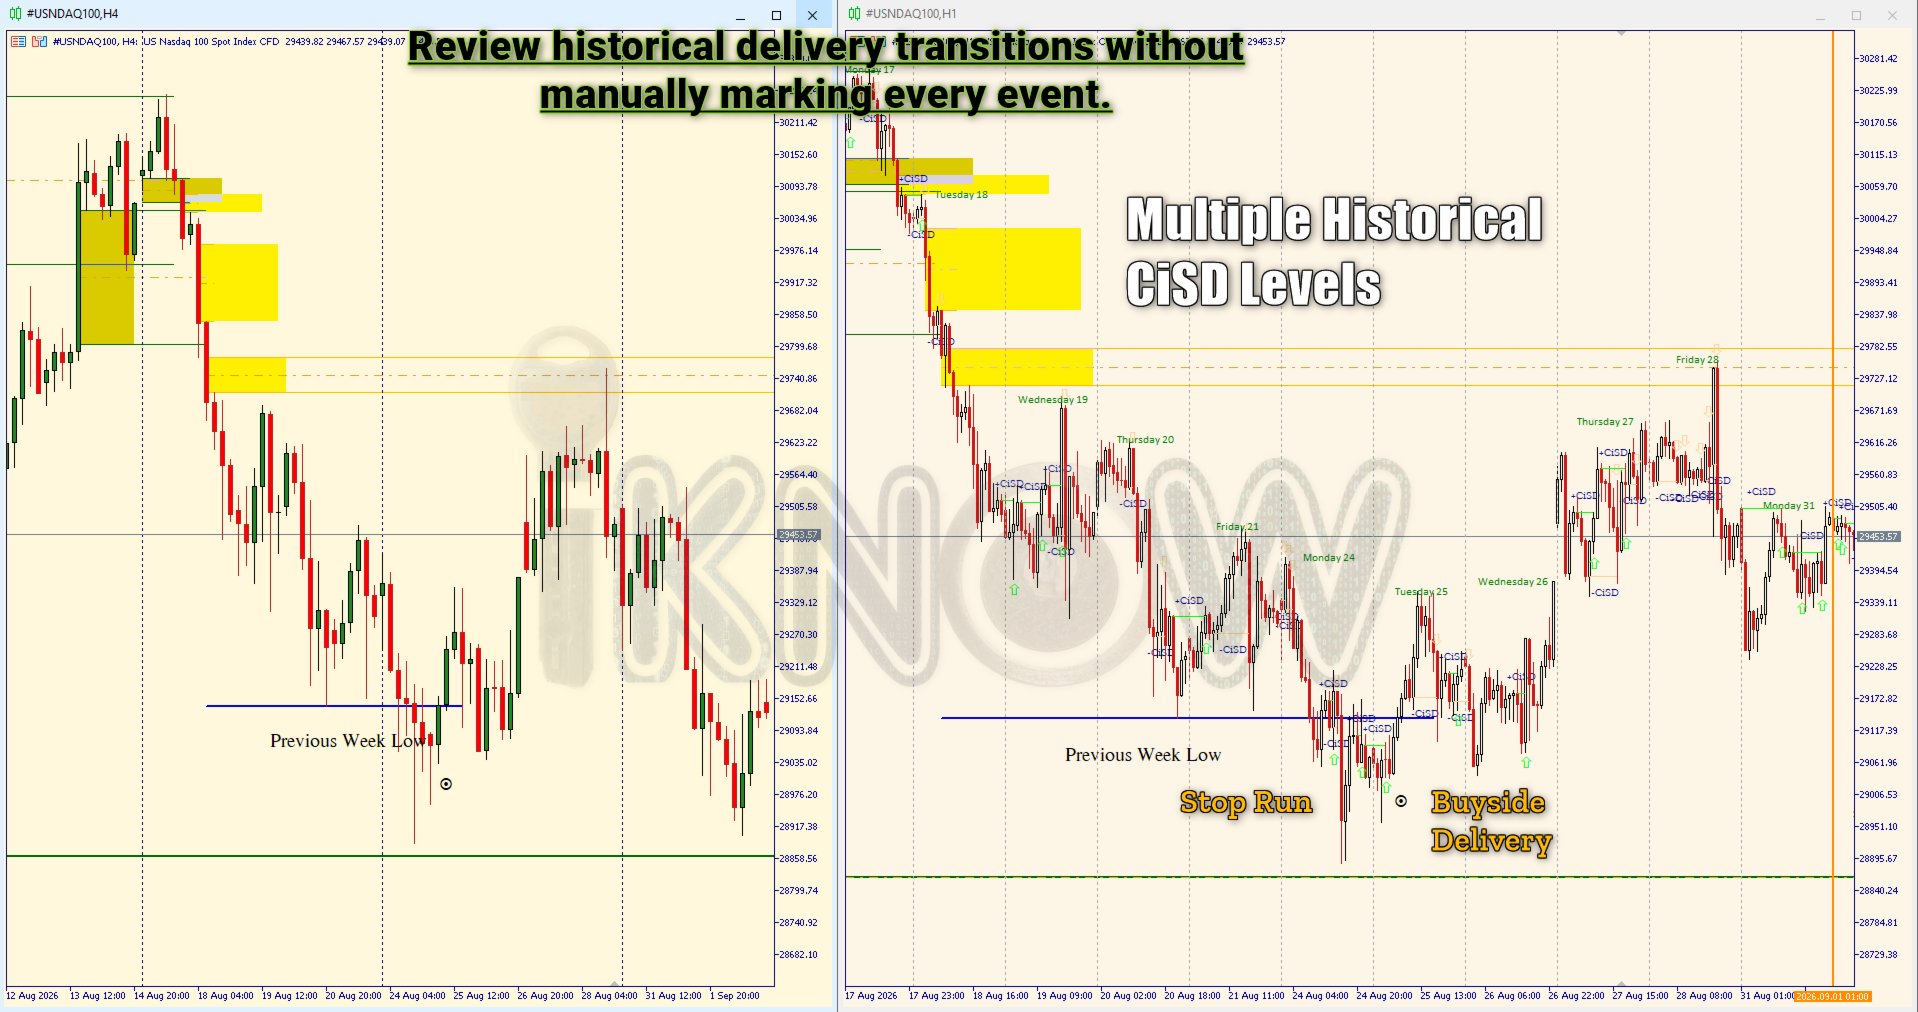
Review previous CiSD events directly on the chart instead of manually reconstructing historical examples.

🤖 Automated Detection

Continuously monitor price action for qualifying CiSD events while you focus on market interpretation.

⏱ Time-Saving Workflow

Reduce repetitive chart marking and focus your attention on context, confirmation and execution.


How It Works

01

Price Delivers

Price is delivering toward liquidity or inefficiency in one direction.

02

Delivery Changes

Price action satisfies the conditions defining a Change in State Delivery.

03

CiSD Is Identified

The indicator identifies the corresponding delivery transition.

04

Level Is Plotted.

The associated opening price is displayed directly on the chart

05

You Analyze the Context

Evaluate Continuation, Retracement, Liquidity targets, FVG/Imbalance interaction, Structure and invalidation.


How It Works

Why Traders Use CiSD

Manual CiSD analysis can require repeatedly:
Watch candles → identify the transition → located the correct candle →find its opening price → monitor price → repeat.
CiSD automates that repetitive process.

Instead of asking:

"Where exactly did the delivery change?"

You can immediately see:

"This is the CiSD level. Now what is price doing around it?"

That makes the tool useful for both live analysis and historical chart study.


Manual analysis vs. CiSD Automation?

Spend less time maintaining your chart and more time interpreting price action — no more drawing lines and second-guessing whether a true state change occurred.

Manual Process

  1. Watch candle sequences continuously.
  2. Identify delivery state transition
  3. Locate the specific initiating candle
  4. Manually draw line at opening price
  5. Monitor interaction and repeat

The CiSD Workflow

  1. Monitor: Indicator tracks algorithm behaviour
  2. Detect: Instant shift identification
  3. Mark:Automatic level plotting
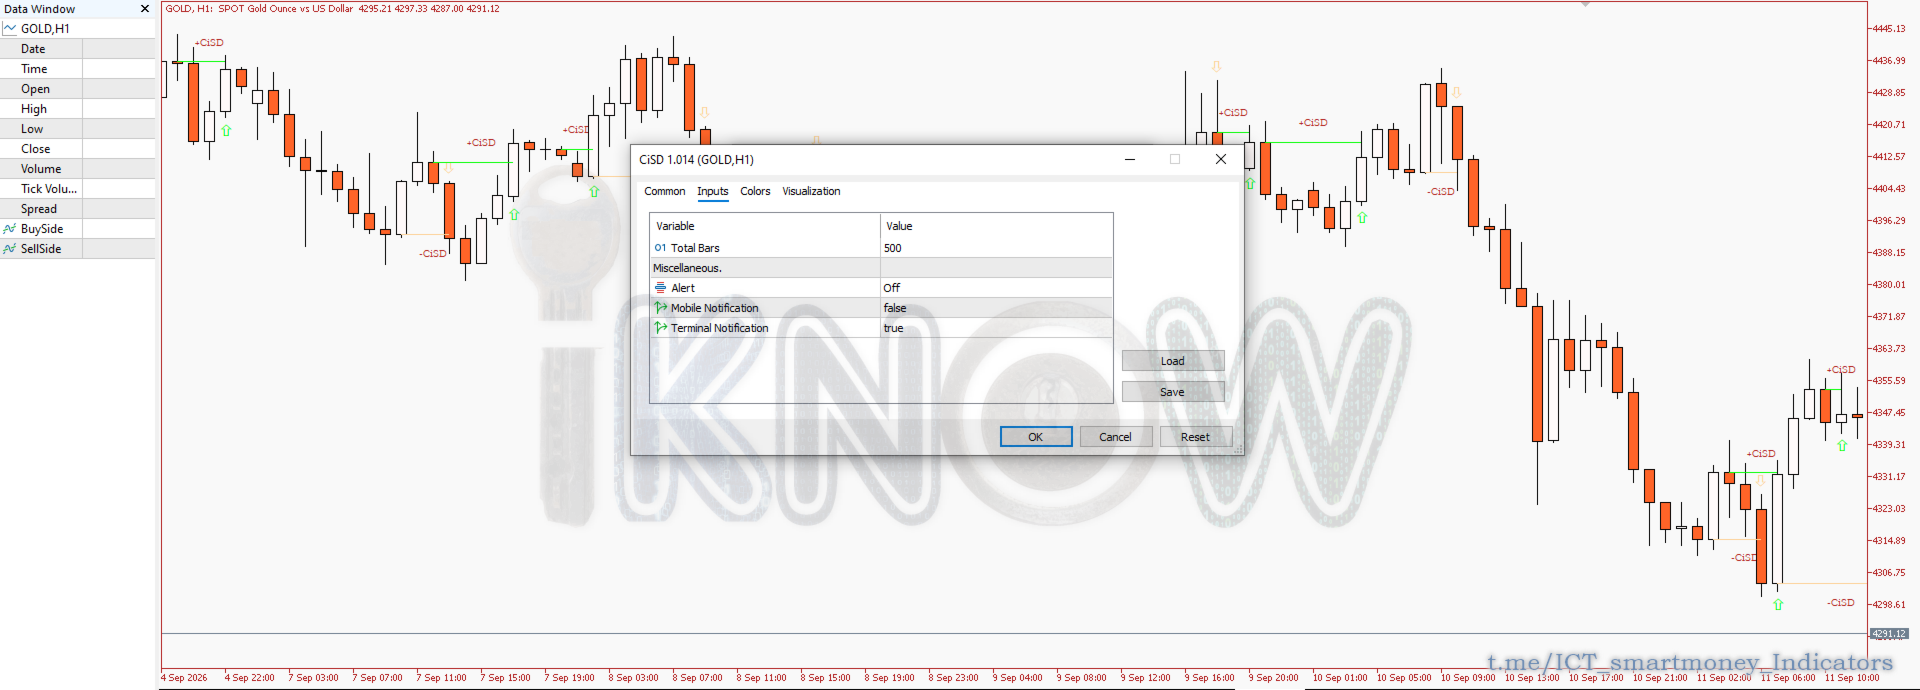
  4. Alert: Terminal & mobile notifications
  5. Analyze: Focus purely on trade execution

How to Trade with CiSD Levels

  1. Price Delivers: Price moves toward liquidity in a single direction.
  2. State Shifts: Candle conditions satisfy a CiSD transition.
  3. Level Plotted: The exact opening price level is locked onto the chart.
  4. Execution Analysis: Evaluate price action around the level for continuation setups, retracement entries, or invalidation.

Built for Traders who Already Understand the Framework

CiSD is intended for traders already familiar with concepts such as:

Change in State Delivery Buyside/Sellside Liquidity Displacement PD Arrays Fair Value Gaps/Imbalance. Market Structure Liquidity Sweeps

Already familiar with CiSD?

Go directly to the demo and verify the indicator's output on your own charts.

New to CiSD?

Learn the underlying ICT concept first. The indicator is an analysis tool, not a substitute for understanding the methodology.

CiSD does not replace your model - it adds the missing timing trigger.


Understanding Change in State Delivery

The Change in State delivery (CiSD) is a microstructure indicator that identifies critical pivotal points where the market (Price delivery Algorithm) shifts its directional focus from seeking liquidity on one side of the market to the other. Specifically, it signals a transition from buyside-driven liquidity to sellside-driven liquidity. CiSD marks the precise opening price that signals  a fundamental change in market structure and delivery direction.

What is State Delivery?

State delivery refers to the Market algorithm's active pursuit of liquidity pools and price inefficiencies. The market operates in two distinct delivery states:

  • Bullish State Delivery: Actively seeking Buyside liquidity (buystops, sell limits above highs) and premium inefficiencies.
  • Bearish State Delivery: Actively seeking Sellside Liquidity (sellstops, buy limits below lows) and discount inefficiencies.

What is a Change in State Delivery (CiSD)?

A CiSD occurs when price transitions from one delivery directive to the opposite:

  • Bullish to Bearish: Price stops seeking buyside liquidity and pivots to target sellside liquidity.
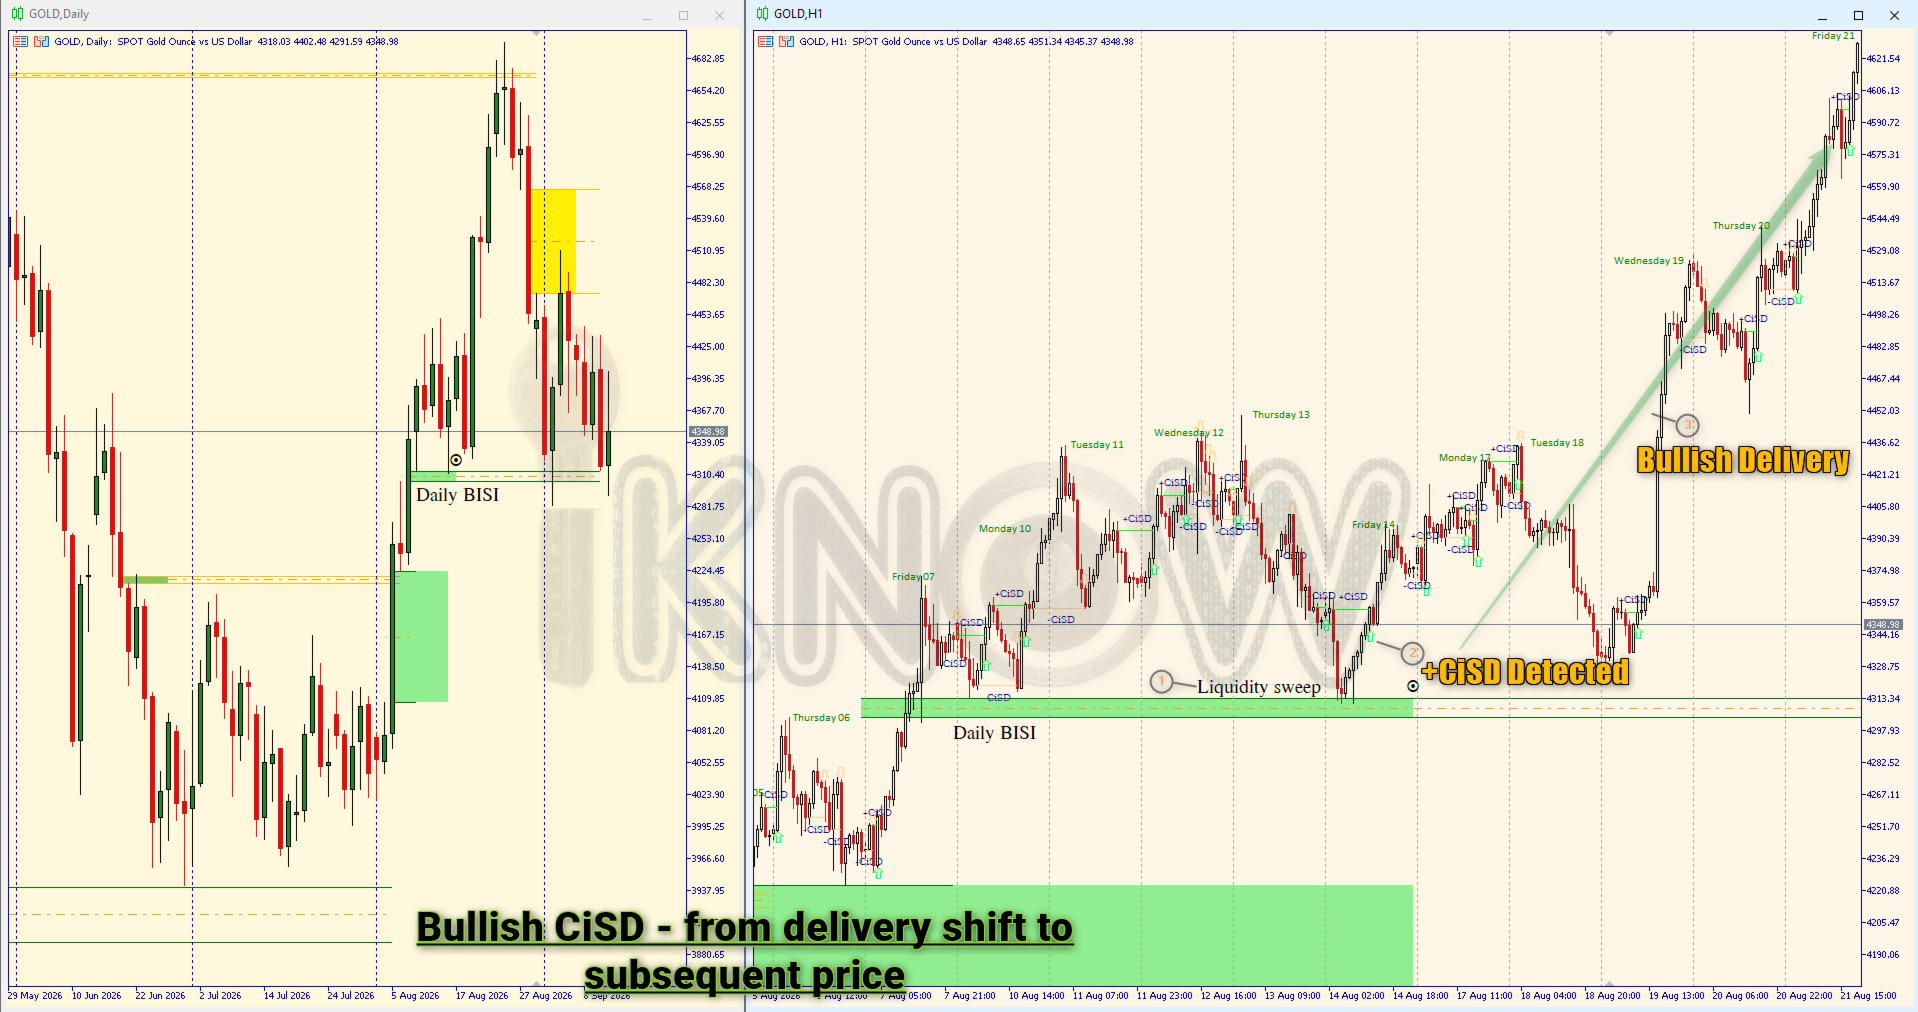
  • Bearish to Bullish: Price stops seeking sellside liquidity and pivots to target buyside liquidity.

The CiSD opening price is the specific candle open that initiates this directional shift. This level becomes a critical reference point as it marks where the market's intent changed, establishing a new delivery bias.


Key Components/Features

  1. CiSD Opening Price
  2. The opening price of the candle that triggers the change in state delivery. This price level acts as:

    • A pivot point for the new directional bias
    • A potential invalidation level for the current delivery state
    • A reference for measuring premium/discount zones

  3. Delivery Direction
  4. Once a CiSD is identified, the indicator determines the new market directive:

    • Bullish CiSD: Market now seeks premium inefficiencies and/or Buyside liquidity
    • Bearish CiSD: Market now seeks discount inefficiencies and/or Sellside liquidity

  5. Target Zones
  6. Based on the CiSD, the market will now pursue:

    • Premium Inefficiencies: Fair Value Gaps (FVG), imbalances, and unfilled orders above current price
    • Discount Inefficiencies: Fair Value Gaps (FVG), imbalances, and unfilled orders below current price
    • Liquidity Pools: Buyside (above) or Sellside (below) concentrations
    • Combination Targets: Both inefficiencies and liquidity on the same side

Features

The indicator displays:

  1. CiSD Level Line: Horizontal line at the opening price where state change occurred.
  2. Directional Arrow: Visual indicator showing new delivery direction.
  3. Color Coding:
    • -Bullish CiSD: Blue/Green tones
    • -Bearish CiSD: Red/Orange tones
  4. Label: Text showing "CiSD" with timestamp and price level

Pricing

Rent it to try CiSD in live market conditions, or buy once and keep it.

Monthly

$40
per month

Lower initial commitment for traders who want to test the product over a shorter period.

Best value

Lifetime

$100
one-time purchase

Own the current product permanently instead of paying a recurring monthly fee.

A free demo is available so you can verify the indicator's behaviour on your charts before purchasing.


Frequently Asked Questions

  • What is CiSD?
  • CiSD (Change in State Delivery) identifies a transition from one directional delivery state to the opposite state, according to the indicator's defined methodology.
  • How does CiSD work?
  • CiSD monitors price action for a change in delivery state. When the conditions are met, it marks the opening price of the candle that initiated the transition and indicates the new delivery direction.

  • Is CiSD a buy/sell signal?
  • No, CiSD is primarily a market-analysis reference. Evaluate a CiSD event alongside liquidity, market structure, displacement, FVGs/imbalance, and your own execution model.
  • Does CiSD predict reversals?
  • No. A CiSD identifies a change in delivery according to its rules. It does not guarantee that price will reverse or continue in a particular direction.
  • Can I use CiSD with ICT/SMC concepts?
  • Yes. It's designed to complement workflows involving liquidity, displacement, FVGs/imbalance, market structure, and PD arrays.
  • Can I use it for historical analysis?
  • Yes. You can display historical CiSD events so traders can study previous delivery transitions and subsequent price action.
  • Does it work on all timeframes?
  • Yes. CiSD is designed to work across all timeframes.
  • Does the indicator repaint?
  • No. The indicator does not repaint.
  • Which Markets does it work on?
  • CiSD works across various financial markets, including forex, stocks, and futures.
  • Which timeframes?
  • It works on all timeframes.
  • Can I use the demo before buying?
  • Yes. The demo lets you verify the indicator's behaviour on your own charts before purchasing.
  • I think the indicator generated an incorrect CiSD. What should I do?
  • Please provide the following:
    • Chart screenshot
    • Symbol
    • Timeframe
    • Date/Time
    • Relevant candles
    • Expected result
    • Methodology/Reference used

    This allows the result to be investigated properly.


    Glossary of Terms

    • Liquidity: Areas where large numbers of pending orders are concentrated (typically above/below key price levels).
    • Buyside Liquidity: Concentration of buy-stop orders above current price (targets for bearish moves).
    • Sellside Liquidity: Concentration of sell-stop orders below current price (targets for bullish moves).
    • State Delivery: The market's current directional focus in seeking liquidity pools.
    • Premium Zone: Price area above a reference level (generally considered "expensive").
    • Discount Zone: Price area below a reference level (generally considered "cheap").
    • Inefficiency: Price imbalances or gaps where one-directional order flow dominated, leaving unfilled orders.

    ⚠️ Risk Disclaimer

    This indicator is a tool for market analysis and does not guarantee trading profits. Past performance does not indicate future results. Trading forex, stocks, and other financial instruments involves significant risk of loss and is not suitable for all investors. Always use proper risk management and never risk more than you can afford to lose. You should carefully consider your investment objectives, level of experience, and risk appetite before making any trading decisions.
    Produits recommandés
    Heiken_Ashi_Bars - Visualiseur de Tendance Avancé pour MT5 Aperçu Heiken_Ashi_Bars est un indicateur personnalisé puissant et visuellement intuitif conçu pour filtrer le bruit du marché et mettre en évidence la véritable tendance sous-jacente. Les graphiques en chandeliers traditionnels peuvent souvent être erratiques. En calculant la moyenne des données de prix, cet indicateur lisse l'action des prix, ce qui permet de repérer beaucoup plus facilement les continuations de tendance, les inversion
    RBreaker
    Zhong Long Wu
    RBreaker Gold Indicators est une stratégie de trading intraday à court terme pour les contrats à terme sur l'or, qui combine deux approches : le suivi de tendance et le retournement intraday. Elle permet non seulement de capturer les profits dans les marchés en tendance, mais aussi de prendre des bénéfices en temps opportun lors des retournements de marché et d'ouvrir une position en sens inverse. Cette stratégie a été classée pendant 15 années consécutives parmi les dix stratégies de trading l
    Multi-Timeframe Heiken Ashi (Smoothed with Dashboard) Professional Market Structure Visualization with Weighted Confluence Scoring Transform your trading with crystal-clear multi-timeframe analysis. This indicator combines smoothed Heiken Ashi candles with an intelligent weighted scoring system to give you unprecedented clarity in any market condition. YOUR TRADING QUESTIONS – ANSWERED INSTANTLY: 1. What's the REAL trend direction? Dashboard Reveals:   Higher timeframe (MN1, W1, D1, H4) trend a
    Price Magnet — Price Density and Attraction Levels Indicator Price Magnet is a professional analytical tool designed to identify key support and resistance levels based on statistical Price Density. The indicator analyzes a specified historical period and detects price levels where the market spent the most time. These zones act as “magnets,” attracting price action or forming a structural base for potential reversals. Unlike traditional Volume Profile tools, Price Magnet focuses on price-time d
    Chỉ báo này sẽ thông báo cho bạn nếu cấu hình xu hướng thành công. Tín hiệu theo xu hướng không nên được tăng theo, nhưng tín hiệu mua ở mức giá thấp theo mô hình giao dịch thông thường của bạn, hoặc tín hiệu bán ở mức giá tốt, là một lựa chọn rất tốt. Hãy thiết lập nó trên khung thời gian lớn hơn và theo dõi các khung thời gian nhỏ hơn, bám sát các xu hướng chính. Tôi thường thiết lập ba khung thời gian gần nhau nhất và không bao giờ đi ngược tín hiệu của INdicator này. INdicator   này không có
    STRICTLY FOR BOOM INDEX ONLY!!!!! Here I bring the Maximum Trend Arrows OT1.0 MT5 indicator. This indicator is made up of a combination of different trend indicators for entries and exits, for entries an orange arrow will paint on the chart below the current market and a red flag for closing of trades and it produces buy arrows only. When the orange arrow appears, it will appear along with it's sound to notify you. The 1H timeframe is recommended, don't use it anywhere else than on the 1H timefr
    What Is Trend Master Pro? Trend Master Pro   is a professional-grade trend trading indicator built for MetaTrader 5. It was designed with one goal in mind — to keep you on the right side of the market at all times by combining three powerful technical tools into a single, clean, easy-to-read display directly on your price chart. Instead of cluttering your screen with multiple separate indicators, Trend Master Pro fuses an   EMA Ribbon trend filter , a   ZigZag swing point engine , and a   breako
    HAS RSI Signal — Indicateur de Tendance Professionnel avec Calcul SL/TP HAS RSI Signal est un outil de trading puissant combinant des classiques éprouvés et des algorithmes modernes de filtrage du bruit. L'indicateur analyse le marché à travers le prisme des bougies Heiken Ashi Smoothed (HAS) et de l'oscillateur RSI , offrant au trader des signaux d'entrée clairs lors des retournements de tendance ou des sorties de zones de surachat/survente. Principaux Avantages : Double Filtrage : L'utilisatio
    Structure King AI Signal Structure King AI Signal is a professional MetaTrader 5 trading indicator designed to help traders analyze market structure, trend direction, multi-timeframe confirmation and trade management from one clean dashboard. Key Features • Market Structure & Trend Analysis • BUY / SELL Signals • Multi-Timeframe (HTF) Confirmation • Entry Price Levels • Dynamic Stop Loss (SL) • TP1 / TP2 / TP3 Levels • ATR Volatility Analysis • ADX Trend Strength Filter • Adaptive Market Filter
    Footprint is an indicator for order flow and volume analysis. It helps identify market structure at the cluster level, find key zones with increased activity, and work with filters directly on the chart without constantly opening the settings window. Footprint Indicator Features cluster-based Bid x Ask and Delta charts; on-chart control panel; sliders for filter adjustments; Absorption; Initiative; Stacked Imbalances; Big Trades; dPOC / Dynamic Point of Control; Delta; side market profile; cumul
    Fabii Half Trend Baseline
    Fabien Georges Andre Guillemaud
    Cessez de trader contre la tendance du timeframe supérieur. Deux baselines, un graphique. No repaint. Toute paire, tout timeframe. Sur votre graphique en 2 minutes. Démo gratuite dans le Strategy Tester. Get more indicators here Baselines, volatility filters and oscillators. No repaint. Pourquoi vous en avez besoin Vous entrez en position parce qu'une ligne est passée au vert sur votre graphique. Puis vous ouvrez un timeframe supérieur et vous voyez que la tendance de fond va dans l'autre sen
    TradeAQ
    Guo Sheng Zhao
    LuoMo Volume & Price Structure 8.98 A multi-function chart indicator for   MetaTrader 4 and MetaTrader 5 , designed to display key volume, volatility, sentiment, and price-structure information directly on the main chart. Main Features Volume and price-based Support & Resistance Volume spike and exhaustion signals ATR volatility expansion alerts Volume Profile with HVN and LVN Bullish and bearish sentiment distribution Developing or fixed POC VAH and VAL levels Supply and Demand zones Volume-wei
    CosmiCLab SMC FIBO CosmiCLab SMC FIBO is a professional trading indicator designed for traders who use Smart Money Concepts (SMC), market structure analysis and Fibonacci retracement levels. The indicator automatically detects market swings and builds Fibonacci levels based on the latest impulse movement. It also identifies market structure changes such as BOS (Break of Structure) and CHOCH (Change of Character), helping traders understand the current market direction. CosmiCLab SMC FIBO also pr
    Heiken Ashi Smoothed Strategy is a very simple but powerful system to get forex market trend direction. This indicator is actually 2 indicators in 1 pack, Heiken Ashi and Heiken Ashi Smoothed Moving Average both included. Because HA (Heiken Ashi) and HAS (Heiken Ashi Smoothed) are calculated in the same one system event with necessary buffers and loop only, so it is the FAST, OPTIMIZED and EFFICIENT HA having the combined indicator of MetaTrader 5. You can choose to display HA and HAS in the sam
    Renko System
    Marco Montemari
    This indicator can be considered as a trading system. It offers a different view to see the currency pair: full timeless indicator, can be used for manual trading or for automatized trading with some expert advisor. When the price reaches a threshold a new block is created according to the set mode. The indicator beside the Renko bars, shows also 3 moving averages. Features renko mode median renko custom median renko 3 moving averages wicks datetime indicator for each block custom notification
    IC Flat Pro The True Math
    Aruncharan Ganapathy Sivakumar
    IC FLAT PRO – THE TRUE MATH   Early Adopter Pricing Secure IC FLAT PRO – THE TRUE MATH at the current launch price. Once the first 10 purchases  have been sold, the price will increase by USD 300 . Institutional-Grade Market Structure Analysis for MetaTrader 5 IC FLAT PRO – THE TRUE MATH is a premium institutional-grade market structure indicator developed for serious traders who demand precision, consistency, and high-quality trade opportunities. Built using advanced mathematical algorithms
    Smart Support And Resistance Indicator See the Market Levels That Matter. Make your chart clearer and your technical analysis more organized with Smart Support And Resistance Indicator — a powerful trading tool designed to help traders identify important support and resistance levels directly on their MetaTrader 5 charts. Whether you trade Forex, Gold, Indices, or other available markets, this indicator helps you focus on key price areas, monitor potential market reactions, and analyze price act
    NQX Smooth Trend Flip Weekly Bias est un indicateur de signaux pour MetaTrader 5 : signaux de bascule de tendance lissée (il ne signale que dans le sens du biais hebdomadaire). Logique NQX propriétaire qui détecte un changement de couleur des bougies lissées après un mouvement. Il ne signale que dans le sens du biais hebdomadaire. Il trace l'entrée suggérée, un stop court et des objectifs éloignés (3:1, 5:1, 10:1, jusqu'à 20:1 en swing) ; vous décidez. Ce qu'il affiche sur le graphique - Une flè
    Harraz Scalper System Pro
    Muhammad Azraf Bin Dzul Fauzi
    Harraz Neural Scalper PRO – The Future of XAUUSD Scalping ​Experience the next generation of precision trading with the Harraz Neural Scalper System. ​Are you tired of cluttered charts and lagging signals? Harraz Neural Scalper v2.8 is not just an indicator; it’s a high-performance AI Neural HUD designed specifically for the fast-paced world of Gold (XAUUSD) scalping. ​Built with a surgical crossover logic and filtered by a 200-period Major Trend Engine, this system ensures you are always on th
    Indicateur Crypto_Forex « Motif Marteau et Étoile Filante » pour MT5, sans modification, sans délai. - L'indicateur « Motif Marteau et Étoile Filante » est un indicateur très performant pour le trading Price Action. - L'indicateur détecte les motifs Marteau haussier et Étoile Filante baissière sur le graphique : - Marteau haussier : signal de flèche bleue sur le graphique (voir images). - Étoile Filante baissière : signal de flèche rouge sur le graphique (voir images). - PC, Mobile alerts. - L'
    AutoTrend Pro
    Aram Hussein Mohammed
    TL Method — Automatic Trendline Detection & Strength Indicator Tired of drawing trendlines manually? TL Method does it for you — automatically detecting, drawing, and scoring trendlines in real time. What it does: Scans up to 1000 bars to find valid support and resistance trendlines Scores each trendline by counting confirmed anchor touches Generates buy/sell signal arrows when price approaches strong trendlines Alerts you via popup, push notification, or sound — with smart cooldown to avoid spa
    Liquidity Order Blocks MT5
    Johan Adrian Nieto Resendiz
    Liquidity Order Blocks MT5 Liquidity Order Blocks MT5 is a professional visual indicator for MetaTrader 5 designed to help traders identify and monitor potential bullish and bearish liquidity areas directly on the chart. The indicator detects pivot-based order block zones and displays each zone with a structured visual breakdown of estimated bullish volume, bearish volume, relative strength and delta. Its purpose is to make liquidity areas easier to read, compare and monitor during market analys
    "Adjustable Fractals" - est une version avancée de l'indicateur fractal, un outil de trading très utile ! - Comme nous le savons, l'indicateur fractal standard MT5  n'a aucun paramètre - c'est très gênant pour les traders. - Les fractales ajustables ont résolu ce problème - il dispose de tous les paramètres nécessaires : - Période réglable de l'indicateur (valeurs recommandées - supérieures à 7). - Distance réglable par rapport aux hauts/bas du prix. - Conception réglable des flèches fractales.
    Hunter trend
    Yaroslav Varankin
    Hunter Trend: Arrow Indicator for Binary Options Trading Hunter Trend is an arrow indicator designed for trading binary options (turbo options) on the M1 timeframe, allowing for short-term trading opportunities. How to Trade with this Tool: Signals may appear when a candlestick forms. Once such a signal appears, wait for the closure of that candlestick. Upon the opening of a new candlestick, open a trade for 1-2 candlesticks in the indicated direction. In this case, for 1-2 minutes. A blue dot
    Kalman Cone Forecast MT5 Adaptive forecast cone, trend pressure, and exhaustion detection in one clean trading panel. Kaman Cone Forecast is an adaptive predictive indicator for MetaTrader 5. It uses Kalman filter smoothing to reduce market noise, estimate current trend pressure, and project a forward price cone based on live volatility conditions. Instead of showing only a moving average line or a basic volatility band, Kalman Cone Forecast gives you a clearer answer to three important questi
    Order Book, known also as Market Book, market depth, Level 2, - is a dynamically updated table with current volumes of orders to buy and to sell specific financial instument at price levels near Bid and Ask. MetaTrader 5 provides the means for receiving market book from your broker, but in real time only, without access to its history. The indicator OrderBook Cumulative Indicator accumulates market book data online and visualizes them on the chart. In addition, the indicator can show the market
    Divergent Stochastic Filter II Catch Reversals Early, Filter Noise, Trade with Confidence The Edge: Why This Stochastic is Different  Every trader knows the Stochastic oscillator. But knowing when to trust its signals, that's the real challenge. The Divergent Stochastic Filter II transforms this classic indicator into a precision reversal detection system by adding critical elements: divergence intelligence, signal filtering and exhaustion detection.  While standard Stochastic oscillators fire s
    Oscillator trading signals - это динамический индикатор, определяющий состояние к продолжению тенденции роста или падению цены торгового инструмента и отсечению зон с нежелательной торговлей. Индикатор состоит из 2 линий осцилляторов. Медленная и быстрая сигнальная линия.  Шкала отображения перевернутая. Зоны вблизи 0 свидетельствуют о тенденции роста цены валютной пары. Зоны -100 свидетельствуют о падении цены валютной пары. На основном графике в виде стрелок отображается потенциально выгодные
    AW Heiken Ashi MT5
    AW Trading Software Limited
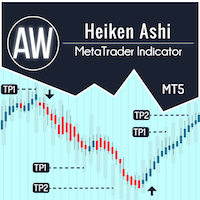
    AW Heiken Ashi — Indicateur intelligent de tendance et de niveaux de TP. Indicateur avancé basé sur le Heiken Ashi classique, adapté aux traders, offrant plus de flexibilité et de clarté. Contrairement à l'indicateur standard, AW Heiken Ashi permet d'analyser la tendance, de déterminer les objectifs de profit et de filtrer les faux signaux, pour des décisions de trading plus sûres. Guide d'installation et instructions - Ici / Version MT4 - Ici Avantages de AW Heiken Ashi : Fonctionne sur tous l
    KasTon Trend System: The Complete 2-in-1 Trading Strategy Identify the Trend, Confirm the Signal, and Trade with Confidence! Do you suffer from confusion while trading? Do you find it difficult to determine the market's direction? Are you tired of losing money on false signals? The KasTon Trend System is here as an integrated solution to all these problems. This is not just an indicator; it is a complete trading strategy built on the synergy of two powerful, custom-built indicators. Our main g
    Les acheteurs de ce produit ont également acheté
    Trend Sniper X
    Sarvarbek Abduvoxobov
    4.86 (42)
    Trend Sniper X est un indicateur de suivi de tendance multi-unités de temps pour MetaTrader 5 qui aide les traders à identifier la direction de la tendance et les points d'inversion potentiels avec clarté et précision. pour MT4: https://www.mql5.com/en/market/product/193245 Informations sur le prix : Le prix actuel est un prix promotionnel et est susceptible de changer lors des prochaines mises à jour et nouvelles fonctionnalités. Offre bonus : Pour obtenir GRATUITEMENT l'Auto-Trade Assistant E
    La légende est de retour : Entry Points Pro 10. La relance de l'indicateur légendaire qui s'est maintenu 3 ans dans le Top-3 du MQL5 Market. Plus de 600 avis sur les deux versions, des milliers de traders l'utilisent chaque jour, plus de 28 000 téléchargements de la démo   MT4+MT5 . J'ai lu chacun de vos avis publiés en cinq ans — et au lieu de promettre, j'ai intégré les réponses directement dans la version 10. Par un auteur présent sur les marchés depuis 1999, qui tient à l'honnêteté, à sa rép
    ARIPoint
    Temirlan Kdyrkhan
    1 (4)
    ARIPoint is a powerful trading companion designed to generate high-probability entry signals with dynamic TP/SL/DP levels based on volatility. Built-in performance tracking shows win/loss stats, PP1/PP2 hits, and success rates all updated live. Key Features: Buy/Sell signals with adaptive volatility bands Real-time TP/SL/DP levels based on ATR Built-in MA Filter with optional ATR/StdDev volatility Performance stats panel (Success, Profit/Loss, PP1/PP2) Alerts via popup, sound, push, or email Cu
    Gann Made Easy   est un système de trading Forex professionnel et facile à utiliser qui est basé sur les meilleurs principes de trading en utilisant la théorie de mr. WD Gann. L'indicateur fournit des signaux d'ACHAT et de VENTE précis, y compris les niveaux Stop Loss et Take Profit. Vous pouvez échanger même en déplacement en utilisant les notifications PUSH. VEUILLEZ ME CONTACTER APRÈS L'ACHAT POUR RECEVOIR GRATUITEMENT DES INSTRUCTIONS DE TRADING ET D'EXCELLENTS INDICATEURS SUPPLÉMENTAIRES! V
    M1 Sniper MT5
    Oleg Rodin
    5 (7)
    M1 SNIPER   est un système d'indicateurs de trading facile à utiliser. Il s'agit d'un indicateur à flèche conçu pour l'unité de temps M1. Cet indicateur peut être utilisé seul pour le scalping sur l'unité de temps M1 ou intégré à votre système de trading existant. Bien que conçu spécifiquement pour le trading sur l'unité de temps M1, ce système peut également être utilisé avec d'autres unités de temps. Initialement, j'avais conçu cette méthode pour le trading du XAUUSD et du BTCUSD. Cependant, j
    Boba Analysis Suite
    Trade Ready Solutions LLC
    5 (2)
    Boba Analysis Suite Boba Analysis Suite est un indicateur d’analyse pour MetaTrader 5. Il réunit la structure du marché, les zones de prix pertinentes et le contexte général du marché dans une même vue graphique. Développé à partir de l’expérience pratique d’un trader et formateur en trading, il accompagne une démarche d’analyse structurée : évaluer la direction du marché, identifier les niveaux importants et analyser plusieurs unités de temps conjointement. Une analyse en contexte La significat
    Quantum TrendPulse
    Bogdan Ion Puscasu
    5 (26)
    Présentation de   Quantum TrendPulse   , l'outil de trading ultime qui combine la puissance de   SuperTrend   ,   RSI   et   Stochastic   dans un seul indicateur complet pour maximiser votre potentiel de trading. Conçu pour les traders qui recherchent précision et efficacité, cet indicateur vous aide à identifier les tendances du marché, les changements de dynamique et les points d'entrée et de sortie optimaux en toute confiance. Caractéristiques principales : Intégration SuperTrend :   suivez f
    Neuro Poseidon MT5
    Daria Rezueva
    4.75 (52)
    Neuro Poseidon is a new indicator by Daria Rezueva. It combines precise trading signals with adaptive TP/SL levels - creating best possible trades as a result! Message me and get  Neuro Poseidon Assistant  as a gift to automize your trading process! What makes it stand out? 1. Proven profitability on all assets and timeframes 2. Only confirmed BUY and SELL signals present on the chart 3. Adaptive TP & SL levels generated by the software for each trade 4. Easy to understand - suitable for al
    Azimuth Pro
    Ottaviano De Cicco
    5 (7)
    Azimuth Pro V2: Synthetic Fractal Structure and Confirmed Entries for MT5 Overview Azimuth Pro is a multi-level swing structure indicator by Merkava Labs . Four nested swing layers, swing-anchored VWAP, ABC pattern detection, three-timeframe structural filtering, and closed-bar confirmed entries — one chart, one workflow from micro-swings to macro-cycles. This is not a blind signal product. It is a structure-first workflow for traders who care about location, context, and timing. Halloween P
    Présentation       Quantum Breakout PRO   , l'indicateur révolutionnaire MQL5 qui transforme la façon dont vous négociez les zones d'évasion ! Développé par une équipe de traders expérimentés avec une expérience commerciale de plus de 13 ans,       Évasion quantique PRO       est conçu pour propulser votre parcours commercial vers de nouveaux sommets grâce à sa stratégie de zone de discussion innovante et dynamique. Quantum Breakout Indicator vous donnera des flèches de signalisation sur les z
    Indicateur de force et de momentum multi-devises MT5 Dynamic Forex28 Navigator est l'évolution de nos indicateurs populaires de longue date et réunit la puissance de trois outils en un : Advanced Currency Strength28 Indicator (700 avis) Advanced Currency IMPULSE with ALERT (530 avis) CS28 Combo Signals (bonus actuel) Les deux indicateurs précédents totalisent plus de 1 200 avis sur le MQL5 Market et font partie des outils incontournables de la communauté MT4 depuis 2016. Dynamic Forex28 Navigato
    Scalper Vault est un système de trading puissant et complet, conçu pour les traders en quête de régularité dans le cadre du trading intrajournalier. Cet indicateur de haute précision constitue un système de trading autonome et exhaustif, offrant des analyses de qualité institutionnelle, aussi bien pour le Forex que pour les options binaires. VEUILLEZ ME CONTACTER APRÈS VOTRE ACHAT POUR OBTENIR MES CONSEILS DE TRADING AINSI QU'UN EXCELLENT BONUS ! En éliminant les incertitudes et les analyses man
    Volatility Master for MetaTrader is a real-time dashboard tool that scans up to  50 symbols  to identify high-volatility , trending markets instantly. With bullish/bearish signals, customizable alerts, and a user-friendly interface, it helps you avoid range-bound conditions and focus on high-probability trades. Clarity leads to confidence. Trade confidently and protect your capital effectively with this powerful dashboard. We don't offer free or bonus indicators in exchange of reviews from you.
    SR Liquidity   est un indicateur de trading conçu pour révéler les zones cachées où se concentre la liquidité du marché et où le prix réagit avec le plus d'intensité. Ces zones de liquidité spécifiques agissent comme de puissants niveaux de support et de résistance, vous offrant une cartographie claire des points où le marché est le plus susceptible de se retourner. Plutôt que de tracer des lignes de support et de résistance classiques, l'indicateur SR Liquidity analyse le comportement réel des
    OrderFlux – Indicateur Orderflow Footprint Chart, Volume Profile et Market Profile pour MetaTrader 5 OrderFlux est un indicateur de flux d’ordres et de footprint pour MetaTrader 5 qui se comprend intuitivement. Il ouvre chaque bougie pour montrer ce qui se passe à l’intérieur : le volume négocié à chaque niveau de prix, réparti entre les acheteurs agressifs et les vendeurs agressifs. À partir des ticks, il construit en temps réel un graphique Footprint complet intégrant le delta, les déséquilibr
    Advanced Supply Demand MT5
    Bernhard Schweigert
    4.53 (15)
    La meilleure solution pour tout commerçant débutant ou expert ! Cet indicateur est un outil de trading unique, de haute qualité et abordable car nous avons intégré un certain nombre de fonctionnalités propriétaires et une nouvelle formule. Avec cette mise à jour, vous pourrez afficher des zones à double horaire. Vous pourrez non seulement afficher un TF plus élevé, mais afficher les deux, le graphique TF, PLUS le TF supérieur : AFFICHAGE DES ZONES NICHÉES. Tous les traders Supply Demand vont ado
    Precision Spike Detector
    Francisco Mandomo Simbine
    5 (2)
    Precision Spike Detector V3 – Institutional-Grade AI Trading System Attention: The price increases by US$50 for every 10 purchases.  Final price: US$599 Precision Spike Detector V3   is a   state-of-the-art, institutional-grade market analysis system   for   MetaTrader 5 , designed to detect   high-probability market movements   in synthetic indices such as   Boom, Crash, GainX, and PainX . After purchase, send me a private message to receive the optimized configuration files,  the installation
    Matreshka
    Dimitr Trifonov
    5 (2)
    Matreshka self-testing and self-optimizing indicator: 1. Is an interpretation of the Elliott Wave Analysis Theory. 2. Based on the principle of the indicator type ZigZag, and the waves are based on the principle of interpretation of the theory of DeMark. 3. Filters waves in length and height. 4. Draws up to six levels of ZigZag at the same time, tracking waves of different orders. 5. Marks Pulsed and Recoil Waves. 6. Draws arrows to open positions 7. Draws three channels. 8. Notes support and re
    Divergence Bomber
    Ihor Otkydach
    4.89 (94)
    Chaque acheteur de cet indicateur reçoit également gratuitement : L’outil exclusif « Bomber Utility », qui accompagne automatiquement chaque opération de trading, fixe les niveaux de Stop Loss et de Take Profit, et clôture les positions selon les règles de la stratégie Des fichiers de configuration (set files) pour adapter l’indicateur à différents actifs Des set files pour configurer le Bomber Utility selon différents modes : « Risque Minimum », « Risque Équilibré » et « Stratégie d’Attente »
    La meilleure solution pour tout débutant ou trader expert ! Cet indicateur est un outil de trading unique, de haute qualité et abordable car nous avons incorporé un certain nombre de caractéristiques exclusives et une nouvelle formule. Avec seulement UN graphique, vous pouvez lire la force de la devise pour 28 paires Forex ! Imaginez comment votre trading va s'améliorer parce que vous êtes capable de repérer le point de déclenchement exact d'une nouvelle tendance ou d'une opportunité de scalpi
    PZ Swing Trading MT5
    PZ TRADING SLU
    5 (5)
    Protect against whipsaws: revolutionize your swing trading approach Swing Trading is the first indicator designed to detect swings in the direction of the trend and possible reversal swings. It uses the baseline swing trading approach, widely described in trading literature. The indicator studies several price and time vectors to track the aggregate trend direction and detects situations in which the market is oversold or overbought and ready to correct. [ Installation Guide | Update Guide | Tro
    Bonjour à tous les traders ! De nombreux investisseurs individuels utilisent des scripts web lents. Une approche systématique est essentielle pour un trading rentable. L'indicateur Astro AI n'est pas un simple affichage sur un graphique. Il s'agit d'un réseau neuronal sophistiqué composé de deux agents fonctionnant directement dans le terminal. Détails techniques du système : 1. Agent 1 : Analyste (Réseau neuronal graphique – GNN) Le marché n'est pas constitué de barres de prix individuelle
    The Oracle Pro
    Ottaviano De Cicco
    5 (1)
    The Oracle Pro: Synthetic Multi-Timeframe Bias Engine for MT5 Halloween Promo — 35% OFF The market gets spooky. Your edge stays sharp. Save 35% before this offer fades into the mist. The Oracle Pro is now USD 194 (regular USD 299). The Oracle Pro is a premium multi-timeframe bias engine for MetaTrader 5, built for demanding and professional traders. It answers one question with discipline: what is the directional bias on each timeframe right now, how strong is it, and how much do the timefra
    M1 Quantum MT5
    Hamed Dehgani
    4.2 (10)
    Signaux de Trading en Direct avec M1 Quantum : Signal   (L’opération est exécutée automatiquement par le Quantum Trade Assistant , inclus gratuitement avec ce produit.) Dernières nouvelles : La version 1.64 a été publiée. Toutes les transactions disposent désormais d’un Stop Loss placé derrière les zones de support/résistance correspondantes. La fonction Smart Close a également été améliorée afin d’augmenter les performances de l’EA dans cette version. Depuis le 9 août, le signal en direct fonc
    Graded Liquidity Sweep
    Kaustubh Pradeep Deshmukh
    This indicator marks the candles where price runs through a liquidity level and turns back. It finds and ranks the levels by itself, so there is nothing to draw by hand. It is made for manual trading on any symbol and timeframe. What you see on the chart A buy or sell arrow on the candle that confirms the reversal. Arrows appear only after that candle has closed, and they do not repaint. For every signal: the level that was swept, a stop level and two target levels. A label with the type of leve
    Superhero
    Ihor Otkydach
    5 (3)
    L'indicateur SUPERHERO est un système de trading multidevises conçu selon un principe « tout compris ». Cet indicateur analyse le marché de manière autonome et fournit des signaux indiquant quand ouvrir et clôturer des positions. Il utilise des ordres Stop Loss et Take Profit. Le rapport R:R est de 1:1. Ce système peut envoyer des notifications push sur votre smartphone, ce qui vous permet de passer des ordres « où que vous soyez », sans avoir à rester devant un ordinateur. C'est la solution idé
    Btmm state engine pro
    Garry James Goodchild
    5 (4)
    BTMM State Engine Pro by G-Labs — Beat The Market Maker indicator for MetaTrader 5. Asian session range, London and New York kill zones, level progression (L1/L2/L3), peak formation detection (PFH/PFL), entry signals, and a multi-pair scanner from one chart. Stop scanning charts one pair at a time. The State Engine tracks the BTMM daily cycle automatically — Asian box, room boundaries, level blocks, peak formations, and filtered entries — while the scanner dashboard shows level, peak status, d
    RelicusRoad Pro MT5
    Relicus LLC
    4.96 (25)
    Arrêtez de deviner vos trades. Sachez quand entrer, où sortir et dans quel sens va le marché, le tout sur un seul graphique. RelicusRoad Pro réunit près de vingt outils dans un seul indicateur, et vous activez ceux qui correspondent à votre façon de trader. Entrées claires. Sorties claires. Un plan sur chaque graphique. Ça vous dit quelque chose ? Vous achetez, et le prix se retourne contre vous une minute plus tard. Vous clôturez trop tôt, puis vous regardez le mouvement continuer sans vous. Ci
    L'indicateur UZFX {SSS} Scalping Smart Signals v5.0 MT5 est un indicateur de trading haute performance sans « repaint », conçu pour les scalpers, les day traders et les swing traders qui recherchent des signaux précis et en temps réel sur des marchés très volatils. Développé par (UZFX-LABS), cet indicateur combine l'analyse de l'action des cours, la confirmation des tendances et un filtrage intelligent pour générer des signaux d'achat et de vente à forte probabilité, des signaux d'alerte et des
    Apex Patterns PRO Achetez l'indicateur - Obtenez GRATUITEMENT l'Expert Advisor basé sur celui-ci. Intelligence auto-optimisée des figures chartistes et des cassures Les scanners de figures traditionnels s'appuient sur des paramètres fixes, sous-performant souvent lorsque la volatilité et les structures du marché changent. Apex Patterns PRO est conçu pour s'adapter aux conditions changeantes du marché en combinant la reconnaissance des figures chartistes structurelles, le filtrage du momentum et
    Plus de l'auteur
    IPDA and PD Ranges MT4
    Thank-god Avwerosuoghene Odukudu
    5 (1)
    IPDA AND PD RANGES. Interbank Price Delivery Algorithm (IPDA) Range Liquidity and trades in the FX market take place in a decentralized manner as banks, brokers and electronic communication networks (ECNs) interact with one another to set prices. In FX, and ECN is a trading platform or electronic broker that hosts bids and offers and transmit them to users worldwide. ECN broadcasts a price around the world as various participants leave orders to buy and sell. Banks provide streaming prices based
    CiSD MT4
    Thank-god Avwerosuoghene Odukudu
    CiSD | Change in State Delivery See exactly where price delivery changes direction. CiSD automatically detects Change in State Delivery and plots the critical price associated with the shift - giving ICT/SMC traders a precise reference level without manually searching through candle sequences. DETECT → MARK → CONFIRM → ANALYZE Figure 1: See the exact level where the delivery state changes. CiSD is designed for traders who use liquidity, displacement, market structure, FVGs/Imbalances and premi
    IPDA and PD Ranges
    Thank-god Avwerosuoghene Odukudu
    IPDA AND PD RANGES. Interbank Price Delivery Algorithm (IPDA) Range Liquidity and trades in the FX market take place in a decentralized manner as banks, brokers and electronic communication networks (ECNs) interact with one another to set prices. In FX, and ECN is a trading platform or electronic broker that hosts bids and offers and transmit them to users worldwide. ECN broadcasts a price around the world as various participants leave orders to buy and sell. Banks provide streaming prices base
    Filtrer:
    刘华钦
    36
    刘华钦 2026.01.10 13:23 

    L'utilisateur n'a laissé aucun commentaire sur la note

    Thank-god Avwerosuoghene Odukudu
    3962
    Réponse du développeur Thank-god Avwerosuoghene Odukudu 2026.01.10 14:28
    Hi there! Thank you for downloading the indicator.
    ​This tool is designed to represent complex concepts taught by InnerCircleTrader (ICT). If you are familiar with concepts such as PD Arrays and Liquidity Runs, you can use the indicator for additional confirmation. If you are not familiar with ICT, you can simply use it to identify a change in delivery once the price reaches your desired buy or sell levels.
    ​Please let me know if you are an ICT student or if you notice the indicator producing a signal that differs from what is shown in the videos.
    ​Regards,
    IKnow.
    Répondre à l'avis