CiSD

CiSD | Change in State Delivery

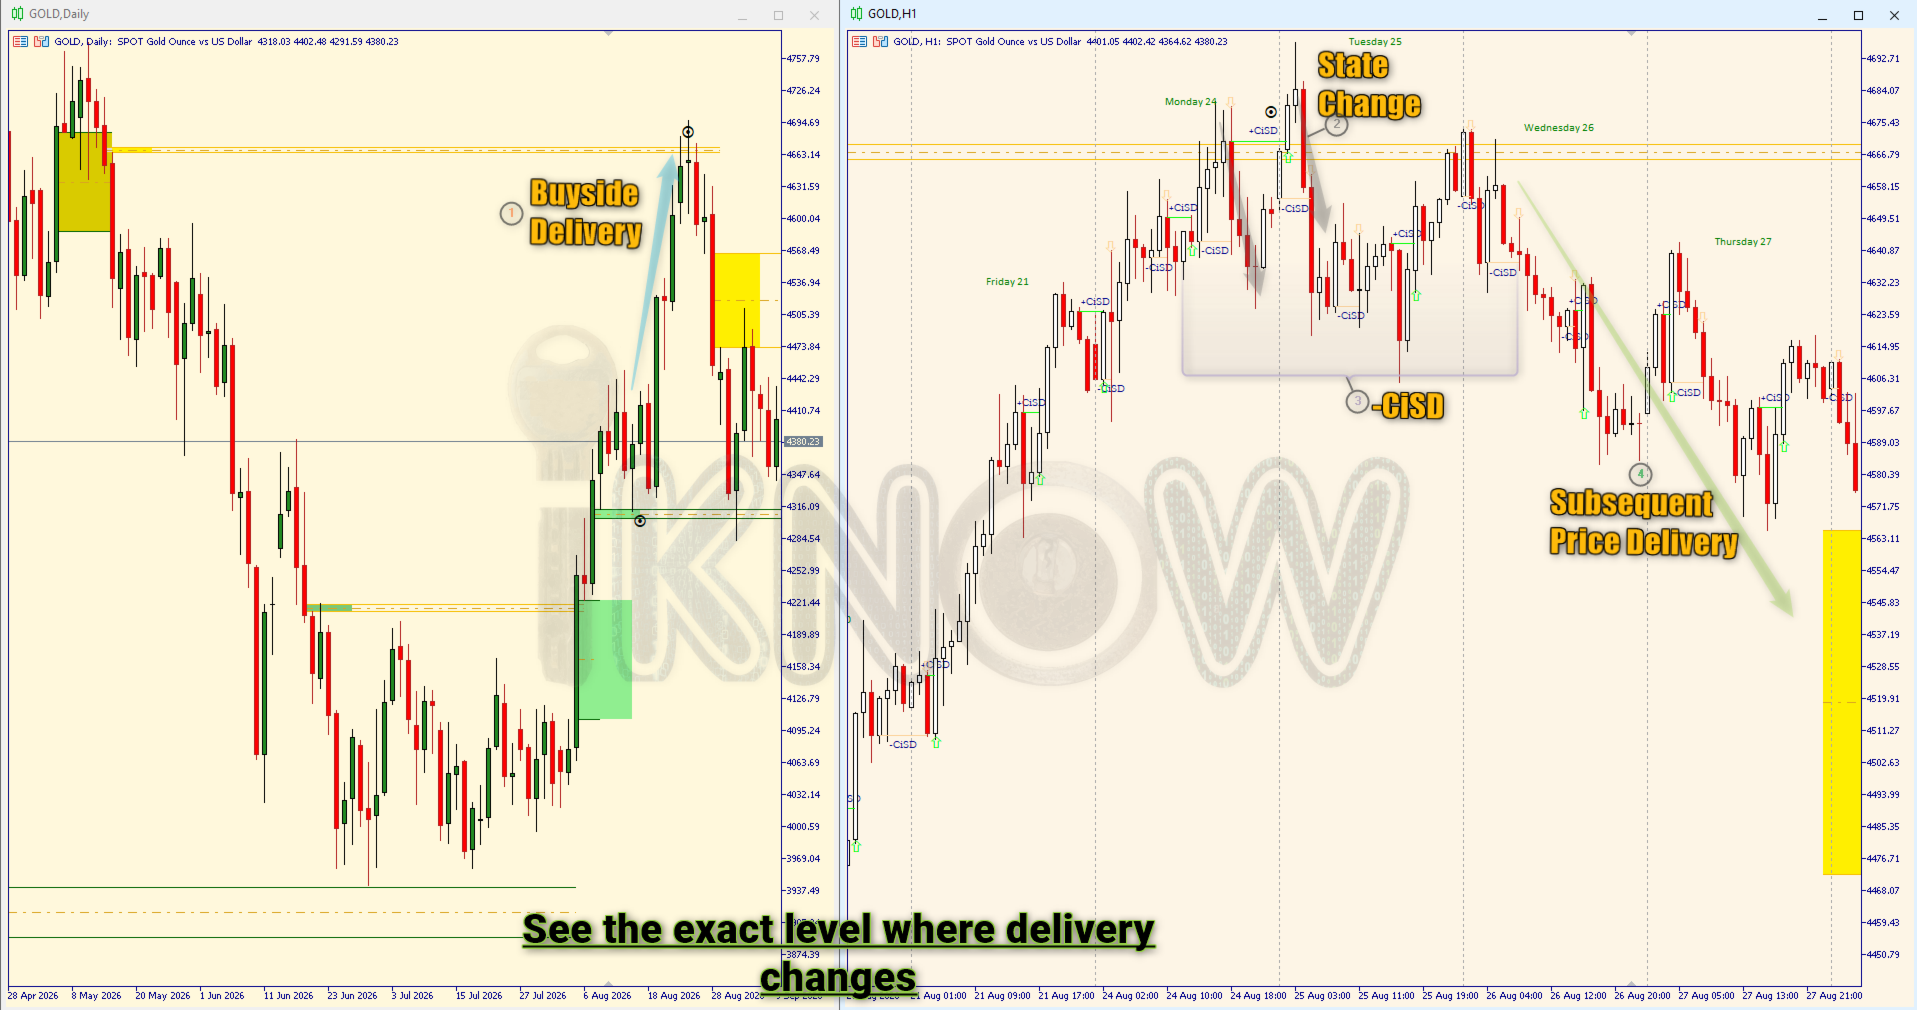
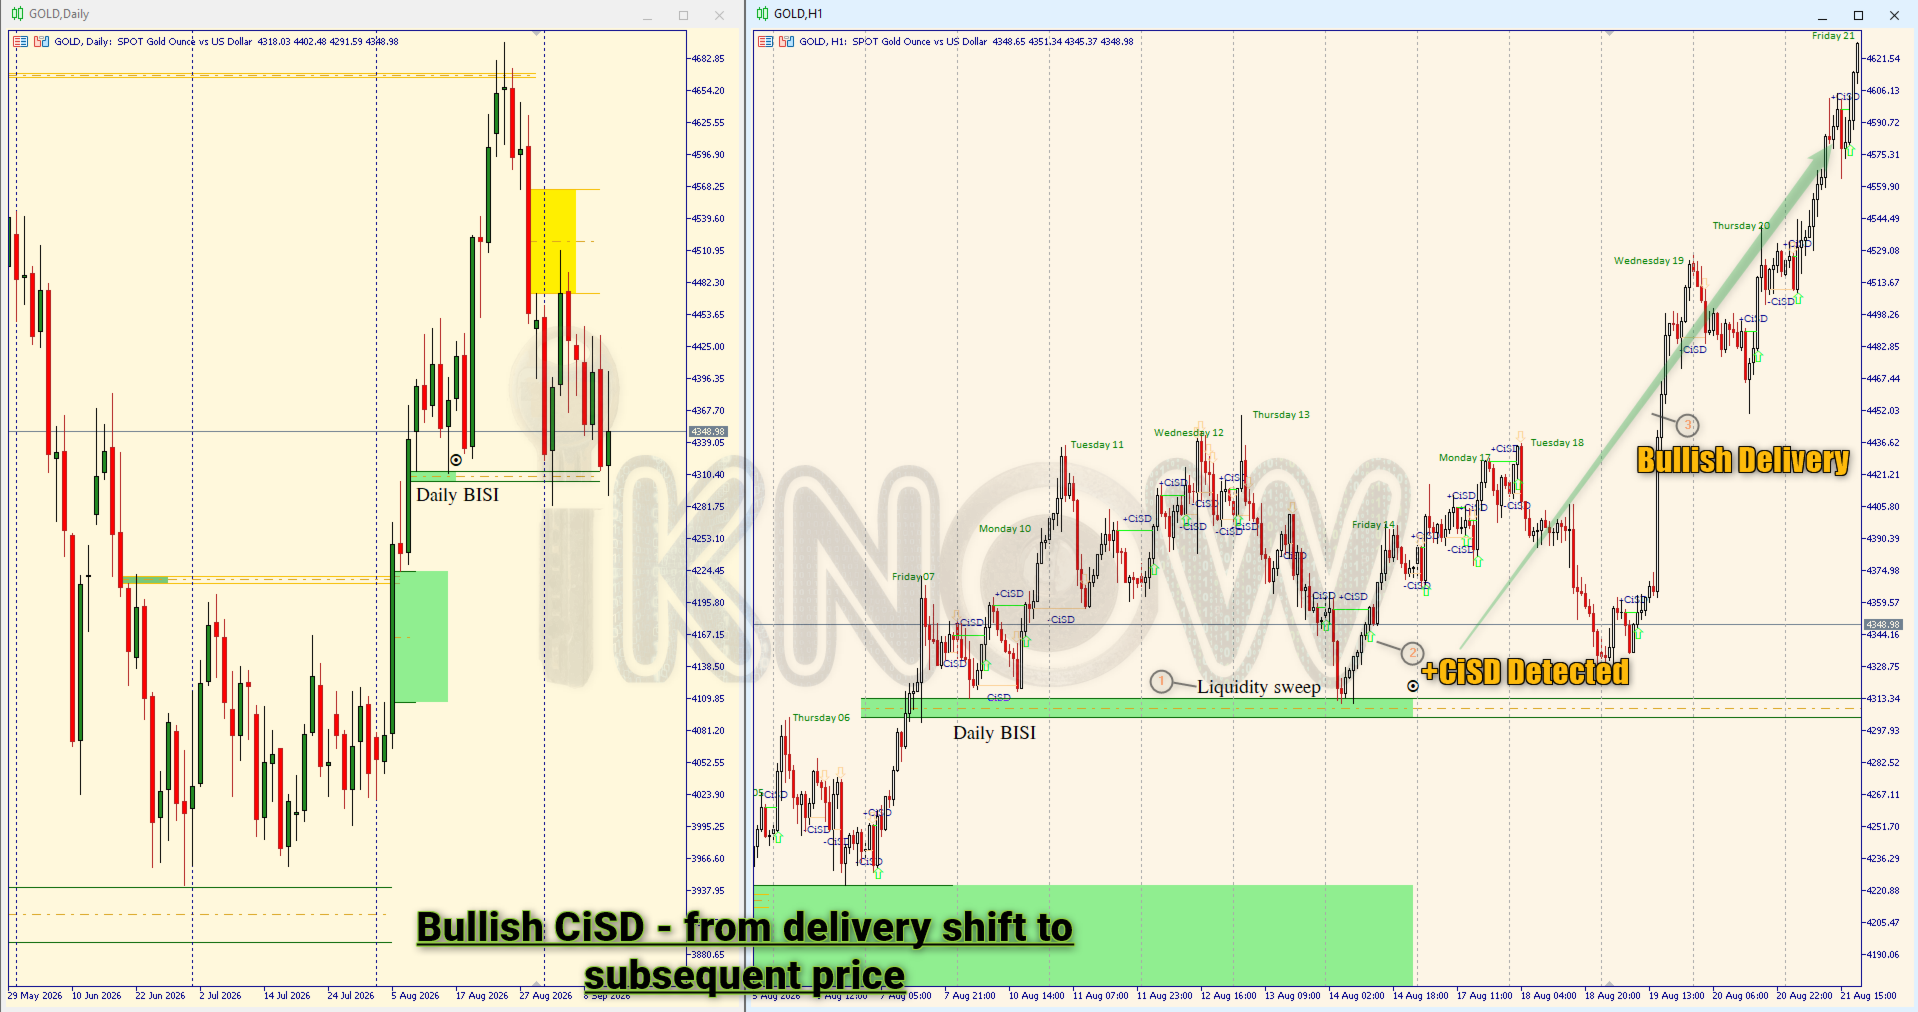
See exactly where price delivery changes direction.

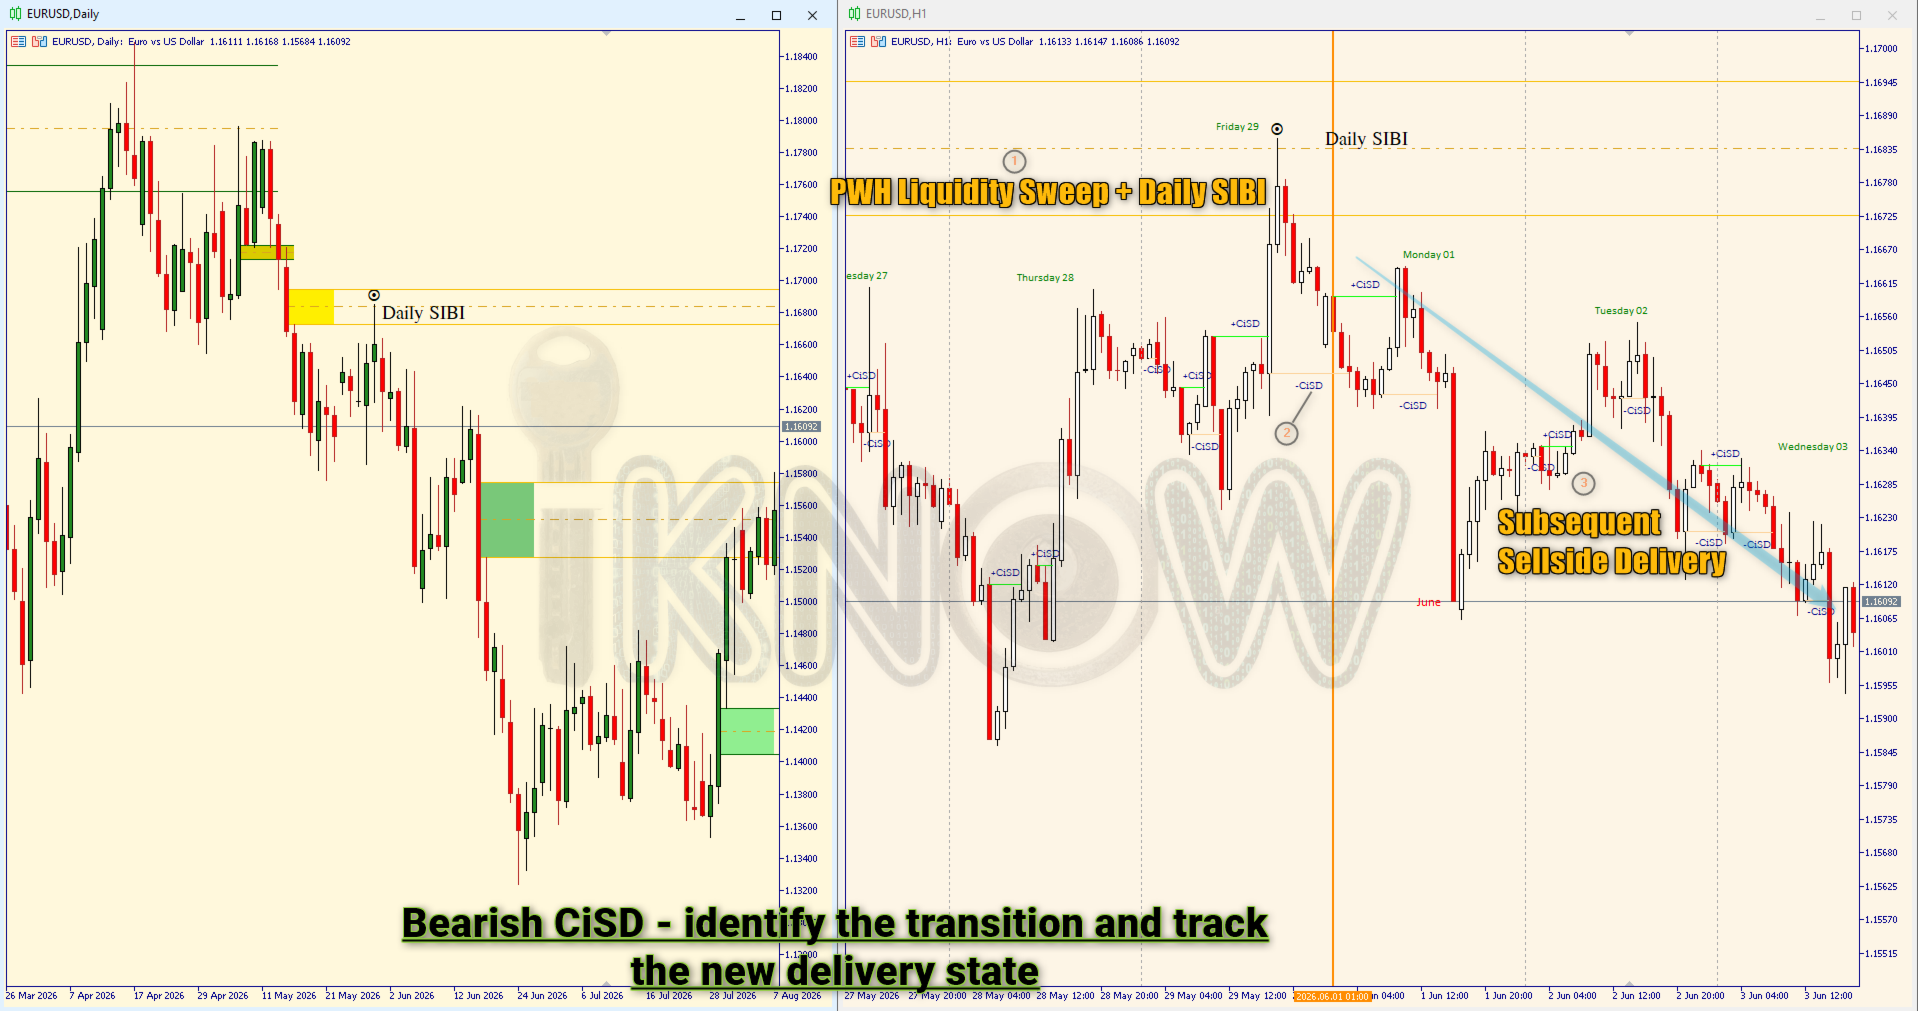
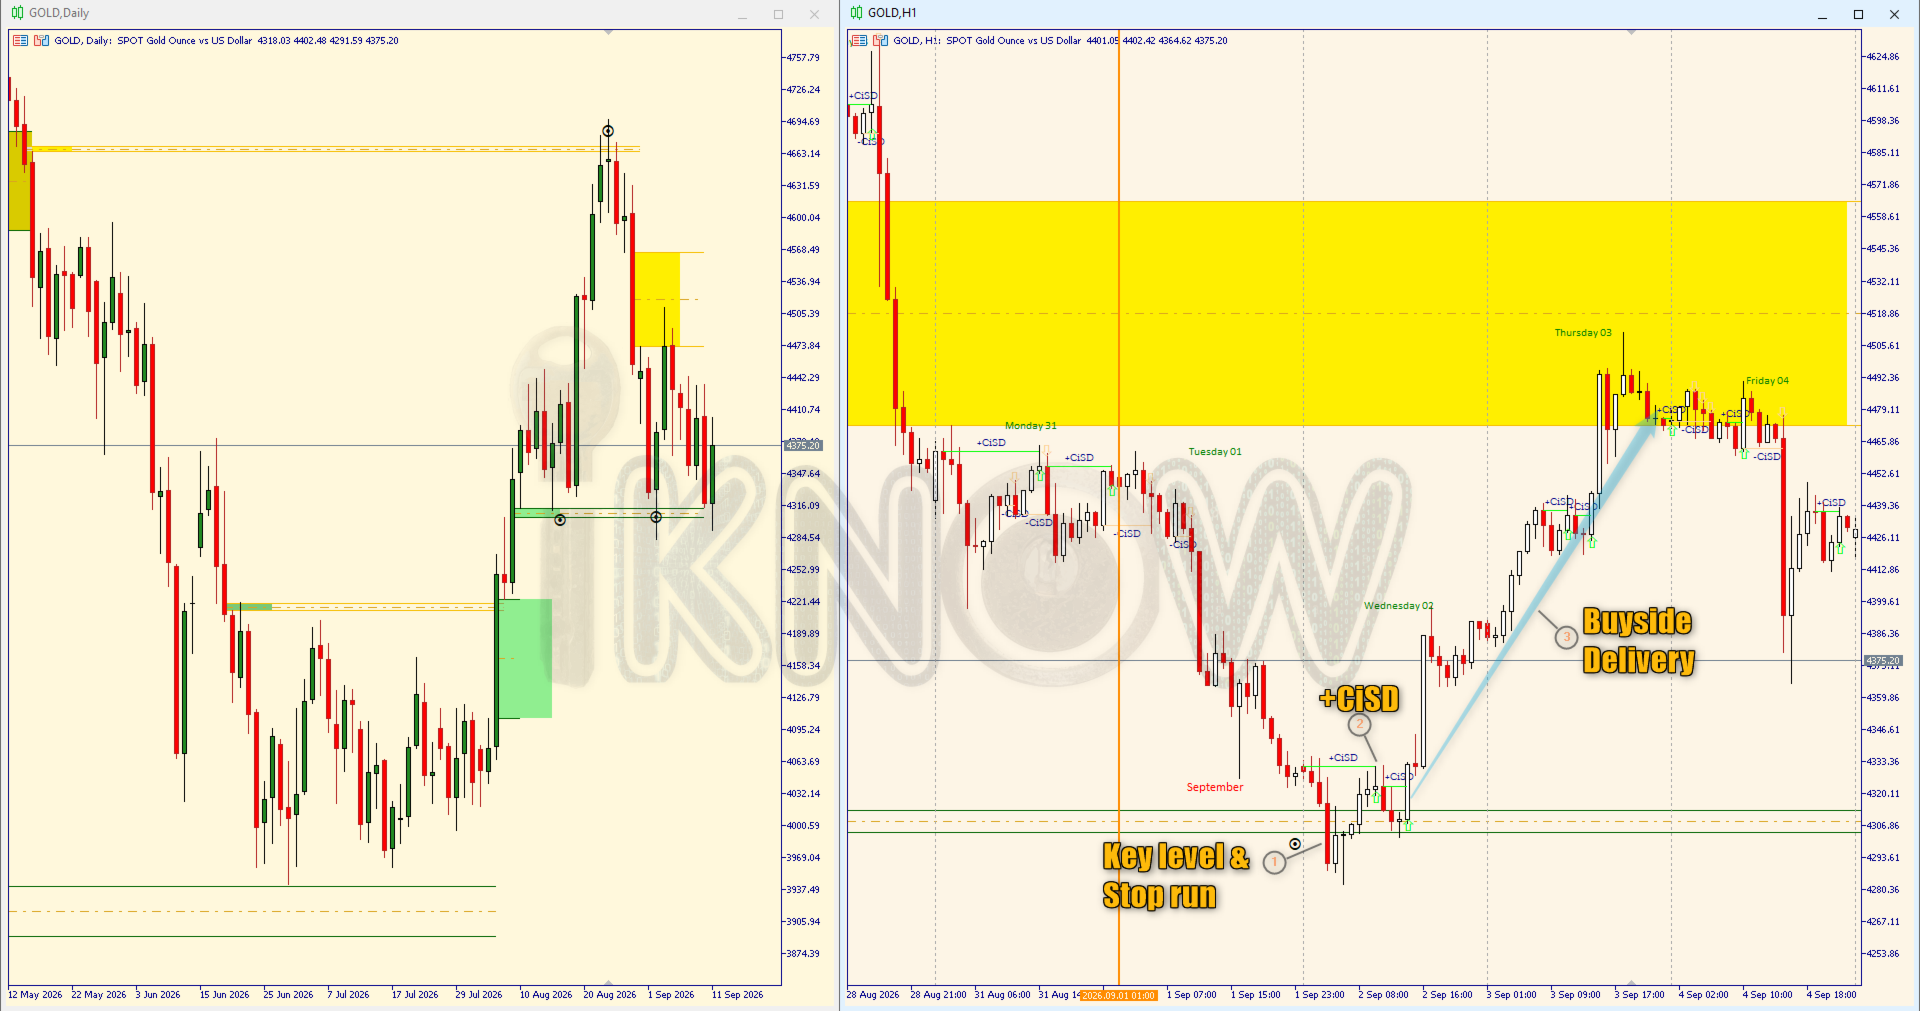
CiSD automatically detects Change in State Delivery and plots the critical price associated with the shift - giving ICT/SMC traders a precise reference level without manually searching through candle sequences.

DETECT → MARK → CONFIRM → ANALYZE

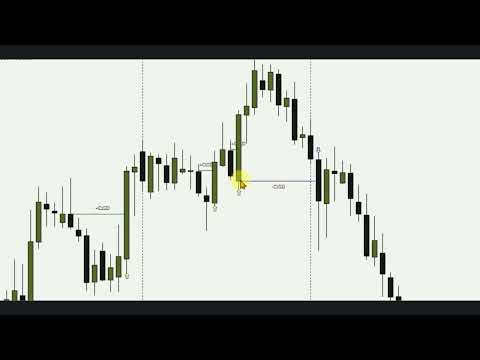
Figure 1: See the exact level where the delivery state changes.

CiSD is designed for traders who use liquidity, displacement, market structure, FVGs/Imbalances and premium/discount Arrays as part of their analysis.

Instead of manually identifying every delivery-state transition and marking the originating price, CiSD does the repetitive chart work for you.

The objective isn't to give you another buy/sell arrow. It's to show you the level where the delivery state changed.

What CiSD Gives You

🎯 Precise CiSD Levels

Automatically identifies and plots the relevant opening price associated with the Change in State Delivery.

↔ Bullish & Bearish State Changes.

Clearly distinguish transitions toward bullish or bearish delivery.

📍 Persistent Chart Reference

Keep the CiSD levels visible so you can study subsequent price action around the originating level.

📚 Historical Analysis

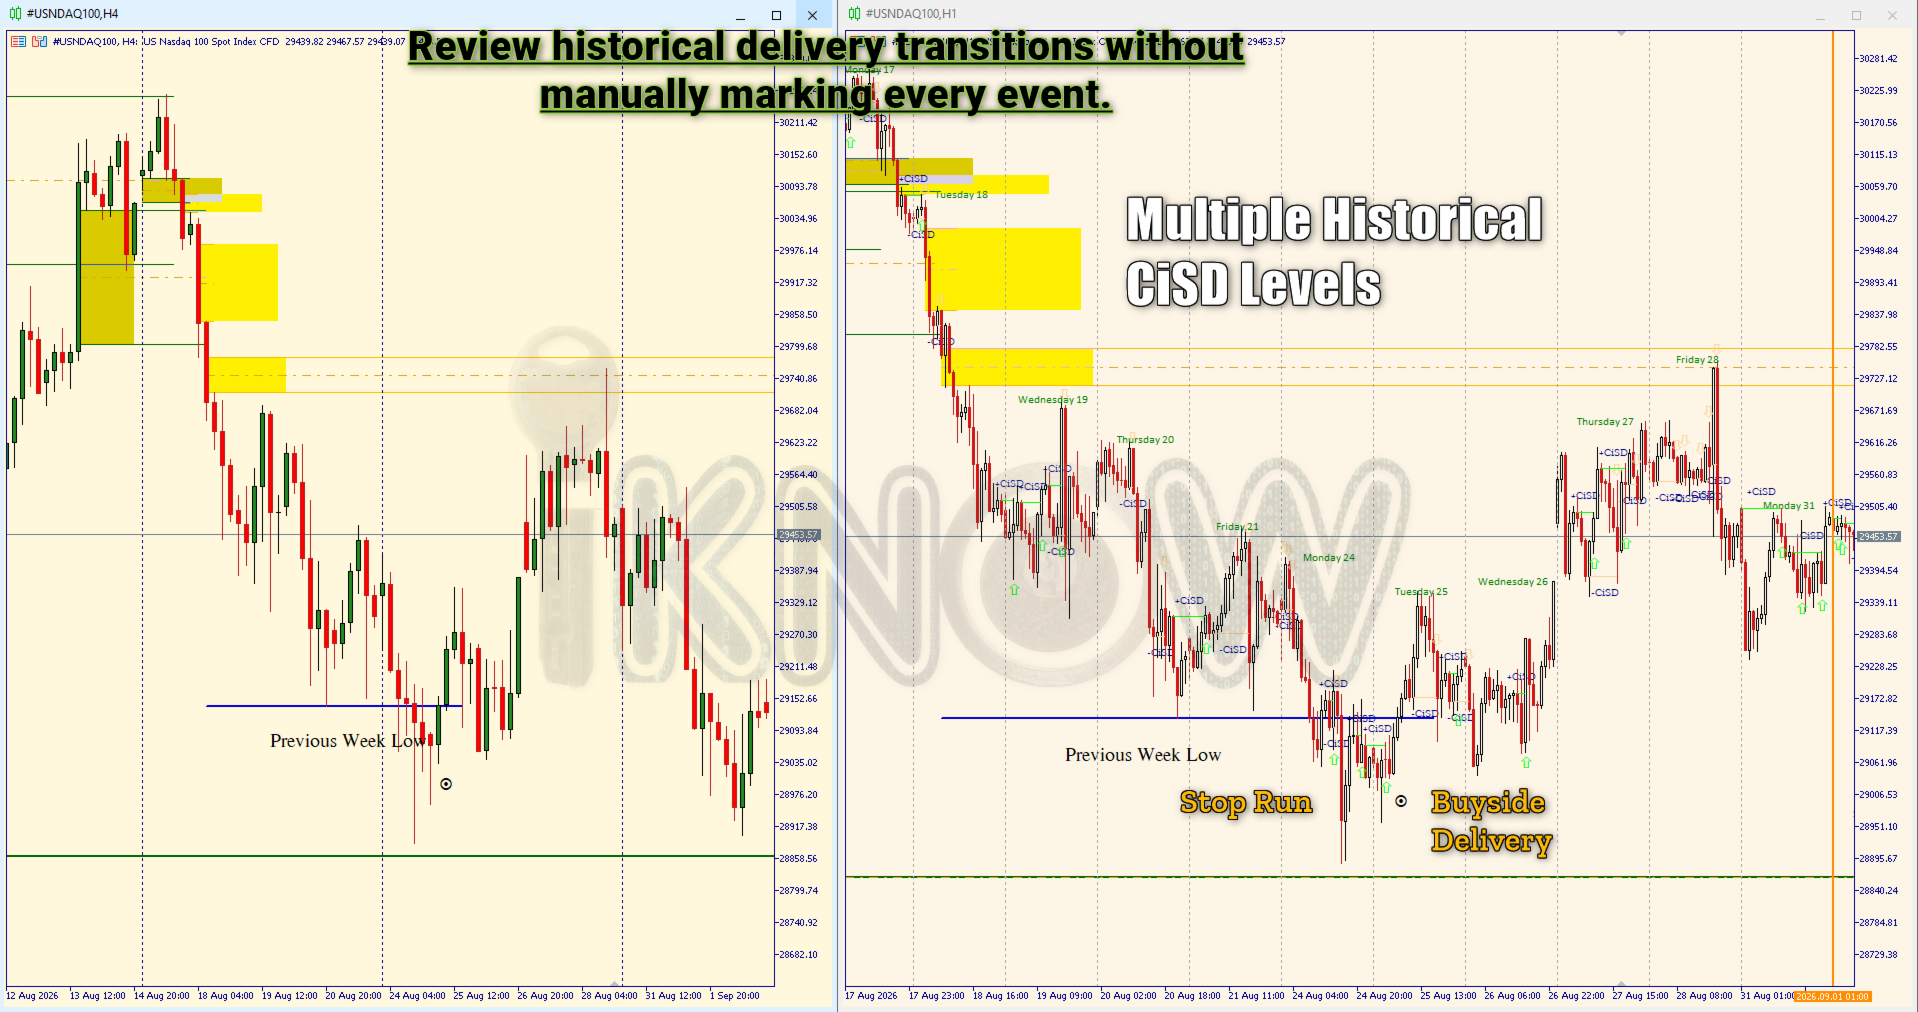
Review previous CiSD events directly on the chart instead of manually reconstructing historical examples.

🤖 Automated Detection

Continuously monitor price action for qualifying CiSD events while you focus on market interpretation.

⏱ Time-Saving Workflow

Reduce repetitive chart marking and focus your attention on context, confirmation and execution.


How It Works

01

Price Delivers

Price is delivering toward liquidity or inefficiency in one direction.

02

Delivery Changes

Price action satisfies the conditions defining a Change in State Delivery.

03

CiSD Is Identified

The indicator identifies the corresponding delivery transition.

04

Level Is Plotted.

The associated opening price is displayed directly on the chart

05

You Analyze the Context

Evaluate Continuation, Retracement, Liquidity targets, FVG/Imbalance interaction, Structure and invalidation.


How It Works

Why Traders Use CiSD

Manual CiSD analysis can require repeatedly:
Watch candles → identify the transition → located the correct candle →find its opening price → monitor price → repeat.
CiSD automates that repetitive process.

Instead of asking:

"Where exactly did the delivery change?"

You can immediately see:

"This is the CiSD level. Now what is price doing around it?"

That makes the tool useful for both live analysis and historical chart study.


Manual analysis vs. CiSD Automation?

Spend less time maintaining your chart and more time interpreting price action — no more drawing lines and second-guessing whether a true state change occurred.

Manual Process

  1. Watch candle sequences continuously.
  2. Identify delivery state transition
  3. Locate the specific initiating candle
  4. Manually draw line at opening price
  5. Monitor interaction and repeat

The CiSD Workflow

  1. Monitor: Indicator tracks algorithm behaviour
  2. Detect: Instant shift identification
  3. Mark:Automatic level plotting
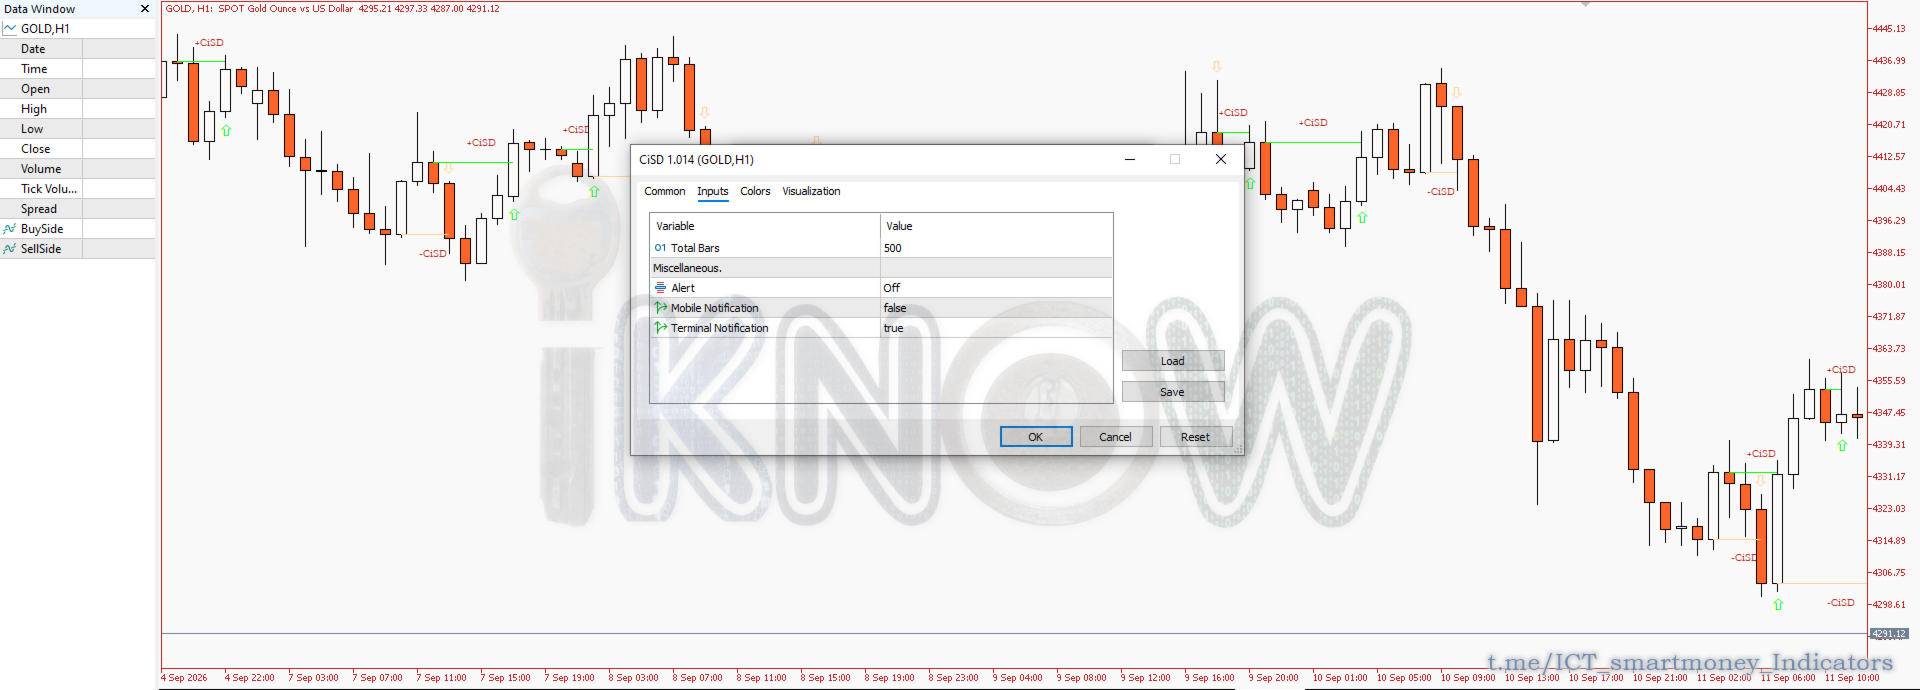
  4. Alert: Terminal & mobile notifications
  5. Analyze: Focus purely on trade execution

How to Trade with CiSD Levels

  1. Price Delivers: Price moves toward liquidity in a single direction.
  2. State Shifts: Candle conditions satisfy a CiSD transition.
  3. Level Plotted: The exact opening price level is locked onto the chart.
  4. Execution Analysis: Evaluate price action around the level for continuation setups, retracement entries, or invalidation.

Built for Traders who Already Understand the Framework

CiSD is intended for traders already familiar with concepts such as:

Change in State Delivery Buyside/Sellside Liquidity Displacement PD Arrays Fair Value Gaps/Imbalance. Market Structure Liquidity Sweeps

Already familiar with CiSD?

Go directly to the demo and verify the indicator's output on your own charts.

New to CiSD?

Learn the underlying ICT concept first. The indicator is an analysis tool, not a substitute for understanding the methodology.

CiSD does not replace your model - it adds the missing timing trigger.


Understanding Change in State Delivery

The Change in State delivery (CiSD) is a microstructure indicator that identifies critical pivotal points where the market (Price delivery Algorithm) shifts its directional focus from seeking liquidity on one side of the market to the other. Specifically, it signals a transition from buyside-driven liquidity to sellside-driven liquidity. CiSD marks the precise opening price that signals  a fundamental change in market structure and delivery direction.

What is State Delivery?

State delivery refers to the Market algorithm's active pursuit of liquidity pools and price inefficiencies. The market operates in two distinct delivery states:

  • Bullish State Delivery: Actively seeking Buyside liquidity (buystops, sell limits above highs) and premium inefficiencies.
  • Bearish State Delivery: Actively seeking Sellside Liquidity (sellstops, buy limits below lows) and discount inefficiencies.

What is a Change in State Delivery (CiSD)?

A CiSD occurs when price transitions from one delivery directive to the opposite:

  • Bullish to Bearish: Price stops seeking buyside liquidity and pivots to target sellside liquidity.
  • Bearish to Bullish: Price stops seeking sellside liquidity and pivots to target buyside liquidity.

The CiSD opening price is the specific candle open that initiates this directional shift. This level becomes a critical reference point as it marks where the market's intent changed, establishing a new delivery bias.


Key Components/Features

  1. CiSD Opening Price
  2. The opening price of the candle that triggers the change in state delivery. This price level acts as:

    • A pivot point for the new directional bias
    • A potential invalidation level for the current delivery state
    • A reference for measuring premium/discount zones

  3. Delivery Direction
  4. Once a CiSD is identified, the indicator determines the new market directive:

    • Bullish CiSD: Market now seeks premium inefficiencies and/or Buyside liquidity
    • Bearish CiSD: Market now seeks discount inefficiencies and/or Sellside liquidity

  5. Target Zones
  6. Based on the CiSD, the market will now pursue:

    • Premium Inefficiencies: Fair Value Gaps (FVG), imbalances, and unfilled orders above current price
    • Discount Inefficiencies: Fair Value Gaps (FVG), imbalances, and unfilled orders below current price
    • Liquidity Pools: Buyside (above) or Sellside (below) concentrations
    • Combination Targets: Both inefficiencies and liquidity on the same side

Features

The indicator displays:

  1. CiSD Level Line: Horizontal line at the opening price where state change occurred.
  2. Directional Arrow: Visual indicator showing new delivery direction.
  3. Color Coding:
    • -Bullish CiSD: Blue/Green tones
    • -Bearish CiSD: Red/Orange tones
  4. Label: Text showing "CiSD" with timestamp and price level

Pricing

Rent it to try CiSD in live market conditions, or buy once and keep it.

Monthly

$40
per month

Lower initial commitment for traders who want to test the product over a shorter period.

Best value

Lifetime

$100
one-time purchase

Own the current product permanently instead of paying a recurring monthly fee.

A free demo is available so you can verify the indicator's behaviour on your charts before purchasing.


Frequently Asked Questions

  • What is CiSD?
  • CiSD (Change in State Delivery) identifies a transition from one directional delivery state to the opposite state, according to the indicator's defined methodology.
  • How does CiSD work?
  • CiSD monitors price action for a change in delivery state. When the conditions are met, it marks the opening price of the candle that initiated the transition and indicates the new delivery direction.

  • Is CiSD a buy/sell signal?
  • No, CiSD is primarily a market-analysis reference. Evaluate a CiSD event alongside liquidity, market structure, displacement, FVGs/imbalance, and your own execution model.
  • Does CiSD predict reversals?
  • No. A CiSD identifies a change in delivery according to its rules. It does not guarantee that price will reverse or continue in a particular direction.
  • Can I use CiSD with ICT/SMC concepts?
  • Yes. It's designed to complement workflows involving liquidity, displacement, FVGs/imbalance, market structure, and PD arrays.
  • Can I use it for historical analysis?
  • Yes. You can display historical CiSD events so traders can study previous delivery transitions and subsequent price action.
  • Does it work on all timeframes?
  • Yes. CiSD is designed to work across all timeframes.
  • Does the indicator repaint?
  • No. The indicator does not repaint.
  • Which Markets does it work on?
  • CiSD works across various financial markets, including forex, stocks, and futures.
  • Which timeframes?
  • It works on all timeframes.
  • Can I use the demo before buying?
  • Yes. The demo lets you verify the indicator's behaviour on your own charts before purchasing.
  • I think the indicator generated an incorrect CiSD. What should I do?
  • Please provide the following:
    • Chart screenshot
    • Symbol
    • Timeframe
    • Date/Time
    • Relevant candles
    • Expected result
    • Methodology/Reference used

    This allows the result to be investigated properly.


    Glossary of Terms

    • Liquidity: Areas where large numbers of pending orders are concentrated (typically above/below key price levels).
    • Buyside Liquidity: Concentration of buy-stop orders above current price (targets for bearish moves).
    • Sellside Liquidity: Concentration of sell-stop orders below current price (targets for bullish moves).
    • State Delivery: The market's current directional focus in seeking liquidity pools.
    • Premium Zone: Price area above a reference level (generally considered "expensive").
    • Discount Zone: Price area below a reference level (generally considered "cheap").
    • Inefficiency: Price imbalances or gaps where one-directional order flow dominated, leaving unfilled orders.

    ⚠️ Risk Disclaimer

    This indicator is a tool for market analysis and does not guarantee trading profits. Past performance does not indicate future results. Trading forex, stocks, and other financial instruments involves significant risk of loss and is not suitable for all investors. Always use proper risk management and never risk more than you can afford to lose. You should carefully consider your investment objectives, level of experience, and risk appetite before making any trading decisions.
    おすすめのプロダクト
    Heiken_Ashi_Bars - MT5用 高度なトレンド可視化ツール 概要 Heiken_Ashi_Bars は、市場のノイズを取り除き、真のトレンドを浮き彫りにするために設計された、強力で視覚的に直感的なカスタムインジケーターです。従来のローソク足チャートは不規則な動きが多く、ダマシのシグナルにつながることがよくあります。価格データを平均化することで、このインジケーターはプライスアクションを滑らかにし、トレンドの継続、反転、および利益の出るエントリーポイントを非常に簡単に見つけることができます。 主な機能と利点 究極のノイズリダクション: 小さな価格のスパイクや持ち合いのノイズをフィルタリングします。 明確な視覚的シグナル: 色分けされたバーにより、強気および弱気のモメンタムを一目で確認できます。 リペイントなし (No Repaint): バーが確定するとシグナルは固定され、過去のバーを再計算しません。 高度に最適化: ターミナルの遅延をゼロにするクリーンなコード。 多用途: すべての金融商品 (FX、インデックス、貴金属、仮想通貨) で完璧に機能します。 トレード方法 上昇
    RBreaker Gold Indicatorsは、金先物の短期日内取引戦略であり、トレンドフォローと日内反転の2つの取引手法を組み合わせたものです。トレンド相場での利益を捉えるだけでなく、相場が反転した際には迅速に利確し、その流れに沿ってポジションを反転させることができます。 この戦略は、アメリカの雑誌『Futures Truth』において、15年連続で最も収益性の高い取引戦略トップ10に選ばれた実績を持ち、非常に長いライフサイクルを誇り、現在も国内外で広く使用・研究されています。 本インディケーターは、2026年の金先物の値動きに対応し、14日間のATR指標に基づいて、ブレイクアウト係数A、観察係数B、リバーサル係数Rをより合理的な値で定義しています。非常に優れたインディケーターであり、安定的な年間収益を実現しています。ぜひおすすめします〜
    Multi-Timeframe Heiken Ashi (Smoothed with Dashboard) Professional Market Structure Visualization with Weighted Confluence Scoring Transform your trading with crystal-clear multi-timeframe analysis. This indicator combines smoothed Heiken Ashi candles with an intelligent weighted scoring system to give you unprecedented clarity in any market condition. YOUR TRADING QUESTIONS – ANSWERED INSTANTLY: 1. What's the REAL trend direction? Dashboard Reveals:   Higher timeframe (MN1, W1, D1, H4) trend a
    Price Magnet — Price Density and Attraction Levels Indicator Price Magnet is a professional analytical tool designed to identify key support and resistance levels based on statistical Price Density. The indicator analyzes a specified historical period and detects price levels where the market spent the most time. These zones act as “magnets,” attracting price action or forming a structural base for potential reversals. Unlike traditional Volume Profile tools, Price Magnet focuses on price-time d
    Chỉ báo này sẽ thông báo cho bạn nếu cấu hình xu hướng thành công. Tín hiệu theo xu hướng không nên được tăng theo, nhưng tín hiệu mua ở mức giá thấp theo mô hình giao dịch thông thường của bạn, hoặc tín hiệu bán ở mức giá tốt, là một lựa chọn rất tốt. Hãy thiết lập nó trên khung thời gian lớn hơn và theo dõi các khung thời gian nhỏ hơn, bám sát các xu hướng chính. Tôi thường thiết lập ba khung thời gian gần nhau nhất và không bao giờ đi ngược tín hiệu của INdicator này. INdicator   này không có
    STRICTLY FOR BOOM INDEX ONLY!!!!! Here I bring the Maximum Trend Arrows OT1.0 MT5 indicator. This indicator is made up of a combination of different trend indicators for entries and exits, for entries an orange arrow will paint on the chart below the current market and a red flag for closing of trades and it produces buy arrows only. When the orange arrow appears, it will appear along with it's sound to notify you. The 1H timeframe is recommended, don't use it anywhere else than on the 1H timefr
    GDS Renko Entry Helper - Free Renko Price Interaction Indicator for MetaTrader 5 GDS Renko Entry Helper is a free Renko price interaction indicator for MetaTrader 5. It helps traders highlight important areas where price reacts, slows down, returns to a zone or changes behavior around support and resistance. The tool is designed for manual Renko analysis. It does not generate buy or sell signals and does not tell the trader when to enter the market. Its purpose is to help focus attention on area
    What Is Trend Master Pro? Trend Master Pro   is a professional-grade trend trading indicator built for MetaTrader 5. It was designed with one goal in mind — to keep you on the right side of the market at all times by combining three powerful technical tools into a single, clean, easy-to-read display directly on your price chart. Instead of cluttering your screen with multiple separate indicators, Trend Master Pro fuses an   EMA Ribbon trend filter , a   ZigZag swing point engine , and a   breako
    HAS RSI Signal — SL/TP自動計算機能付き プロフェッショナル・トレンドインジケーター HAS RSI Signal は、信頼性の高いクラシックな手法と最新のノイズ除去アルゴリズムを融合させた強力なトレーディングツールです。 平均足スムーズド(Heiken Ashi Smoothed) と RSI を組み合わせることで、トレンドの転換点や買われすぎ・売られすぎ圏からの脱出タイミングを正確に捉え、明確なエントリーシグナルを提示します。 主な特徴: 二重のフィルタリング: 平均足スムーズドで市場の「ノイズ」を除去し、RSIで勢い(モメンタム)の強さを確認します。 損切り・利確ラインの自動計算: 単にシグナルを出すだけでなく、ボラティリティ( ATR )に基づいた最適なストップロス(SL) と テイクプロフィット(TP)を自動で算出します。 視覚的な分かりやすさ: シグナルはチャート上にカラーキャンドルとして表示されるため、一目でトレンドを把握でき、取引画面をスッキリと保てます。 充実の通知機能: アラート、音声、スマートフォンへのプッシュ通知機能を搭載。チャンスを逃すこと
    Structure King AI Signal Structure King AI Signal is a professional MetaTrader 5 trading indicator designed to help traders analyze market structure, trend direction, multi-timeframe confirmation and trade management from one clean dashboard. Key Features • Market Structure & Trend Analysis • BUY / SELL Signals • Multi-Timeframe (HTF) Confirmation • Entry Price Levels • Dynamic Stop Loss (SL) • TP1 / TP2 / TP3 Levels • ATR Volatility Analysis • ADX Trend Strength Filter • Adaptive Market Filter
    Footprint は、オーダーフロー(Order Flow)と出来高分析のためのインジケーターです。 クラスターレベルでの市場構造の特定、アクティビティの高い主要ゾーンの発見、そして設定ウィンドウを毎回開くことなくチャート上で直接フィルター操作を行うのに役立ちます。 Footprintインジケーターの機能 Bid x Ask、Deltaのクラスターチャート; チャート上のコントロールパネル; フィルター調整用のスライダー; Absorption; Initiative; Stacked Imbalances; Big Trades; dPOC / Dynamic Point of Control; Delta; サイドマーケットプロファイル; 累積デルタ(Cumulative Delta)。 主な利点 高密度のティックフローに対する高速な計算とデータ表示; チャート内管理 — 設定を開くことなく、主要モードとフィルターを直接切り替え可能; 重要な価格レベルとクラスターを強調するためのフィルタリング; シグナルの視覚的ハイライト:吸収、主導権、インバランス、大口取引; 日、週、または現
    This indicator can be considered as a trading system. It offers a different view to see the currency pair: full timeless indicator, can be used for manual trading or for automatized trading with some expert advisor. When the price reaches a threshold a new block is created according to the set mode. The indicator beside the Renko bars, shows also 3 moving averages. Features renko mode median renko custom median renko 3 moving averages wicks datetime indicator for each block custom notification
    Fabii Half Trend Baseline
    Fabien Georges Andre Guillemaud
    上位足のトレンドに逆らう取引をやめましょう。2本のベースライン、1つのチャート。リペイントなし。 どの通貨ペアでも、どの時間足でも。2分でチャートに表示。Strategy Tester で無料デモを試せます。 Get more indicators here Baselines, volatility filters and oscillators. No repaint. 必要な理由 チャート上のラインが緑になったので、あなたはエントリーします。その後、上位足を開くと、大きなトレンドは逆方向を向いています。シグナルは本物でした。しかし、その背景のトレンドはあなたの味方ではありませんでした。 大きなトレンドに逆らう取引は、そのたびにエントリーの優位性を失わせます。 得られるもの Fabii Half Trend Baseline は、現在の時間足のトレンドと上位足のトレンドを1つのチャートに表示します。ウィンドウを切り替えて全体像を確認する必要がなくなります。 上位足の2本目のベースラインがメインのラインの後ろに描かれるため、別のチャートを開かずに大きなトレンドが分かります。 ベ
    LuoMo Volume & Price Structure 8.98 A multi-function chart indicator for   MetaTrader 4 and MetaTrader 5 , designed to display key volume, volatility, sentiment, and price-structure information directly on the main chart. Main Features Volume and price-based Support & Resistance Volume spike and exhaustion signals ATR volatility expansion alerts Volume Profile with HVN and LVN Bullish and bearish sentiment distribution Developing or fixed POC VAH and VAL levels Supply and Demand zones Volume-wei
    CosmiCLab SMC FIBO CosmiCLab SMC FIBO is a professional trading indicator designed for traders who use Smart Money Concepts (SMC), market structure analysis and Fibonacci retracement levels. The indicator automatically detects market swings and builds Fibonacci levels based on the latest impulse movement. It also identifies market structure changes such as BOS (Break of Structure) and CHOCH (Change of Character), helping traders understand the current market direction. CosmiCLab SMC FIBO also pr
    Heiken Ashi Smoothed Strategy is a very simple but powerful system to get forex market trend direction. This indicator is actually 2 indicators in 1 pack, Heiken Ashi and Heiken Ashi Smoothed Moving Average both included. Because HA (Heiken Ashi) and HAS (Heiken Ashi Smoothed) are calculated in the same one system event with necessary buffers and loop only, so it is the FAST, OPTIMIZED and EFFICIENT HA having the combined indicator of MetaTrader 5. You can choose to display HA and HAS in the sam
    IC Flat Pro The True Math
    Aruncharan Ganapathy Sivakumar
    IC FLAT PRO – THE TRUE MATH   Early Adopter Pricing Secure IC FLAT PRO – THE TRUE MATH at the current launch price. Once the first 10 purchases  have been sold, the price will increase by USD 300 . Institutional-Grade Market Structure Analysis for MetaTrader 5 IC FLAT PRO – THE TRUE MATH is a premium institutional-grade market structure indicator developed for serious traders who demand precision, consistency, and high-quality trade opportunities. Built using advanced mathematical algorithms
    Smart Support And Resistance Indicator – Trade with Greater Clarity Take your technical analysis to the next level with Smart Support And Resistance Indicator for MetaTrader 5 , a powerful charting tool designed to help traders identify key market levels, analyze price action, and better understand market structure. Combining RSI-based price levels with dynamic support and resistance , this indicator brings essential technical analysis tools together in one clear and organized chart. Monitor imp
    Harraz Neural Scalper PRO – The Future of XAUUSD Scalping ​Experience the next generation of precision trading with the Harraz Neural Scalper System. ​Are you tired of cluttered charts and lagging signals? Harraz Neural Scalper v2.8 is not just an indicator; it’s a high-performance AI Neural HUD designed specifically for the fast-paced world of Gold (XAUUSD) scalping. ​Built with a surgical crossover logic and filtered by a 200-period Major Trend Engine, this system ensures you are always on th
    Crypto_Forex MT5用インジケーター「ハンマー&シューティングスターパターン」。リペイント不要、遅延なし。 - インジケーター「ハンマー&シューティングスターパターン」は、プライスアクショントレードに非常に強力なインジケーターです。 - このインジケーターは、チャート上で強気のハンマーパターンと弱気のシューティングスターパターンを検出します。 - 強気のハンマーパターン:チャート上に青い矢印シグナルを表示します(画像参照)。 - 弱気のシューティングスターパターン:チャート上に赤い矢印シグナルを表示します(画像参照)。 - PC, Mobile alerts. - インジケーター「ハンマー&シューティングスターパターン」は、サポートレベル/レジスタンスレベルと組み合わせるのに最適です。 高品質のトレーディングロボットとインジケーターをご覧になるにはここをクリックしてください! これは、このMQL5ウェブサイトでのみ提供されるオリジナル製品です。
    TL Method — Automatic Trendline Detection & Strength Indicator Tired of drawing trendlines manually? TL Method does it for you — automatically detecting, drawing, and scoring trendlines in real time. What it does: Scans up to 1000 bars to find valid support and resistance trendlines Scores each trendline by counting confirmed anchor touches Generates buy/sell signal arrows when price approaches strong trendlines Alerts you via popup, push notification, or sound — with smart cooldown to avoid spa
    Liquidity Order Blocks MT5 Liquidity Order Blocks MT5 is a professional visual indicator for MetaTrader 5 designed to help traders identify and monitor potential bullish and bearish liquidity areas directly on the chart. The indicator detects pivot-based order block zones and displays each zone with a structured visual breakdown of estimated bullish volume, bearish volume, relative strength and delta. Its purpose is to make liquidity areas easier to read, compare and monitor during market analys
    「調整可能なフラクタル」はフラクタル インジケーターの高度なバージョンで、非常に便利なトレーディング ツールです。 - ご存知のとおり、標準フラクタル MT5  インジケーターには設定がまったくありません。これはトレーダーにとって非常に不便です。 - 調整可能なフラクタルは、この問題を解決しました。必要な設定がすべて揃っています。 - インジケーターの調整可能な期間 (推奨値 - 7 以上)。 - 価格の高値/安値からの距離を調整可能。 - フラクタル矢印のデザインを調整可能。 - インジケーターにはモバイルおよび PC アラートが組み込まれています。 高品質のトレーディングロボットとインジケーターをご覧になるにはここをクリックしてください! これは、この MQL5 Web サイトでのみ提供されるオリジナル製品です。
    Titan Action HUD Titan Action HUD, MetaTrader 5 terminali içinde piyasa izlemeyi optimize etmek için tasarlanmış kapsamlı çok zaman dilimli analitik bir gösterge panelidir. Birden fazla dönemden alınan gerçek zamanlı teknik verileri tek bir ekrana toplayarak, çeşitli grafikler arasında sürekli geçiş yapma ihtiyacını ortadan kaldırır. Panel, piyasa ortamlarını sürekli tarar, yapısal trendleri, hacim metriklerini ve aktif işlem oturumlarını birleşik bir görsel matriks içinde gösterir. 6.10 sürümün
    Hunter Trend: Arrow Indicator for Binary Options Trading Hunter Trend is an arrow indicator designed for trading binary options (turbo options) on the M1 timeframe, allowing for short-term trading opportunities. How to Trade with this Tool: Signals may appear when a candlestick forms. Once such a signal appears, wait for the closure of that candlestick. Upon the opening of a new candlestick, open a trade for 1-2 candlesticks in the indicated direction. In this case, for 1-2 minutes. A blue dot
    Oracle Super Elliott Wave Elliott Wave chart helper for MetaTrader 5. The indicator reads swing pivots on three independent degrees (micro, intermediate, major) and tries to classify the latest structure as an impulse 1-2-3-4-5, a leading or ending diagonal, a zigzag or flat A-B-C, or a horizontal triangle A-B-C-D-E. Labels, channels, Fibonacci levels and optional entry arrows are drawn on the chart. A small panel can show the current count and the oscillator verdict. This is an analytical tool.
    Kalman Cone Forecast MT5 Adaptive forecast cone, trend pressure, and exhaustion detection in one clean trading panel. Kaman Cone Forecast is an adaptive predictive indicator for MetaTrader 5. It uses Kalman filter smoothing to reduce market noise, estimate current trend pressure, and project a forward price cone based on live volatility conditions. Instead of showing only a moving average line or a basic volatility band, Kalman Cone Forecast gives you a clearer answer to three important questi
    Order Book, known also as Market Book, market depth, Level 2, - is a dynamically updated table with current volumes of orders to buy and to sell specific financial instument at price levels near Bid and Ask. MetaTrader 5 provides the means for receiving market book from your broker, but in real time only, without access to its history. The indicator OrderBook Cumulative Indicator accumulates market book data online and visualizes them on the chart. In addition, the indicator can show the market
    Divergent Stochastic Filter II Catch Reversals Early, Filter Noise, Trade with Confidence The Edge: Why This Stochastic is Different  Every trader knows the Stochastic oscillator. But knowing when to trust its signals, that's the real challenge. The Divergent Stochastic Filter II transforms this classic indicator into a precision reversal detection system by adding critical elements: divergence intelligence, signal filtering and exhaustion detection.  While standard Stochastic oscillators fire s
    Oscillator trading signals - это динамический индикатор, определяющий состояние к продолжению тенденции роста или падению цены торгового инструмента и отсечению зон с нежелательной торговлей. Индикатор состоит из 2 линий осцилляторов. Медленная и быстрая сигнальная линия.  Шкала отображения перевернутая. Зоны вблизи 0 свидетельствуют о тенденции роста цены валютной пары. Зоны -100 свидетельствуют о падении цены валютной пары. На основном графике в виде стрелок отображается потенциально выгодные
    このプロダクトを購入した人は以下も購入しています
    Trend Sniper X
    Sarvarbek Abduvoxobov
    4.9 (41)
    Trend Sniper X は、トレードの方向性と潜在的な反転ポイントを明確かつ正確に特定するのに役立つ、MetaTrader 5 用のマルチタイムフレーム・トレンドフォロー指標です。 MT4用: https://www.mql5.com/en/market/product/193245 価格情報: 現在の価格はプロモーション価格であり、今後のアップデートや新機能のリリースに伴い変更される場合があります。 ボーナス特典: このインジケーター用の無料自動売買アシスタントEAを入手するには、購入後に an 著者(開発者)へメッセージをお送りください。 Code2Profit チャンネル マルチタイムフレーム分析で相場をマスターしよう! Trend Sniper X で勝率を最大化する方法:重要なルールとセッションのコツ 技術仕様 プラットフォーム MetaTrader 5 インジケータータイプ マルチタイムフレーム・トレンドインジケーター 操作タイムフレーム あらゆるチャートタイムフレームに対応。個別に選択可能な上位タイムフレーム (M1–MN1) を搭載 主要銘柄 FX、ゴールド (X
    伝説が帰ってきました:Entry Points Pro 10。 MQL5 Marketのトップ3に3年間入り続けた伝説的インジケーターの再始動です。 2つのバージョンで合計589件の高評価レビュー、毎日数千人のトレーダーが実際のトレードに使用し、デモのダウンロードは31,000件以上   MT4+MT5 。 私はこの5年間に寄せられたレビューをすべて読み、約束を並べる代わりに、その答えをバージョン10に組み込みました。1999年から相場に携わり、 誠実さ、自らの評判、そして顧客を大切にする 作者による製品です。 Entry Points Proのエントリーシグナルは、リペイント(再描画)を一切行いません。 そして今回初めて、これは作者の言葉ではなく検証可能な事実になりました。確定シグナルはローソク足の終値確定後にのみ表示され、自動テストで リペイントはゼロ と確認されています(EURUSD、XAUUSD、BTCUSDで2,486,568回の不変条件チェック、違反0件)。検証方法は公開されており、ストラテジーテスターでご自身で再現できます。 ご購入後は、必ずすぐにダイレクトメッセージでご
    Neuro Poseidon is a new indicator by Daria Rezueva. It combines precise trading signals with adaptive TP/SL levels - creating best possible trades as a result! Message me and get  Neuro Poseidon Assistant  as a gift to automize your trading process! What makes it stand out? 1. Proven profitability on all assets and timeframes 2. Only confirmed BUY and SELL signals present on the chart 3. Adaptive TP & SL levels generated by the software for each trade 4. Easy to understand - suitable for al
    M1 SNIPER は使いやすいトレーディングインジケーターシステムです。M1時間足向けに設計された矢印インジケーターです。M1時間足でのスキャルピングのためのスタンドアロンシステムとして、また既存のトレーディングシステムの一部としても使用できます。このトレーディングシステムはM1時間足での取引に特化して設計されていますが、他の時間足でも使用できます。元々、この手法はXAUUSDとBTCUSDの取引用に設計しましたが、他の市場においても役立つと考えています。 インジケーターのシグナルは、トレンドの方向と逆方向に取引できます。インジケーターのシグナルを利用して両方向に取引するのに役立つ特別な取引テクニックをご紹介します。この手法は、特別な動的なサポートとレジスタンスの価格帯を利用することに基づいています。 ご購入後、M1 SNIPER矢印インジケーターをすぐにダウンロードできます。さらに、M1 SNIPERツールのすべてのユーザーに、以下のスクリーンショットに表示されているApollo Dynamic SRインジケーターを無料で提供しています。この2つのインジケーターを組み合わせることで
    Gann Made Easy   は、ミスター・ギャンの理論を使用した取引の最良の原則に基づいた、プロフェッショナルで使いやすい外国為替取引システムです。 W・D・ガン。このインジケーターは、ストップロスとテイクプロフィットレベルを含む正確な買いと売りのシグナルを提供します。 PUSH通知を利用して外出先でも取引可能です。 ご購入後、取引方法の説明と優れた追加インジケーターを無料で入手するには、私にご連絡ください! おそらく、ギャンの取引手法についてはすでに何度も聞いたことがあるでしょう。通常、ギャンの理論は初心者のトレーダーだけでなく、すでにある程度の取引経験がある人にとっても非常に複雑なものです。なぜなら、ギャンの取引手法は理論的にはそれほど簡単に適用できるものではないからです。私はその知識を磨き、最良の原則を私の外国為替インジケーターに組み込むために数年を費やしました。 このインジケーターは非常に簡単に適用できます。必要なのは、それをチャートに添付し、簡単な取引推奨事項に従うだけです。このインジケーターは常に市場分析の仕事を行い、取引の機会を探します。適切なエントリーポイントを検
    ARIPoint
    Temirlan Kdyrkhan
    1 (4)
    ARIPoint is a powerful trading companion designed to generate high-probability entry signals with dynamic TP/SL/DP levels based on volatility. Built-in performance tracking shows win/loss stats, PP1/PP2 hits, and success rates all updated live. Key Features: Buy/Sell signals with adaptive volatility bands Real-time TP/SL/DP levels based on ATR Built-in MA Filter with optional ATR/StdDev volatility Performance stats panel (Success, Profit/Loss, PP1/PP2) Alerts via popup, sound, push, or email Cu
    Scalper Vault は、スキャルピングを成功させるために必要なすべてを提供するプロフェッショナルなスキャルピング システムです。このインジケーターは、外国為替およびバイナリー オプションのトレーダーが使用できる完全な取引システムです。推奨される時間枠は M5 です。 システムは、トレンドの方向に正確な矢印シグナルを提供します。また、トップとボトムのシグナルとギャン マーケット レベルも提供します。 インジケーターは、プッシュ通知を含むすべてのタイプのアラートを提供します。 インジケータの購入後にご連絡ください。私の個人的な取引の推奨事項と素晴らしいボーナス指標を無料で共有します! 幸せで有益な取引をお祈りします!
    トレーダーの皆さん、こんにちは! 多くの個人トレーダーは、動作の遅いウェブスクリプトに頼っています。真の収益性を実現するには、体系化されたフレームワークが必要です。 Astro AIインジケーターは、一般的なチャートオーバーレイではありません。これは、ターミナル上で直接動作する2つのエージェントを含む、コンパイル済みのニューラルネットワークです。 システムの具体的な技術は以下のとおりです。 1. エージェント1:アナリスト(グラフィカルニューラルネットワーク - GNN) 市場は孤立した価格バーではなく、相互に連結されたデータネットワークです。 機能:エージェント1は、グラフィカルニューラルネットワークを使用して、これらの複雑で非線形な関係をマッピングします。 利点:一般的なインジケーターは過去の移動平均しか考慮しませんが、当社のGNNは市場の深い構造的関係をリアルタイムで処理し、個人トレーダーの取引量が大きな影響を与える前に、隠れた相関関係を明らかにします。 2. エージェント2:エグゼキューター(近接戦略最適化 - PPO) パターン認識は、戦いの半分に過ぎません
    このインジケーターを購入された方には、以下の特典を 無料 で提供しています: 各トレードを自動で管理し、ストップロスとテイクプロフィットを設定し、戦略ルールに基づいてポジションを決済する補助ツール 「Bomber Utility」 様々な銘柄に合わせたインジケーターの設定ファイル(セットファイル) 「最小リスク」、「バランスリスク」、「待機戦略」 の3つのモードで使用できる Bomber Utility 用の設定ファイル このトレーディング戦略をすぐに導入・設定・開始できる ステップバイステップのビデオマニュアル ご注意: 上記の特典を受け取るには、MQL5のプライベートメッセージシステムを通じて販売者にご連絡ください。 オリジナルのカスタムインジケーター 「Divergence Bomber(ダイバージェンス・ボンバー)」 をご紹介します。これは、MACDのダイバージェンス(乖離)戦略に基づいた 「オールインワン」型のトレーディングシステム です。 このテクニカルインジケーターの主な目的は、価格とMACDインジケーターの間に発生するダイバージェンスを検出 し、将来の価格の動きを示
    Quantum TrendPulse を ご紹介します。これは、   SuperTrend   、   RSI   、および Stochastic のパワーを 1 つの包括的なインジケーターに組み合わせて、取引の可能性を最大限に引き出す究極の取引ツールです。精度と効率を求めるトレーダー向けに設計されたこのインジケーターは、市場のトレンド、勢いの変化、最適なエントリー ポイントとエグジット ポイントを自信を持って特定するのに役立ちます。 主な特徴: SuperTrend 統合: 現在の市場動向に簡単に追従し、収益性の波に乗ることができます。 RSI精度: 買われすぎと売られすぎのレベルを検出し、市場の反転のタイミングに最適で、SuperTrendのフィルターとして使用されます。 確率的精度: 確率的振動を活用して、変動の激しい市場で隠れたチャンスを見つけます。SuperTrend のフィルターとして使用されます。 マルチタイムフレーム分析:   M5 から H1 または H4 まで、さまざまなタイムフレームで市場を常に把握します。 カスタマイズ可能なアラート: カスタム取引条件が満たされ
    もう勘でトレードしなくていい。 エントリーのタイミング、決済の場所、相場がどちらに傾いているか、そのすべてが1つのチャートで分かります。 RelicusRoad Proは、20種類近くのツールを1つのインジケーターにまとめました。自分のトレードスタイルに合うツールだけをオンにできます。 エントリーは明確に。決済も明確に。すべてのチャートに計画を。 心当たりはありませんか? 買った途端、1分もしないうちに価格が逆行する。 早めに決済してしまい、その後も値動きが続くのを眺めている。 チャートにインジケーターを5つ並べても、答えは5通りある。 ストップロスの位置は、なんとなく決めている。 開発した理由 私たちは18年間、FXを取引してきました。RelicusRoadの中核となるアルゴリズムは、最初は非公開で、私たちプロのトレーダー仲間のために作られました。 きっかけは個人的なものでした。毎回同じラインを手で引き、自分たちで決めたルールを破り、チャート上の重要な一点を見落とすことに、私たちは疲れていたのです。 私たちにとって効いたのは一貫性です。毎日同じ方法で相場を読み続け、それが体に染みつく
    ご紹介     Quantum Breakout PRO は 、ブレイクアウト ゾーンの取引方法を変革する画期的な MQL5 インジケーターです。 13年以上の取引経験を持つ経験豊富なトレーダーのチームによって開発されました。     クォンタム ブレイクアウト プロ   は、革新的でダイナミックなブレイクアウト ゾーン戦略により、あなたのトレーディングの旅を新たな高みに押し上げるように設計されています。 クォンタム ブレイクアウト インジケーターは、5 つの利益ターゲット ゾーンを備えたブレイクアウト ゾーン上のシグナル矢印と、ブレイクアウト ボックスに基づいたストップロスの提案を提供します。 初心者トレーダーにもプロのトレーダーにも適しています。 量子EAチャネル:       ここをクリック 重要!購入後、インストールマニュアルを受け取るためにプライベートメッセージを送ってください。 推奨事項: 時間枠: M15 通貨ペア: GBPJPY、EURJPY、USDJPY、NZDUSD、XAUUSD アカウントの種類: ECN、Raw、またはスプレッドが非常に低い R
    Volatility Master for MetaTrader is a real-time dashboard tool that scans up to  50 symbols  to identify high-volatility , trending markets instantly. With bullish/bearish signals, customizable alerts, and a user-friendly interface, it helps you avoid range-bound conditions and focus on high-probability trades. Clarity leads to confidence. Trade confidently and protect your capital effectively with this powerful dashboard. We don't offer free or bonus indicators in exchange of reviews from you.
    発見が困難で頻度が少ないため、分岐は最も信頼できる取引シナリオの1つです。このインジケーターは、お気に入りのオシレーターを使用して、通常の隠れた分岐点を自動的に見つけてスキャンします。 [ インストールガイド | 更新ガイド | トラブルシューティング | よくある質問 | すべての製品 ] 取引が簡単 通常の隠れた発散を見つけます 多くのよく知られている発振器をサポート ブレイクアウトに基づいて取引シグナルを実装します 適切なストップロスおよび利益レベルを表示します 設定可能なオシレーターパラメーター カスタマイズ可能な色とサイズ バー単位でサイズ別に分岐をフィルタリング パフォーマンス統計を実装します 電子メール/音声/視覚アラートを実装します 幅広い市場の見通しを提供するために、異なるオシレーターを使用して、干渉なしで同じチャートにインジケーターを何度もロードできます。このインジケーターは、次のオシレーターをサポートしています。 RSI CCI MACD オスマ 確率的 勢い 素晴らしい発振器 加速器発振器 ウィリアムズパーセントレンジ 相対活力指数 特に外国為替市場では、
    Quantum Direction は、市場の方向性を把握し、トレンドの初期変化を検出し、フィルタリングされたエントリーおよび決済シグナルを提供するために設計された、プロフェッショナルなトレンドフォロー型インジケーターです。 このインジケーターには、MQL5 Marketで無料提供されているプロフェッショナルな取引管理ツール Quantum Trade Assistant が含まれています。 Quantum Direction に直接接続し、有効なシグナルが表示されたときに自動的に取引を開始したり、設定された決済条件を満たしたときに取引を自動的に決済したりできます。 無料の Quantum Trade Assistant をこちらからダウンロード このインジケーターの主な特徴: マルチロジック・トレンド検出 — 複数の市場分析条件を組み合わせ、トレンドの始まりや方向転換の可能性を検出します。 セッションフィルター — 選択した取引セッションにシグナルを集中させ、市場の活動性とボラティリティが高い時間帯の取引機会を分析しやすくします。 上位時間足フィルター — 上位時間足を使用して市場の
    OrderFlux – MetaTrader 5用 オーダーフロー & フットプリント インジケーター OrderFlux は、MetaTrader 5向けのプロフェッショナルなオーダーフローおよびフットプリントインジケーターです。個々のローソク足を展開し、その内部で何が起こっているかを明らかにします:各価格レベルでの取引量を、アグレッシブな買い手と売り手に分けて表示します。これらのティックデータから、 Delta、Imbalance、Volume Profile、および Market Profile を含む完全なフットプリントチャートがリアルタイムで構築されます。 標準的なチャートには、始値、高値、安値、終値のみが表示されます。それは動きの結果であり、原因ではありません。OrderFluxはすべてのローソク足の微細構造を可視化し、最も重要な1つの質問に答えます: 「誰が実際にその動きを主導したのか?」 これにより、ローソク足の形状だけで推測するのではなく、実際の取引量からサポートとレジスタンスを読み取ることが可能になります。 フットプリントの表示内容 すべての価格レベルで、2つの数字
    M1 Quantum を使用したライブトレードシグナル : シグナル (取引は 自動的に Quantum Trade Assistant によって実行され、この製品に 無料 で含まれています。) 最新ニュース: バージョン1.64がリリースされました。現在、すべての取引で、関連するサポート/レジスタンスゾーンの後ろにStop Lossが設定されます。今回のバージョンでは、EAのパフォーマンスを向上させるためにSmart Close機能も改善されました。 8月9日から、ライブシグナルはバージョン1.64で稼働しています。 価格プラン: 現在価格: $169 (早期購入者向けオファー) 次回予定価格: $189 予定小売価格: $299 開発者からのお知らせ: ご購入後、 最新の推奨設定ファイル(Set File) 、運用アドバイス、および他の M1 Quantum ユーザーと交流できる VIPサポートグループ への招待をご希望の場合は、お気軽にご連絡ください。 よくある質問 - 設定ファイル - インストールガイド M1 Quantum は、M1専用のプロフェッショナルトレーディング
    Bill Williams Advanced is designed for automatic chart analysis using Bill Williams' "Profitunity" system. The indicator analyzes four timeframes at once. Manual (Be sure to read before purchasing) Advantages 1. Analyzes the chart using Bill Williams' "Profitunity" system. Signals are displayed in a table in the corner of the screen and on the price chart. 2. Finds all known AO and AC signals, as well as zone signals. Equipped with a trend filter based on the Alligator. 3. Finds "Divergence Bar
    CRT Pro is a complete Candle Range Theory toolkit for MetaTrader 5. It finds the CRT model on up to three timeframes and adds the tools needed to read it: higher-timeframe candles, structure shifts, fair value gaps, liquidity sweeps, a bias table and SSMT divergence. Every module can be switched on or off. 1. CRT Model A CRT model is built from two candles of the chosen CRT timeframe. C1 is the range candle. C2 is the sweep candle: it takes the high or the low of C1 and closes back inside the
    通貨強さウィザードは、取引を成功させるためのオールインワン ソリューションを提供する非常に強力な指標です。このインジケーターは、複数の時間枠のすべての通貨のデータを使用して、このまたはその外国為替ペアのパワーを計算します。このデータは、使いやすい通貨インデックスと通貨パワーラインの形式で表され、特定の通貨のパワーを確認するために使用できます。 必要なのは、取引したいチャートにインジケーターを接続することだけです。インジケーターは、取引する通貨の実際の強さを示します。このインジケーターは、トレンドに合わせて取引するときに有利に利用できる売買高の圧力の極値も示します。このインジケーターには、フィボナッチに基づく可能なターゲットも表示されます。 このインジケーターは、PUSH 通知を含むあらゆるタイプのアラートを提供します。 購入後ご連絡下さい。私の取引のヒントをあなたと共有し、素晴らしいボーナスインジケーターを無料で提供します! 幸せで有益な取引をお祈りします。
    ICT PO3 (Power of 3) AMD Protocol Framework Indicator True Time & Structure Integration   |  Non-Repainting | Real-Time  | Multi-Asset  | MT4 Version Available Full Setup Guide & Strategy Playbook: https://www.mql5.com/en/blogs/post/768683 The ICT Power of Three (PO3): The Complete Guide to Accumulation, Manipulation, and Distribution https://www.mql5.com/en/blogs/post/771729 MT4 Version: https://www.mql5.com/en/market/product/171742 Indicator Overview The ICT PO3 AMD Protocol Framework i
    現在33%オフ 初心者にもエキスパートトレーダーにも最適なソリューション このインジケーターは独自の機能と新しい公式を多数内蔵しており、ユニークで高品質かつ手頃な取引ツールです。このアップデートでは、2つの時間枠ゾーンを表示できるようになります。より長いTFだけでなく、チャートTFとより長いTF(ネストゾーンを表示)の両方を表示できます。すべてのSupply Demandトレーダーの皆さんのお気に召すはずです。:) 重要情報の公開 Advanced Supply Demandの可能性を最大化するには、 https://www.mql5.com/ja/blogs/post/720245 にアクセスしてください。   エントリーまたはターゲットの正確なトリガーポイントを正確に特定できれば取引がどのように改善されるか想像してみてください。新しい基盤となるアルゴリズムに基づいて構築されているため、買い手と売り手の間の潜在的な不均衡をさらに簡単に特定できます。これは、最も強い需要と供給のゾーンと、過去のパフォーマンス(古いゾーンを表示)がグラフィカルに表現されるためです。これらの機能は、最適な
    SUPERHEROインジケーターは、「オールインワン」方式に基づいて設計された多通貨対応の取引システムです。このインジケーターは市場を独自に分析し、取引の開始および終了のタイミングに関するシグナルを提供します。ストップロス注文とテイクプロフィット注文を使用します。R:R比率は1:1です。 このシステムはスマートフォンにプッシュ通知を送信できるため、PCに縛られることなく「外出先」からでも取引を行うことができます。自己勘定取引を行う企業に最適です。 すべてのお客様への特典: このインジケーターをご購入いただいたすべてのお客様に、私から特別なユーティリティをプレゼントいたします。その内容は以下の通りです: 自動的にストップロス注文とテイクプロフィット注文を発注します 価格が目標水準に達すると、自動的に取引を決済します 指値注文による取引に対応しています 平均化取引モードに対応しています この優れた、しかも非常に便利なユーティリティをプレゼントとして受け取りたい場合は、SUPERHEROインジケーターをご購入後、直ちにMQL5プラットフォームのプライベートメッセージを通じて私までご連絡くださ
    CGE Trading Suite
    Carl Gustav Johan Ekstrom
    5 (2)
    Institutional-Grade Analytics for MT5 The full analytical edge of a professional trading desk, built into your MT5 chart. Standard retail platforms lack the depth required for professional market analysis. The CGE Trading Suite bridges this gap, transforming MetaTrader 5 into a comprehensive workspace. By integrating 22 proprietary modules into a single, unified chart interface, the suite eliminates fragmented analysis. It provides definitive clarity across market structure, timing, momentum,
    The Oracle Pro
    Ottaviano De Cicco
    5 (1)
    The Oracle Pro:MT5向け合成マルチタイムフレーム・バイアスエンジン ️ サマー・ローンチ・オファー — The Oracle Pro を 199 USD で(早期購入者向け)。価格は普及に応じて上昇します。最終価格 399 USD。 The Oracle Pro は、要求の高いプロのトレーダーのために作られた MetaTrader 5 向けのプレミアム・マルチタイムフレーム バイアスエンジン です。ひとつの問いに規律をもって答えます。すなわち、各タイムフレームの現在の方向バイアスは何か、その強さはどれほどか、そしてタイムフレーム同士はどれだけ一致しているか。すべては確定足のみで計算され、リペイントはありません。 The Oracle Pro はマルチファクター・コンセンサス・システムです。独自のインジケーターと最適化されたアルゴリズムを単一の高度なコンセンサス・ベクトルに統合し、それを単一のインジケーター・インスタンス内で現在足と上位足のスタックにわたって読み取ります。複数のチャートにばらばらのツールを積み重ねる代わりに、です。 これは Oracle コンセンサス手法
    SkyHammer Signal Pro Entry、SL、TP レベルを固定表示する、プロ仕様のノーリペイント・トレンドシグナルインジケーター SkyHammer Signal Pro は、明確で固定され、検証可能なシグナルを求めるトレーダー向けに設計された、構造的なトレンド・モメンタム系シグナルインジケーターです。 特に M1 と M5 などの短期時間足で最も効果を発揮します。 このインジケーターは、天井や底を予測するためのものではありません。シグナルを出す前に、確認された市場構造、トレンド方向、モメンタムの強さ、健全なボラティリティ、そしてターゲットまでの十分な値幅を確認します。 主な機能 固定シグナルメカニズム シグナルが確認されると、矢印、Entry、Stop Loss、TP1、TP2 の各レベルはチャート上に永久的に固定されます。 その後のローソク足の動きによって、シグナルが消えたり、移動したり、変更されたりすることはありません。 これにより、トレーダーは各シグナルを明確に確認でき、リアルタイム相場中にシグナルが消えるという一般的な問題を避けることができます。 完全な過去シ
    MANZANO FOOTPRINT ORDER FLOW Footprint, Order Flow and Volume Analysis for MetaTrader 5 Manzano Footprint Order Flow is an analytical indicator for MetaTrader 5 that brings together Footprint charts, Bid x Ask, Delta, Cumulative Delta (CVD), Imbalances, Volume Profile, VWAP, Market Depth and Time & Sales in an interactive environment. It allows traders to examine activity within individual candles, identify volume concentrations, compare buying and selling pressure, and analyse how market partic
    UZFX {SSS} スキャルピング・スマートシグナル v5.0 MT5は、変動の激しい市場において正確かつリアルタイムのシグナルを求めるスキャルパー、デイトレーダー、スイングトレーダー向けに設計された、リペイントのない高性能な取引インジケーターです。(UZFX-LABS)によって開発されたこのインジケーターは、価格行動分析、トレンド確認、スマートフィルタリングを組み合わせることで、すべての通貨ペアおよび時間枠において、高確率の売買シグナル、警告シグナル、トレンド継続の機会を生成します。 トレードの判断に迷うのはもうやめましょう。明確さ、正確さ、そして規律ある市場執行を求めるトレーダーのために設計された、体系的なシグナルシステムに従い始めましょう。 間違いなく、MQL5で入手可能な最高のインジケーターの一つです。絶対に見逃さないでください!!「スマートなトレーダーのためのスマートシグナル」 最新バージョン5.0がリリースされました。価格は予告なく最大499.99ドルまで値上がりする可能性がありますので、チャンスを逃さないようお早めにお求めください!! 購入を決める前に!無料トライアル
    Azimuth Pro
    Ottaviano De Cicco
    5 (7)
    Azimuth Pro V2:MT5向けシンセティック・フラクタル構造分析と確認済みエントリー 概要 Azimuth Pro は Merkava Labs によるマルチレベルスイング構造インジケーターです。4つのネストされたスイングレイヤー、スイングアンカーVWAP、ABCパターン検出、3タイムフレーム構造フィルタリング、そして確定バーでの確認済みエントリー — 1つのチャートで、ミクロスイングからマクロサイクルまでを網羅するワークフロー。 これはブラインドシグナル製品ではありません。ロケーション、コンテキスト、タイミングを重視するトレーダーのための構造ファーストワークフローです。 ️ サマーセール — 夏至とThe Oracle Proの発売を記念して、Azimuth Proが30%オフ。現在279 USD(通常399 USD)。期間限定の夏季オファー。 1. V2での変更点 シンセティック・マルチタイムフレームエンジン 上位タイムフレーム分析をMeridian Proと同じ独自のシンセティックアーキテクチャで一から再構築。よりクリーンなHTFコンテキスト、安定したライブ動作、
    PainX GainX Blue Spike Fusion AI Advanced Synthetic Index Spike Detection Indicator for MetaTrader 5 Discover potential spike setups with a clear, organized, and professional trading interface. PainX GainX Blue Spike Fusion AI is a specialized indicator designed for traders who monitor synthetic indices and want a structured way to observe potential price spike opportunities. The indicator combines signal monitoring, market-condition analysis, visual alerts, and event tracking in one convenient
    作者のその他のプロダクト
    IPDA and PD Ranges MT4
    Thank-god Avwerosuoghene Odukudu
    5 (1)
    IPDA AND PD RANGES. Interbank Price Delivery Algorithm (IPDA) Range Liquidity and trades in the FX market take place in a decentralized manner as banks, brokers and electronic communication networks (ECNs) interact with one another to set prices. In FX, and ECN is a trading platform or electronic broker that hosts bids and offers and transmit them to users worldwide. ECN broadcasts a price around the world as various participants leave orders to buy and sell. Banks provide streaming prices based
    CiSD MT4
    Thank-god Avwerosuoghene Odukudu
    IPDA and PD Ranges
    Thank-god Avwerosuoghene Odukudu
    IPDA AND PD RANGES. Interbank Price Delivery Algorithm (IPDA) Range Liquidity and trades in the FX market take place in a decentralized manner as banks, brokers and electronic communication networks (ECNs) interact with one another to set prices. In FX, and ECN is a trading platform or electronic broker that hosts bids and offers and transmit them to users worldwide. ECN broadcasts a price around the world as various participants leave orders to buy and sell. Banks provide streaming prices base
    フィルタ:
    刘华钦
    36
    刘华钦 2026.01.10 13:23 

    ユーザーは評価に対して何もコメントを残しませんでした

    Thank-god Avwerosuoghene Odukudu
    3962
    開発者からの返信 Thank-god Avwerosuoghene Odukudu 2026.01.10 14:28
    Hi there! Thank you for downloading the indicator.
    ​This tool is designed to represent complex concepts taught by InnerCircleTrader (ICT). If you are familiar with concepts such as PD Arrays and Liquidity Runs, you can use the indicator for additional confirmation. If you are not familiar with ICT, you can simply use it to identify a change in delivery once the price reaches your desired buy or sell levels.
    ​Please let me know if you are an ICT student or if you notice the indicator producing a signal that differs from what is shown in the videos.
    ​Regards,
    IKnow.
    レビューに返信