Elliott Wave Oscillator Divergence Indicator MT5
- Indicadores
- Eda Kaya
- Versão: 1.3
Elliott Wave Divergence Oscillator Indicator MetaTrader 5
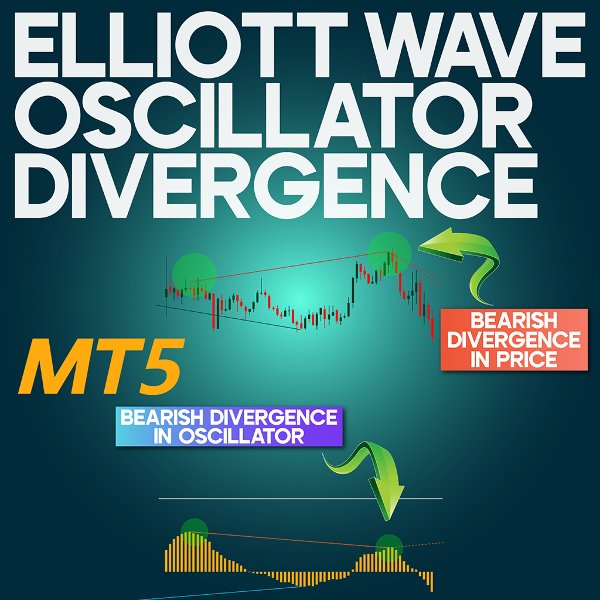
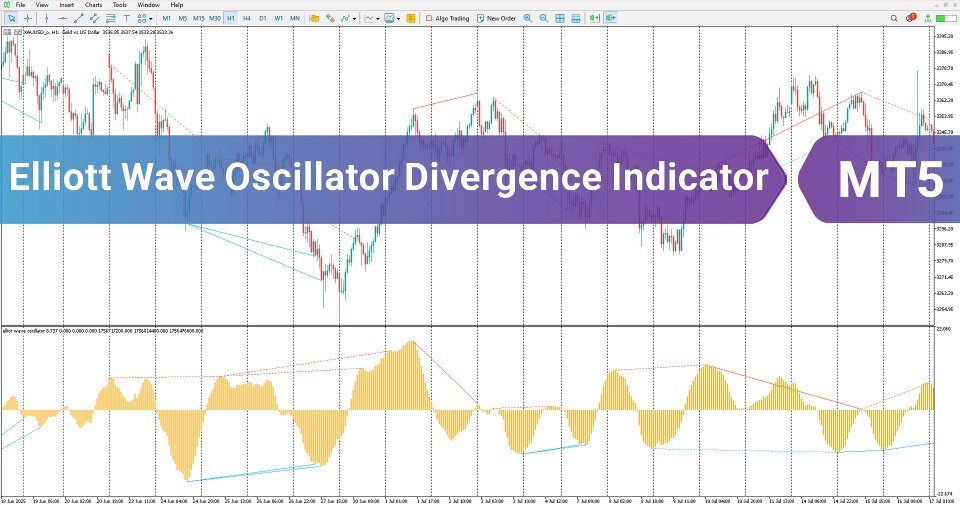
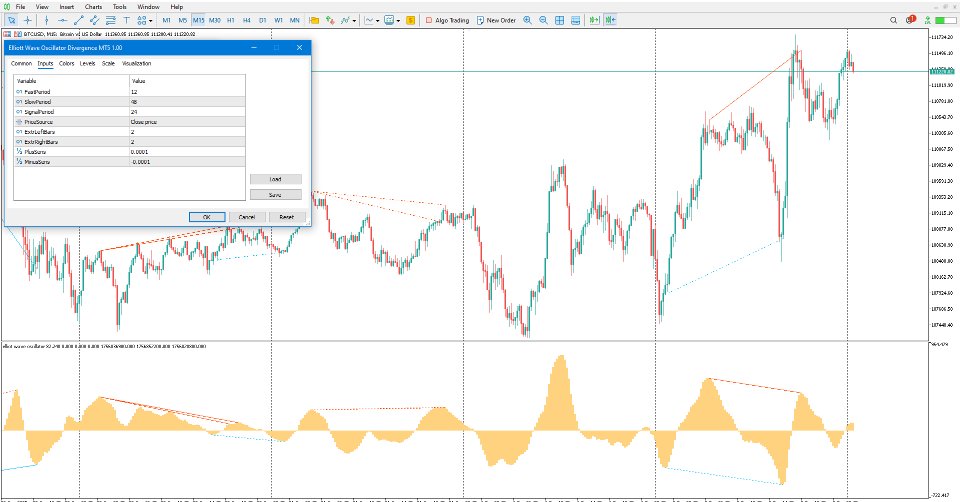
The Elliott Wave Oscillator Divergence Indicator is a specialized tool for technical traders, designed to identify and detect divergences between price and the oscillator in MetaTrader 5. This indicator detects two types of divergences – regular and hidden – and displays them on the chart through divergence lines, signaling either a trend reversal or continuation.
«Indicator Installation & User Guide»
MT5 Indicator Installation | Elliott Wave Oscillator Divergence Indicator MT4 | ALL Products By TradingFinderLab | Best MT5 Indicator: Refined Order Block Indicator for MT5 | Best MT5 Utility: Trade Assistant Expert TF MT5 | TP & SL Tool: Risk Reward Ratio Calculator RRR MT5 | Money Management: Easy Trade Manager MT5 | Trade Copier: Free Fast Local Trade Copier MT5
Elliott Wave Oscillator Divergence Indicator Table
| Category | Elliott Wave - Trading Tool - Oscillator |
| Platform | MetaTrader 5 |
| Skill Level | Beginner |
| Indicator Type | Lagging - Trend - Reversal |
| Timeframe | Multi-timeframe |
| Trading Style | Scalping - Day Trading - Intraday |
| Markets | Forex - Stocks - Indices - Crypto |
Indicator at a Glance
The Elliott Wave Oscillator Divergence Indicator is a specialized oscillator for detecting divergences. By plotting divergence lines on highs and lows, it identifies both regular (positive and negative) and hidden divergences directly on the chart.
Forex traders can apply this indicator to detect potential reversals at the end of a trend or confirm continuation signals, allowing them to enter buy or sell trades according to their strategies.
Bullish Trend
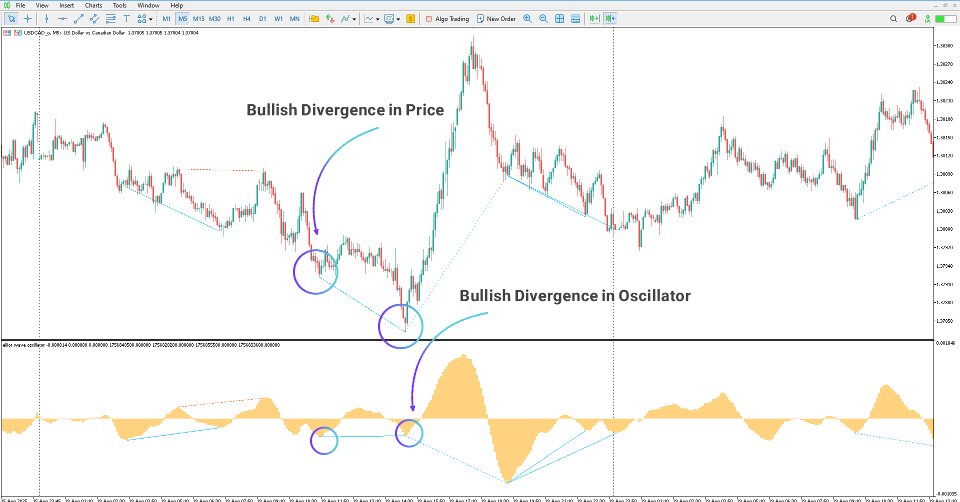
On the 5-minute USDCAD chart, the indicator identified bullish divergences at the lows. While price was forming lower lows, the oscillator was forming higher lows, indicating a potential market reversal. Traders can use this divergence at the end of a downtrend as a buy signal.
Bearish Trend
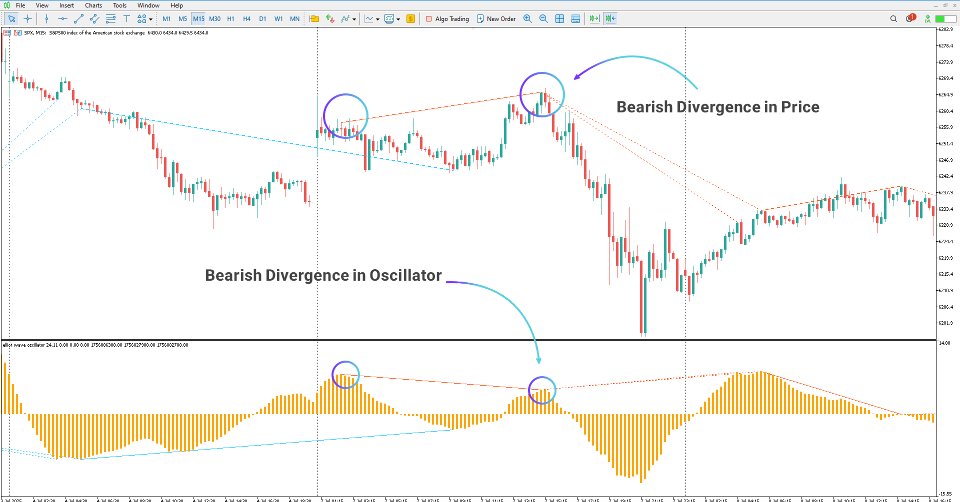
On the 15-minute S&P 500 index chart, the price was forming higher highs, while the oscillator showed lower highs. By applying the indicator, traders can spot divergences between price and oscillator. At the end of an uptrend, this signals a potential reversal, offering a sell opportunity.
Elliott Wave Oscillator Divergence Indicator Settings
The following settings are available in the indicator:
· Fast Period: Defines the short-term calculation period
· Slow Period: Defines the long-term calculation period
· Signal Period: Sensitivity coefficient for divergence detection; higher values make the indicator detect divergences using larger steps
· Price Source: Defines the basis for price calculation
· Extr Left Bars: Left-side bar confirmation for divergence
· Extr Right Bars: Right-side bar confirmation for divergence
· Plus Sens: Price sensitivity confirmation for bullish divergence
· Minus Sens: Price sensitivity confirmation for bearish divergence
Conclusion
The Elliott Wave Oscillator Divergence Indicator is a divergence detection tool that identifies highs and lows of price and oscillator, then draws divergences directly on the chart.
It signals:
· Bullish divergences at the end of downtrends
· Bearish divergences at the end of uptrends
· Hidden divergences (dashed lines) to confirm trend continuation.

