Smart Market Structure Simple MT4

Smart Market Structure Simple is a powerful indicator that helps traders identify market structure based on the Smart Money Concept (SMC). This indicator automatically detects Break of Structure (BOS), Change of Character (CHoCH), Fair Value Gaps (FVG), Order Blocks (OB), Liquidity Zones (LQZ), and key swing points Higher High (HH), Higher Low (HL), Lower High (LH), Lower Low (LL).

Main Objective: Assist traders in tracking institutional flow (Smart Money) and finding high-probability trade entries.

1. Key Components

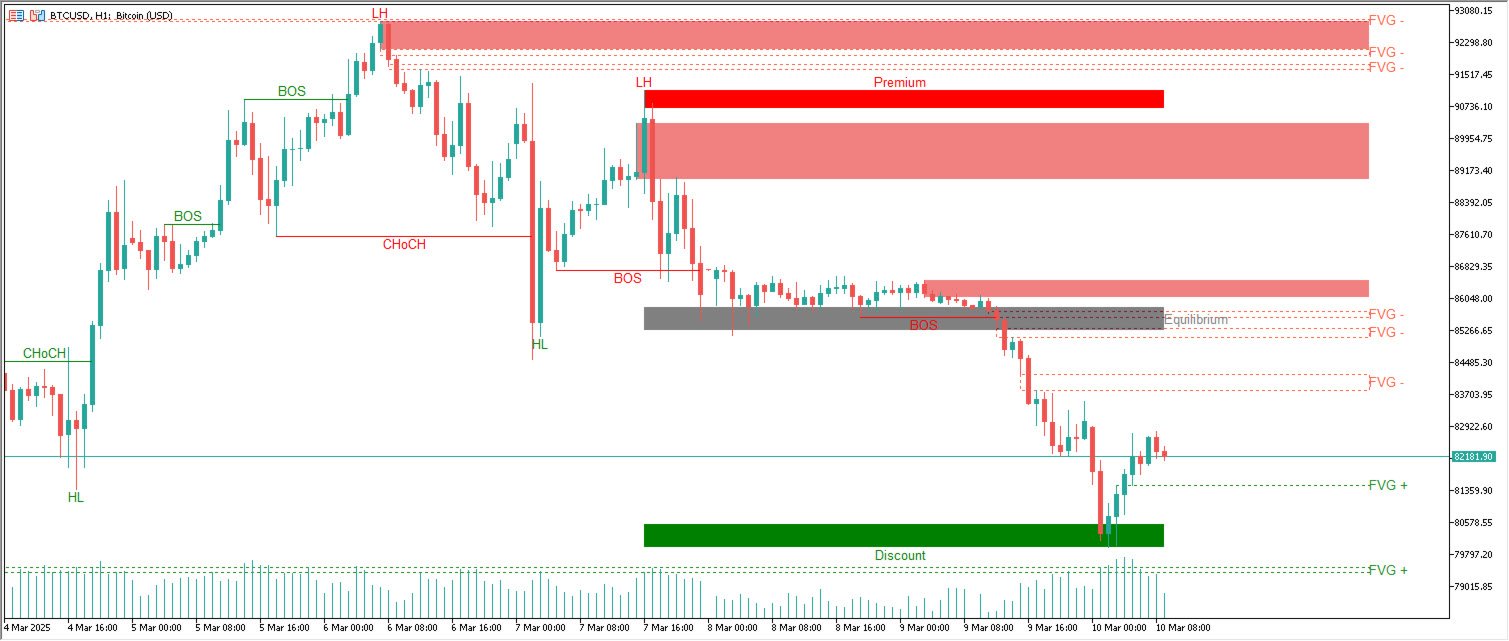
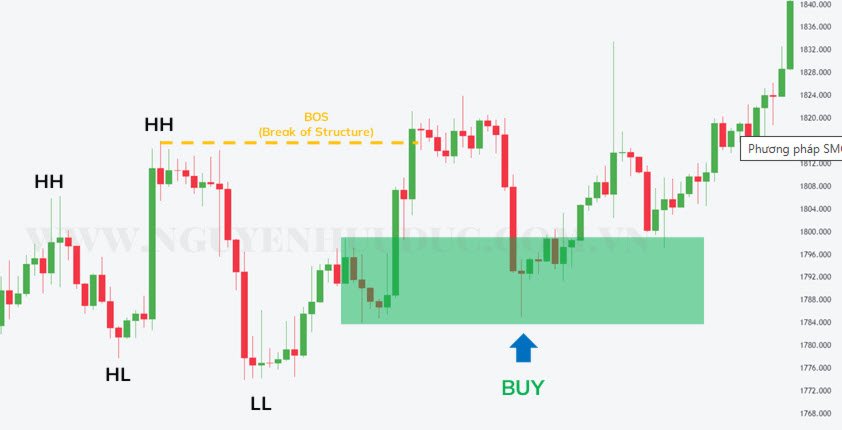
 1.1. Break of Structure (BOS) & Change of Character (CHoCH)

  • Break of Structure (BOS): Occurs when price breaks a key high or low, confirming a continuation of the trend.

    • Bullish BOS → Confirms an uptrend.
    • Bearish BOS → Confirms a downtrend.
  • Change of Character (CHoCH): Signals a shift in market structure, indicating a possible trend reversal.

    • Bullish CHoCH → Potential shift from bearish to bullish.
    • Bearish CHoCH → Potential shift from bullish to bearish.

Usage:
- Use BOS to trade in the direction of the main trend.
- Use CHoCH to detect potential trend reversals.

 1.2. Fair Value Gaps (FVG)

Fair Value Gaps (FVG) are liquidity voids (Imbalances) created when price moves too quickly, leaving an area where orders were not sufficiently filled.

  • Bullish FVG → Price may use this area as support when retested.
  • Bearish FVG → Price may use this area as resistance when retested.

Usage:
-  Use FVG to identify retracement points before trend continuation.
-  Combine with OB and Liquidity Zones for optimal entry levels.

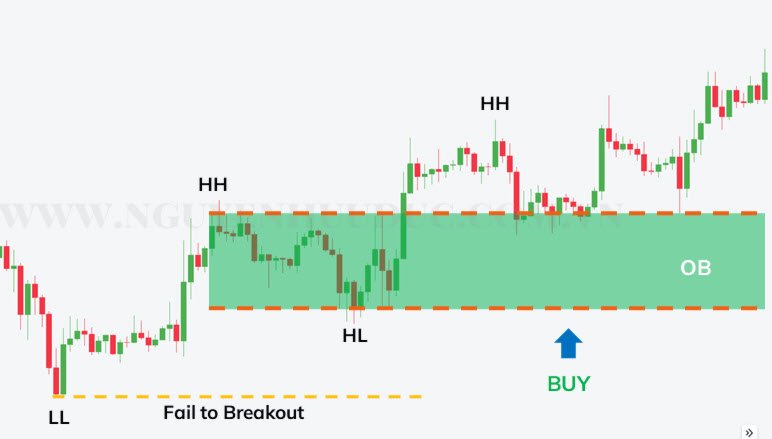
 1.3. Order Blocks (OB)

Order Blocks (OB) are key price zones where Smart Money placed large orders, often before a strong price movement.

  • Bullish OB → Strong support zone, where price may bounce up.
  • Bearish OB → Strong resistance zone, where price may drop.

Usage:
-  Enter trades at OBs combined with BOS/CHoCH.
-  Set Stop Loss below OB (for Buy) or above OB (for Sell) for better risk management.

 1.4. Liquidity Zones (LQZ)

Liquidity Zones (LQZ) are areas where Smart Money accumulates or drives price, commonly found at:

  • Equal Highs (EQLH) / Equal Lows (EQLL): Key liquidity zones where stop hunts occur before price continuation.
  • Swing High / Swing Low: Key points where Smart Money targets liquidity.

Usage:
-  Identify liquidity grab areas before major moves.
-  Avoid entering trades too early before liquidity is swept.

 1.5. Higher High (HH), Higher Low (HL), Lower High (LH), Lower Low (LL)

  • Uptrend: Higher High (HH) → Higher Low (HL)
  • Downtrend: Lower Low (LL) → Lower High (LH)
  • Sideways Market: Price consolidates without forming clear HH/LL structures.

Usage:
-  Combine with BOS to confirm trend direction.
-  Identify key support and resistance levels.

2. How to Use Smart Market Structure Simple Indicator

 Identifying the Main Trend (HTF Trend)

  1. Observe BOS on higher timeframes to determine if the market is in an uptrend or downtrend.
  2. Confirm with HH/HL or LL/LH structures.
  3. Use Premium/Discount Zones to find logical trade areas.

 Finding Trade Entries

BUY Setup:

  • Bullish BOS + Price retracing into Discount Zone.
  • Liquidity Grab (sweeping lows) + Bullish OB.
  • Confirm with CHoCH on lower timeframe.

SELL Setup:

  • Bearish BOS + Price retracing into Premium Zone.
  • Liquidity Grab (sweeping highs) + Bearish OB.
  • Confirm with CHoCH on lower timeframe.

3. Conclusion

Smart Market Structure Simple Indicator is a powerful tool for identifying market structure based on SMC principles.

Integrates BOS, CHoCH, FVG, OB, Liquidity Zones & HL/HH/LH/LL for precise trade signals.

Helps traders understand Smart Money behavior and trade in sync with institutional flow.

Use this indicator to enhance your trading strategy and improve your win rate! 


Produtos recomendados
O indicador SMC Venom Model BPR é uma ferramenta profissional para os traders que trabalham com o conceito Smart Money (SMC). Identifica automaticamente dois padrões principais no gráfico de preços: FVG   (Fair Value Gap) é uma combinação de três velas, em que existe um gap entre a primeira e a terceira velas. Forma uma zona entre níveis onde não há suporte de volume, o que geralmente leva a uma correção de preço. BPR   (Balanced Price Range) é uma combinação de dois padrões FVG que formam uma “
Daily Candle Predictor é um indicador que prevê o preço de fechamento de uma vela. O indicador destina-se principalmente ao uso em gráficos D1. Este indicador é adequado tanto para negociação forex tradicional quanto para negociação de opções binárias. O indicador pode ser usado como um sistema de negociação autônomo ou pode atuar como um complemento ao seu sistema de negociação existente. Este indicador analisa a vela atual, calculando certos fatores de força dentro do próprio corpo da vela, be
This is a new strategy for SUPPLY DEMAND areas It is based on a calculation using the tick volume to detect the big price action in market for both bear /bull actions this smart volume action candles are used to determine the supply and demand areas prices in between main supply and demand lines indicate sideway market  up arrows will be shown when prices moves above the main supply and the secondary supply lines Down arrows will be shown when prices moves below the main demand and the secondary
Description The Market Profile & Volume Profile Indicator is a powerful technical analysis tool designed to visualize market activity and price distribution over specific timeframes. Unlike standard technical indicators that focus solely on price over time, this indicator organizes price data to show where the market spent the most time (TPO) and where the most volume was traded (Volume Profile). It automatically calculates and displays key structural levels such as the Point of Control (POC) ,
We present you the indicator "Candle closing counter", which will become your indispensable assistant in the world of trading. That’s why knowing when the candle will close can help: If you like to trade using candle patterns, you will know when the candle will be closed. This indicator will allow you to check if a known pattern has formed and if there is a possibility of trading. The indicator will help you to prepare for market opening and market closure. You can set a timer to create a pre
Este é um indicador MTF dos níveis de suporte e resistência com base nos   extremos do indicador Advanced ZigZag Dynamic   e / ou   Extended Fractals   com etiquetas de preço (pode ser desativado). TFs mais altos podem ser selecionados para o modo MTF. Por padrão, os níveis são gerados com base nos pontos do indicador ZigZag. Os pontos indicadores fractais também podem ser usados em conjunto com o ZigZag ou em vez dele. Para simplificar o uso e economizar tempo de CPU, o cálculo é realizado uma
EARLY REMINDER: The Starting price is 65 price will rise soon up to 365$ and then 750$ after first 10 copies of sales. Grab this offer now! Introduction Hello, traders! Welcome to the demonstration of the Forex Beast Indicator , a comprehensive tool designed to assist aspiring traders in navigating the complexities of the forex market. This indicator incorporates seven essential components to provide a well-rounded trading experience: Moving Averages Colored Zones Support and Resistance Levels
Super Reversal Pattern
Parfait Mujinga Ndalika
Super Reversal Pattern Indicator Unlock the power of advanced pattern recognition with our Super Reversal Pattern Indicator. Designed for traders seeking precision and reliability, this indicator identifies one of the most effective reversal patterns in technical analysis, offering a significant edge in your trading strategy. Key Features: Non-Repainting Accuracy: Enjoy the confidence of non-repainting technology. Once a Super Reversal Pattern is detected, it remains static, providing consiste
VPPD:Ваш «Рентген» для графика. Простыми словами о сложном Представьте, что рынок — это большое здание. Обычные графики показывают вам только его фасад (цену). **VPPD** — это инструмент, который показывает вам чертежи несущих конструкций и подсчитывает, сколько людей зашли через парадный вход, а сколько вышли через черный. Это индикатор для MetaTrader 4, который показывает, где на самом деле находятся деньги крупных игроков и кто сейчас рулит рынком: покупатели или продавцы.   В чем суть
Noize Absorption Index MT4
Ekaterina Saltykova
5 (1)
Noize Absorption Index - is the manual trading system that measures the difference of pressure between bears forces and bulls forces. Green line - is a noize free index that showing curent situation. Zero value of index shows totally choppy/flat market.Values above zero level shows how powerfull bullish wave is and values below zero measures bearish forces.Up arrow appears on bearish market when it's ready to reverse, dn arrow appears on weak bullish market, as a result of reverse expectation. S
VR Cub
Vladimir Pastushak
VR Cub é um indicador para obter pontos de entrada de alta qualidade. O indicador foi desenvolvido para facilitar cálculos matemáticos e simplificar a busca por pontos de entrada em uma posição. A estratégia de negociação para a qual o indicador foi escrito tem provado a sua eficácia há muitos anos. A simplicidade da estratégia de negociação é a sua grande vantagem, o que permite que até mesmo os comerciantes novatos negociem com sucesso com ela. VR Cub calcula os pontos de abertura de posição e
Blahtech Market Profile
Blahtech Limited
4.53 (15)
Was: $249  Now: $99   Market Profile defines a number of day types that can help the trader to determine market behaviour. A key feature is the Value Area, representing the range of price action where 70% of trading took place. Understanding the Value Area can give traders valuable insight into market direction and establish the higher odds trade. It is an excellent addition to any system you may be using. Blahtech Limited presents their Market Profile indicator for the MetaTrader community. Ins
TWO PAIRS SQUARE HEDGE METER INDICATOR Try this brilliant 2 pairs square indicator It draws a square wave of the relation between your two inputs symbols when square wave indicates -1 then it is very great opportunity to SELL pair1 and BUY Pair2 when square wave indicates +1 then it is very great opportunity to BUY pair1 and SELL Pair2 the inputs are : 2 pairs of symbols         then index value : i use 20 for M30 charts ( you can try other values : 40/50 for M15 , : 30 for M30 , : 10 for H1 ,
Indicador de gestão de risco e monitoramento de limites para traders profissionais e contas de avaliação (Prop) Esta ferramenta apenas exibe, no gráfico, informações precisas de gestão de risco e limites, ajudando você a decidir com mais foco. O indicador não abre/fecha/modifica ordens e não interfere com Expert Advisors (EAs). Recursos Monitoramento do drawdown diário e total Calcula e exibe o drawdown diário e total com base no Saldo (Balance) ou no Patrimônio (Equity) (configurável). Mostra
SEM REPINTURA SEM REDESENHO SEM ATRASO Cada sinal é permanente. O que você vê é o que obtém. JÁ UTILIZADO POR TRADERS NO JAPÃO Vendido e usado ativamente por uma comunidade de traders de ouro no Japão. Elogiado pela facilidade de uso. Agora disponível mundialmente pela primeira vez. COMO FUNCIONA — 3 PASSOS SIMPLES Uma seta aparece no seu gráfico Verifique o preço TP, SL e relação R:R no painel Coloque sua ordem e espere Não apenas entrada — saída também Seta — Direção e p
Nosso indicador Basic Support and Resistance é a solução necessária para aumentar sua análise técnica.Este indicador permite que você forneça níveis de suporte e resistência no gráfico/ MT5 grátis Recursos Integração dos níveis de Fibonacci: Com a opção de exibir níveis de Fibonacci, juntamente com os níveis de suporte e resistência, nosso indicador fornece uma visão ainda mais profunda do comportamento do mercado e possíveis áreas de reversão. Otimização de desempenho: Com a opção de atualiz
The Th3Eng PipFinite indicator is based on a very excellent analysis of the right trend direction with perfect custom algorithms. It show the true direction and the best point to start trading. With StopLoss point and Three Take Profit points. Also it show the right pivot of the price and small points to order to replace the dynamic support and resistance channel, Which surrounds the price. And Finally it draws a very helpful Box on the left side on the chart includes (take profits and Stop loss
Um indicador técnico que calcula suas leituras nos volumes de negociação. Na forma de histograma, mostra o acúmulo da força do movimento do instrumento de negociação. Possui sistemas de cálculo independentes para direções de alta e baixa. Funciona em quaisquer instrumentos de negociação e prazos. Pode complementar qualquer sistema de negociação. O indicador não redesenha seus valores, os sinais aparecem na vela atual. É fácil de usar e não carrega o gráfico, não requer cálculos de parâmetros adi
Phase Analytics Pro: Advanced Cyclic Market Analyzer Phase Analytics Pro is a sophisticated technical tool designed for traders who prioritize mathematical precision over lag-heavy traditional indicators. Based on the principles of digital signal processing, this indicator decomposes price action into phase and quadrature components to identify the dominant market cycle. How it works: The algorithm calculates the instantaneous phase of the market, allowing it to distinguish between trending and
Awesome Oscillator by Bill Williams with the ability to fine-tune and replace the averaging algorithms of the indicator, which significantly expands the possibilities of using this oscillator in algorithmic trading and brings it closer in its properties to such an indicator as the MACD. To reduce price noise, the final indicator is processed with an additional Smooth averaging. The indicator has the ability to give alerts, send mail messages and push signals when the direction of movement of th
Indicador Crypto_Forex "Morning Star pattern" para MT4. - O indicador "Morning Star pattern" é um indicador muito poderoso para negociação de Price Action: sem repintura, sem atraso. - O indicador detecta padrões Morning Star otimistas no gráfico: sinal de seta azul no gráfico (veja as imagens). - Com alertas para PC, celular e e-mail. - Também seu irmão - o indicador bearish "Evening Star pattern" está disponível (siga o link abaixo). - O indicador "Morning Star pattern" é excelente para comb
ProEngulfing
Ashkan Hazegh Nikrou
4.5 (2)
Apresentamos o ProEngulfing - Seu Indicador Profissional de Padrão Engulf para MT4 Desbloqueie o poder da precisão com o ProEngulfing, um indicador de ponta projetado para identificar e destacar padrões Engulf qualificados no mercado de Forex. Desenvolvido para o MetaTrader 4, o ProEngulfing oferece uma abordagem meticulosa para o reconhecimento de padrões Engulf, garantindo que você receba apenas os sinais mais confiáveis para suas decisões de negociação. Como o ProEngulfing funciona: O ProEng
O indicador Crypto_Forex "Auto FIBO Pro" é uma ótima ferramenta auxiliar na negociação! - O indicador calcula e coloca automaticamente no gráfico os níveis de Fibonacci e as linhas de tendência locais (cor vermelha). - Os níveis de Fibonacci indicam áreas-chave onde o preço pode reverter. - Os níveis mais importantes são 23,6%, 38,2%, 50% e 61,8%. - Pode utilizá-lo para scalping de reversão ou para negociação de grelha de zona. - Existem muitas oportunidades para melhorar o seu sistema atual u
PZ Harmonacci Patterns
PZ TRADING SLU
3.17 (6)
Este é sem dúvida o indicador de reconhecimento automático de formação de preço harmônico mais completo que você pode encontrar para a MetaTrader Platform. Ele detecta 19 padrões diferentes, leva as projeções de Fibonacci tão a sério quanto você, exibe a Zona de Reversão Potencial (PRZ) e encontra níveis adequados de stop loss e take-profit. [ Guia de instalação | Guia de atualização | Solução de problemas | FAQ | Todos os produtos ] Detecta 19 formações harmônicas de preços diferentes Traça
EZZ Zig Zag MT4
Paulo Rocha
5 (1)
EZZ Elite Zig Zag is an indicator for the MetaTrader 4 terminal. This indicator traces the peak of the trend based on the market reversal, thus showing various opportunities in the financial market. EZZ Elite Zig Zag is a visual tool, intuitive, and easy to understand and use.  Test it Yourself by Downloading it for Free. Author Paulo Rocha all rights reserved
The Super Arrow Indicator provides non-repainting buy and sell signals with exceptional accuracy. Key Features No repainting – confirmed signals remain fixed Clear visual arrows: green for buy, red for sell Real-time alerts via pop-up, sound, and optional email Clean chart view with no unnecessary clutter Works on all markets: Forex, gold, oil, indices, crypto Adjustable Parameters TimeFrame Default: "current time frame" Function: Sets the time frame for indicator calculation Options: Can be set
Antabod Gamechanger
Rev Anthony Olusegun Aboderin
*Antabod GameChanger Indicator – Transform Your Trading!*   Are you tired of chasing trends too late or second-guessing your trades? The *Antabod GameChanger Indicator* is here to *revolutionize your trading strategy* and give you the edge you need in the markets!   Why Choose GameChanger? *Accurate Trend Detection* – GameChanger identifies trend reversals with *pinpoint accuracy*, ensuring you enter and exit trades at the optimal time.   *Clear Buy & Sell Signals* – No more guesswork! T
PZ Support Resistance
PZ TRADING SLU
3.33 (3)
Cansado de traçar linhas de suporte e resistência? A Resistência de suporte é um indicador de período múltiplo que detecta e plota automaticamente linhas de suporte e resistência no gráfico com um toque muito interessante: conforme os níveis de preços são testados ao longo do tempo e sua importância aumenta, as linhas se tornam mais espessas e mais escuras. [ Guia de instalação | Guia de atualização | Solução de problemas | FAQ | Todos os produtos ] Melhore sua análise técnica da noite para o d
Price vs Vwap
Pieter Gerhardus Van Zyl
Check out my German Pro Signal - https://www.mql5.com/en/signals/2354346 Price vs VWAP is a clean, non-repainting indicator that compares raw market price directly against a rolling Volume Weighted Average Price (VWAP) over a configurable time window. It plots two lines in a separate window: the real closing price and a dynamically calculated VWAP based on recent volume and price interaction. By adapting the VWAP lookback to the chart timeframe, it delivers a clear view of value versus executio
RTrends
Nikolay Likhovid
The RTrends indicator does two things: first, it automatically draws the layout of the price chart by plotting trend lines and, secondly, it produces bearish and bullish signals. The layout reflects the fractal nature of the market. Trends from different time horizons are applied simultaneously on the chart. Thus, from a single chart a trader can see trend lines of higher timeframes. The lines, depending on the horizon, differ in color and width: the older the horizon, the thicker the line is. T
Os compradores deste produto também adquirem
Scalper Inside PRO
Alexey Minkov
4.74 (69)
An exclusive indicator that utilizes an innovative algorithm to swiftly and accurately determine the market trend. The indicator automatically calculates opening, closing, and profit levels, providing detailed trading statistics. With these features, you can choose the most appropriate trading instrument for the current market conditions. Additionally, you can easily integrate your own arrow indicators into Scalper Inside Pro to quickly evaluate their statistics and profitability. Scalper Inside
Gann Made Easy
Oleg Rodin
4.83 (156)
Gann Made Easy é um sistema de negociação Forex profissional e fácil de usar, baseado nos melhores princípios de negociação usando a teoria do sr. W. D. Gann. O indicador fornece sinais precisos de COMPRA e VENDA, incluindo níveis de Stop Loss e Take Profit. Você pode negociar mesmo em movimento usando notificações PUSH. Entre em contato comigo após a compra para receber instruções de negociação e ótimos indicadores extras gratuitamente! Provavelmente você já ouviu muitas vezes sobre os métodos
M1 Sniper
Oleg Rodin
5 (20)
O M1 SNIPER é um sistema indicador de negociação fácil de usar. É um indicador de seta projetado para o período M1. O indicador pode ser usado como um sistema independente para scalping no período M1 e pode ser usado como parte do seu sistema de negociação existente. Embora este sistema de negociação tenha sido projetado especificamente para negociação no M1, ele também pode ser usado em outros períodos. Originalmente, desenvolvi este método para negociar XAUUSD e BTCUSD. Mas considero-o útil ta
Linear Trend Predictor - Um indicador de tendência que combina pontos de entrada e linhas de apoio de direção. Funciona com base no princípio de quebrar o canal de preço alto/baixo. O algoritmo do indicador filtra o ruído do mercado, tem em conta a volatilidade e a dinâmica do mercado. Capacidades do indicador  Utilizando métodos de suavização, mostra a tendência do mercado e os pontos de entrada para abrir ordens de COMPRA ou VENDA.  Adequado para determinar os movimentos de mercado de curto
O indicador " Dynamic Scalper System " foi desenvolvido para o método de scalping, operando dentro de ondas de tendência. Testado nos principais pares de moedas e ouro, é possível a compatibilidade com outros instrumentos de negociação. Fornece sinais para a abertura de posições de curto prazo ao longo da tendência, com suporte adicional para o movimento dos preços. O princípio do indicador: As setas grandes determinam a direção da tendência. Um algoritmo para gerar sinais de scalping sob a fo
Atomic Analyst
Issam Kassas
5 (4)
Primeiramente, vale ressaltar que este Indicador de Negociação não repinta, não redesenha e não apresenta atrasos, tornando-o ideal tanto para negociação manual quanto automatizada. Manual do utilizador: configurações, entradas e estratégia. O Analista Atômico é um Indicador de Ação de Preço PA que utiliza a força e o momentum do preço para encontrar uma vantagem melhor no mercado. Equipado com filtros avançados que ajudam a remover ruídos e sinais falsos, e aumentam o potencial de negociação.
Trend Lines PRO
Roman Podpora
5 (1)
LINHAS DE TENDÊNCIA PRO       Ajuda a entender onde o mercado está realmente mudando de direção. O indicador mostra inversões de tendência reais e pontos onde os principais participantes retornam ao mercado. Você vê     Linhas BOS     Análise de tendências e níveis-chave em prazos maiores — sem configurações complexas ou ruídos desnecessários. Os sinais não são repintados e permanecem no gráfico após o fechamento da barra. VERSÃO MT 5      -      Revela seu potencial máximo quando emparelhada co
NAM Order Blocks
NAM TECH GROUP, CORP.
3.67 (3)
Indicador de detecção de blocos de pedidos de multi-timeframe MT4. Características - Totalmente personalizável no painel de controle do gráfico, fornece interação completa. - Oculte e mostre o painel de controle onde quiser. - Detectar OBs em vários períodos de tempo. - Selecione a quantidade de OBs para exibir. - Interface de usuário de OBs diferente. - Filtros diferentes em OBs. - Alerta de proximidade OB. - Linhas ADR de alta e baixa. - Serviço de notificação (alertas de tela | not
GOLD Impulse with Alert
Bernhard Schweigert
4.67 (12)
Este indicador é uma super combinação dos nossos 2 produtos Advanced Currency IMPULSE with ALERT  +   Currency Strength Exotics . Funciona para todos os períodos de tempo e mostra graficamente impulso de força ou fraqueza para as 8 principais moedas mais um Símbolo! Este Indicador é especializado para mostrar a aceleração da força da moeda para quaisquer símbolos como Ouro, Pares Exóticos, Commodities, Índices ou Futuros. É o primeiro do seu género, qualquer símbolo pode ser adicionado à 9ª
MTF Supply Demand Zones
Georgios Kalomoiropoulos
4.82 (22)
Próxima geração de zonas automatizadas de oferta e demanda. Algoritmo novo e inovador que funciona em qualquer gráfico. Todas as zonas estão sendo criadas dinamicamente de acordo com a ação do preço do mercado. DOIS TIPOS DE ALERTAS --> 1) QUANDO O PREÇO ATINGE UMA ZONA 2) QUANDO UMA NOVA ZONA É FORMADA Você não recebe mais um indicador inútil. Você obtém uma estratégia de negociação completa com resultados comprovados.     Novas características:     Alertas quando o preço atinge a zona d
Currency Strength Exotics
Bernhard Schweigert
4.88 (33)
ACTUALMENTE 20% DE DESCONTO ! A melhor solução para qualquer novato ou comerciante especializado! Este Indicador é especializado para mostrar a força da moeda para quaisquer símbolos como Pares Exóticos de Commodities, Índices ou Futuros. É o primeiro do seu género, qualquer símbolo pode ser adicionado à 9ª linha para mostrar a verdadeira força da moeda de Ouro, Prata, Petróleo, DAX, US30, MXN, TRY, CNH etc. Esta é uma ferramenta de negociação única, de alta qualidade e acessível, porque inco
MetaForecast M4
Vahidreza Heidar Gholami
5 (2)
MetaForecast prevê e visualiza o futuro de qualquer mercado com base nas harmonias nos dados de preços. Embora o mercado nem sempre seja previsível, se houver um padrão nos preços, o MetaForecast pode prever o futuro com a maior precisão possível. Em comparação com outros produtos similares, o MetaForecast pode gerar resultados mais precisos ao analisar as tendências do mercado. Parâmetros de entrada Past size (Tamanho do passado) Especifica o número de barras que o MetaForecast usa para criar
Super Reversal Indicator with Alert Visão Geral Super Reversal Indicator with Alert é uma ferramenta de trading multi timeframe projetada para identificar oportunidades de reversão de alta probabilidade no mercado, utilizando uma combinação de momentum do estocástico, zonas de oferta e demanda e sinais de rejeição de preço. O indicador ajuda os traders a detectar possíveis pontos de reversão no mercado através de sinais visuais claros e alertas em tempo real. Principais Funcionalidades Análise E
Introducing the Delta Volume Profile Indicator - Unleash the Power of Institutional Precision!  Technical Indicator: Are you ready to trade like the pros? The Delta Volume Profile Indicator is no ordinary tool. It’s a high-precision, cutting-edge indicator that puts the power of institutional-grade trading in your hands. This unique indicator analyses delta volume distribution in real-time, revealing the market's hidden buy/sell imbalances that the biggest financial institutions rely on to antic
Order Block Hunter
Noha Mohamed Fathy Younes Badr
5 (10)
Order block hunter indicator is the best indicator for  hunt the order blocks that area where there has been a large concentration of limit orders waiting to be executed Order blocks are identified on a chart by observing previous price action and looking for areas where the price experienced significant movement or sudden changes in direction .This indicator does that for you by using very complicated codes and helps you to take the best areas To buy and sell because it make marks at the best a
Dynamic Forex28 Navigator
Bernhard Schweigert
4.43 (7)
Dynamic Forex28 Navigator - A ferramenta de negociação Forex de última geração. ATUALMENTE 49% DE DESCONTO. Dynamic Forex28 Navigator é a evolução dos nossos indicadores populares de longa data, combinando o poder de três em um: Indicador Advanced Currency Strength28 (695 avaliações) + Advanced Currency IMPULSE com ALERTA (520 avaliações) + Sinais CS28 Combo (Bônus). Detalhes sobre o indicador https://www.mql5.com/en/blogs/post/758844 O que o Next-Generation Strength Indicator oferece?  Tudo
Advanced Supply Demand
Bernhard Schweigert
4.91 (299)
Atualmente com 40% de desconto! A melhor solução para qualquer Trader Novato ou especialista! Este indicador é uma ferramenta de negociação exclusiva, de alta qualidade e acessível porque incorporamos uma série de recursos proprietários e uma nova fórmula. Com esta atualização, você poderá mostrar fusos horários duplos. Você não só será capaz de mostrar um TF mais alto, mas também mostrar ambos, o TF do gráfico, MAIS o TF mais alto: MOSTRANDO ZONAS ANINHADAS. Todos os traders de Oferta e Demanda
RFI levels PRO
Roman Podpora
5 (1)
O indicador mostra com precisão os pontos de reversão e as zonas de retorno de preço onde o   Principais players . Você identifica onde novas tendências estão se formando e toma decisões com máxima precisão, mantendo o controle sobre cada negociação. VERSION MT5     -     Revela seu potencial máximo quando combinado com o indicador   TREND LINES PRO. O que o indicador mostra: Estruturas de reversão e níveis de reversão com ativação no início de uma nova tendência. Exibição dos níveis de   TAKE
Adaptive Volatility Range [AVR] is a powerful tool for identifying key trend reversal points. AVR accurately reflects the Average True Range (ATR) of volatility, taking into account the Volume-Weighted Average Price (VWAP). The indicator adapts to any market volatility by calculating the average volatility over a specific period, ensuring a stable rate of profitable trades. You receive not just an indicator but a professional automated trading system , AVR-EA . Advantages: Automated Trading Sys
TPSpro RFI Levels
Roman Podpora
4.86 (28)
INSTRUÇÕES RUS  /  INSTRUÇÕES   ENG  /  Versão MT5 Principais funções: Exibe zonas ativas de vendedores e compradores! O indicador exibe todos os níveis/zonas de impulso iniciais corretos para compras e vendas. Quando esses níveis/zonas são ativados, onde a busca por pontos de entrada começa, os níveis mudam de cor e são preenchidos com cores específicas. Setas também aparecem para uma percepção mais intuitiva da situação. LOGIC AI - Exibição de zonas (círculos) para busca de pontos de entrada
BTMM State Engine Pro is a MetaTrader 4 indicator for traders who use the Beat The Market Maker approach: Asian session context, kill zone timing, level progression, peak formation detection, and a multi-pair scanner from a single chart. It combines cycle state logic with a built-in scanner dashboard so you do not need the same tool on many charts at once. What it does Draws the Asian session range; session times can follow broker server offset or be set in inputs. Tracks level progression (L
TrendLine PRO MT4
Evgenii Aksenov
4.83 (167)
The Trend Line PRO indicator is an independent trading strategy. It shows the trend change, the entry point to the transaction, as well as automatically calculates three levels of Take Profit and Stop Loss protection. Trend Line PRO is perfect for all Meta Trader symbols: currencies, metals, cryptocurrencies, stocks and indices. The indicator is used in trading on real accounts, which confirms the reliability of the strategy. Robots using   Trend Line PRO   and real Signals can be found here:   
Currency Strength Wizard é um indicador muito poderoso que fornece uma solução completa para uma negociação bem-sucedida. O indicador calcula o poder deste ou daquele par forex usando os dados de todas as moedas em vários intervalos de tempo. Esses dados são representados em uma forma de índice de moeda fácil de usar e linhas de energia de moeda que você pode usar para ver o poder desta ou daquela moeda. Tudo o que você precisa é anexar o indicador ao gráfico que deseja negociar e o indicador mo
Volatility Trend System - um sistema de negociação que dá sinais para entradas. O sistema de volatilidade fornece sinais lineares e pontuais na direção da tendência, bem como sinais para sair dela, sem redesenho e atrasos. O indicador de tendência monitora a direção da tendência de médio prazo, mostra a direção e sua mudança. O indicador de sinal é baseado em mudanças na volatilidade e mostra entradas no mercado. O indicador está equipado com vários tipos de alertas. Pode ser aplicado a vários i
Looking for a powerful yet lightweight swing detector that accurately identifies market structure turning points? Want clear, reliable buy and sell signals that work across any timeframe and any instrument? Buy Sell Arrow MT Swing is built exactly for that — precision swing detection made simple and effective. This indicator identifies Higher Highs (HH) , Higher Lows (HL) , Lower Highs (LH) , and Lower Lows (LL) with remarkable clarity. It is designed to help traders easily visualize market stru
Trend indicator AI
Ramil Minniakhmetov
4.49 (84)
O indicador Trend Ai é uma ótima ferramenta que irá melhorar a análise de mercado de um trader, combinando a identificação de tendências com pontos de entrada acionáveis e alertas de reversão. Este indicador permite que os usuários naveguem pelas complexidades do mercado forex com confiança e precisão Além dos sinais primários, o indicador Trend Ai identifica pontos de entrada secundários que surgem durante retrações ou retrações, permitindo que os comerciantes capitalizem as correções de preço
Auto Optimized Parabolic RSI: Avançado Motor de Momentum 3D A maioria dos indicadores de varejo falha porque depende de parâmetros estáticos que quebram no momento em que a volatilidade do mercado muda. O Auto Optimized Parabolic RSI resolve o problema de "obsolescência do indicador" recalculando continuamente a sua própria vantagem matemática, trazendo uma adaptação quantitativa de nível institucional diretamente para o seu terminal MT5. A Vantagem Principal: Otimização 3D em Memória Personaliz
Matrix Arrow Indicator MT4
Juvenille Emperor Limited
5 (3)
O Matrix Arrow Indicator MT4 é uma tendência única 10 em 1 seguindo um indicador multi-timeframe 100% sem repintura que pode ser usado em todos os símbolos/instrumentos: forex, commodities, criptomoedas, índices, ações. O Matrix Arrow Indicator MT4 determinará a tendência atual em seus estágios iniciais, reunindo informações e dados de até 10 indicadores padrão, que são: Índice de movimento direcional médio (ADX) Índice de canal de commodities (CCI) Velas clássicas de Heiken Ashi Média Móvel Di
Scalper Vault
Oleg Rodin
5 (36)
Scalper Vault é um sistema profissional de escalpelamento que fornece tudo o que você precisa para um escalpelamento bem-sucedido. Este indicador é um sistema de negociação completo que pode ser usado por comerciantes de forex e opções binárias. O período de tempo recomendado é M5. O sistema fornece sinais de seta precisos na direção da tendência. Ele também fornece sinais superiores e inferiores e níveis de mercado Gann. Os indicadores fornecem todos os tipos de alertas, incluindo notificações
Actualmente 40% OFF ! A melhor solução para qualquer novato ou comerciante especializado! Este software de painel de instrumentos está a funcionar em 28 pares de moedas. É baseado em 2 dos nossos principais indicadores (Advanced Currency Strength 28 e Advanced Currency Impulse). Dá uma grande visão geral de todo o mercado Forex. Mostra valores avançados de força da moeda, velocidade de movimento da moeda e sinais para 28 pares de divisas em todos os (9) períodos de tempo. Imagine como a sua n
Mais do autor
Fair Value Gaps
Cao Minh Quang
4.88 (64)
Fair Value Gap (FVG) Indicator Overview The Fair Value Gap (FVG) Indicator identifies inefficiencies in price action where an imbalance occurs due to aggressive buying or selling. These gaps are often created by institutional traders and smart money, leaving areas where price may later return to "fill" the imbalance before continuing its trend. Key Features: Automatic Detection of FVGs – The indicator highlights fair value gaps across different timeframes. Multi-Timeframe Support – View FVGs fr
FREE
Market Sessions Pre
Cao Minh Quang
4.67 (6)
The Market Sessions indicator is a popular tool among forex and stock traders for visually representing global trading sessions on a price chart. It highlights the time periods for major trading sessions — such as the Asian (Tokyo) , European (London) , and American (New York) sessions — directly on the chart. This helps traders identify when markets open and close, allowing for better decision-making based on session-specific trading behavior. - Asian Session (Default: 00:00-09:00) - London Se
FREE
Fair Value Gaps MT4
Cao Minh Quang
3.88 (8)
The Fair Value Gap (FVG) is a price range where one side of the market liquidity is offered, typically confirmed by a liquidity void on the lower time frame charts in the same price range. Price can "gap" to create a literal vacuum in trading, resulting in an actual price gap. Fair Value Gaps are most commonly used by price action traders to identify inefficiencies or imbalances in the market, indicating that buying and selling are not equal. If you're following the ICT Trading Strategy or Smart
FREE
MACD Indicator It has MACD line, Signal line, and Histogram. The Histogram has 4 colors based on Direction Above and Below the Zero Line, showing its movement direction as simple as possible. Allows Show MACD & Signal Line, Show Change In color of MACD   Line based on cross of Signal Line. Show Dots at Cross of MacD and Signal Line, Turn on and off Histogram. Enjoy your trading experience, and feel free to share your comments and reviews. If you are interested in this indicator, you might be i
FREE
The Market Sessions indicator is a popular tool among forex and stock traders for visually representing global trading sessions on a price chart. It highlights the time periods for major trading sessions — such as the   Asian (Tokyo) ,   European (London) , and   American (New York)   sessions — directly on the chart. This helps traders identify when markets open and close, allowing for better decision-making based on session-specific trading behavior. - Asian Session (Default: 00:00-09:00) - Lo
FREE
MACD Indicator It has MACD line, Signal line, and Histogram. The Histogram has 4 colors based on Direction Above and Below the Zero Line, showing its movement direction as simple as possible. Allows Show MACD & Signal Line, Show Change In color of   MACD     Line based on cross of Signal Line. Show Dots at Cross of MacD and Signal Line, Turn on and off Histogram. Enjoy your trading experience, and feel free to share your comments and reviews. If you are interested in this indicator, you might
FREE
Simple ICT Concepts
Cao Minh Quang
5 (2)
The Simple ICT Concepts Indicator is a powerful tool designed to help traders apply the principles of the Inner Circle Trader (ICT) methodology. This indicator focuses on identifying key zones such as liquidity levels, support and resistance, and market structure, making it an invaluable asset for price action and smart money concept traders. Key Features Market Structure: Market structure labels are constructed from price breaking a prior swing point. This allows a user to determine the curren
The latest version of Indicator is fully integrated into an all-in-one package, including: Fair Value Gaps (FVG).  Implied Fair Value Gap (IFVG).  OrderBlock (OB).  The options in the settings section are relatively easy to navigate, and you can even use them right away upon activation without encountering difficulties when using the default configuration. The indicator utilizes an algorithm to automatically draw and identify Order Blocks (OB), Fair Value Gaps (FVGs), and Implied Fair Value Gap
The Market Structure Trend Targets is a powerful trading indicator designed to give traders a clear, structured, and data-driven view of market momentum, breakouts, and key price reaction zones. Built on the principles of smart market structure analysis , it helps identify not only trend direction, but also precise breakout levels , trend exhaustion , and potential reversal zones — all with visual clarity and trader-friendly metrics. Key Features Breakout Points with Numbered Markers Track signi
Order Block Multi Timeframe The Order Block Multi Timeframe is a powerful tool for Smart Money Concept (SMC) traders, combining high-accuracy Order Block detection with real-time Break of Structure (BOS) and Change of Character (CHoCH) analysis across multiple timeframes. Smart Money Insight, Multi-Timeframe Precision This indicator automatically identifies institutional Order Blocks —key price zones where large players have entered the market—and plots them directly on your chart. It also track
The Area of Value Detection indicator automatically identifies and highlights key institutional price zones, including Liquidity areas, Order Blocks, and Fair Value Gaps (FVG). It is designed to help traders visualize market imbalances and potential points of interest (POIs) used by smart money participants. Main Features Liquidity Zones: Detects clusters of equal highs/lows and liquidity pools where stop orders are likely accumulated. Order Blocks: Highlights potential bullish and bearish or
Smart Market Structure Simple is a powerful indicator that helps traders identify market structure based on the Smart Money Concept (SMC) . This indicator automatically detects Break of Structure (BOS), Change of Character (CHoCH), Fair Value Gaps (FVG), Order Blocks (OB), Liquidity Zones (LQZ), and key swing points Higher High (HH), Higher Low (HL), Lower High (LH), Lower Low (LL) . Main Objective: Assist traders in tracking institutional flow ( Smart Money ) and finding high-probability trade
The   Market Structure Signal   indicator is designed to detect   Change of Character (CHoCH) and Break of Structure (BOS) in price action, helping traders identify potential trend reversals or continuations. It combines market structure analysis with volatility (ATR) to highlight possible risk/reward zones, while also supporting multi-channel alerts so that no trading signal is missed. Interpretation Trend Analysis : The indicator’s trend coloring, combined with BOS and CHoCH detection, provide
Automatically detect bullish or bearish order blocks to optimize your trade entries with our powerful indicator. Ideal for traders following ICT (The Inner Circle Trader). Works with any asset type, including cryptocurrencies, stocks, and forex. Displays order blocks on multiple timeframes, from M2 to W1. Alerts you when an order block is detected, migrated, or a higher timeframe order block is created/migrated. Perfect for both scalping and swing trading in Smart Money Concepts.  Enhanced by st
The   Linear Regression Oscillator (LRO)   is a technical indicator based on linear regression analysis, commonly used in financial markets to assess the momentum and direction of price trends. It measures the distance between the current price and the value predicted by a linear regression line, which is essentially the best-fit line over a specified period. Here’s a breakdown of how it works and its components: Key Components of the Linear Regression Oscillator Linear Regression Line (Best-Fit
The   Simple  ICT Concepts Indicator   is a powerful tool designed to help traders apply the principles of the   Inner Circle Trader (ICT)   methodology. This indicator focuses on identifying key zones such as liquidity levels, support and resistance, and market structure, making it an invaluable asset for price action and smart money concept traders. Key Features Market Structure : Market structure labels are constructed from price breaking a prior swing point. This allows a user to determine t
This Simple Smart Money Concepts indicator displays real-time market structure (internal & swing BOS / CHoCH), order blocks, premium & discount zones, equal highs & lows, and much more...allowing traders to automatically mark up their charts with widely used price action methodologies. "Smart Money Concepts" (SMC) is used term amongst price action traders looking to more accurately navigate liquidity & find more optimal points of interest in the market. Trying to determine where institutional
The Pure Price Action ICT Tools indicator is designed for pure price action analysis, automatically identifying real-time market structures, liquidity levels, order & breaker blocks, and liquidity voids. Its unique feature lies in its exclusive reliance on price patterns, without being constrained by any user-defined inputs, ensuring a robust and objective analysis of market dynamics. Key Features Market Structures A Market Structure Shift, also known as a Change of Character (CHoCH), is a pivot
Multiple Non-Linear Regression MT4 This indicator is designed to perform multiple non-linear regression analysis using four independent variables: close, open, high, and low prices. Here's a components and functionalities: Inputs: Normalization Data Length: Length of data used for normalization. Learning Rate: Rate at which the algorithm learns from errors. Show data points: Show plotting of normalized input data(close, open, high, low) Smooth?: Option to smooth the output. Smooth Length: Lengt
The Market Structure with Inducements & Sweeps indicator is a unique take on Smart Money Concepts related market structure labels that aims to give traders a more precise interpretation considering various factors. Compared to traditional market structure scripts that include Change of Character (CHoCH) & Break of Structures (BOS) -- this script also includes the detection of Inducements (IDM) & Sweeps which are major components of determining other structures labeled on the chart. SMC & pri
Unicorn Model ICT Indicator — Smart Trading with Precision The   Unicorn Model ICT Indicator   is a powerful and intelligent tool designed for traders who follow   Smart Money Concepts (SMC)   and   Inner Circle Trader (ICT)   methodologies. This indicator simplifies complex price action by visually identifying key market structures and providing high-probability trade setups. Key Features: A Bullish Unicorn Pattern A Lower Low (LL), followed by a Higher High (HH) A Fair Value Gap (FVG), overla
The   Quasimodo Pattern Indicator  is no more difficult than the Head and Shoulders. Still, only a few traders know about it, and some even confuse one with the other. However, this is not a reason to avoid this tool in your forex trading strategy.    Features: Automatic Detection:   The indicator automatically scans for valid QM patterns across any timeframe, reducing the need for manual chart analysis. Visual Highlights:   Clear and customizable on-chart drawing of shoulders, heads, and breako
Order Block Multi Timeframe The   Order Block Multi Timeframe   is a powerful tool for Smart Money Concept (SMC) traders, combining high-accuracy   Order Block detection   with real-time   Break of Structure (BOS)   and   Change of Character (CHoCH)   analysis across multiple timeframes. Smart Money Insight, Multi-Timeframe Precision This indicator automatically identifies   institutional Order Blocks —key price zones where large players have entered the market—and plots them directly on your ch
Rectangle Trading Custom   is a powerful technical analysis tool designed for price action and range-based traders. It allows users to define consolidation zones and receive alerts when the price breaks out of these zones or approaches trendlines drawn on the chart. Rectangles and Trendlines will be extended into future with one click. Rectangle point size, name and prices will be displayed around rectangle. Key Features: Draw Trading Zones (Rectangle Zones) Users can manually draw rectangles t
SMC Analyzer Single-Timeframe (STF) for MT4 The   SMC Analyzer STF  MT4  is a powerful, single-timeframe Smart Money Concepts (SMC) analysis tool designed for precision trade confirmations based on core SMC components. It evaluates market structure across four levels of confirmation using elements such as   Break of Structure (BOS), Change of Character (CHoCH), Order Blocks (OB), Fair Value Gaps (FVGs), Liquidity Zones , and   Higher Timeframe Trend Bias . Each level has configurable elements (
The Fibonacci Confluence Toolkit  is a powerful indicator designed to highlights areas of interest where significant price action or reactions are anticipated, automatically applies Fibonacci retracement levels to outline potential pullback zones, and detects engulfing candle patterns.. This tool automates the detection and visualization of key market structures and potential reversal zones. Key Features: CHoCH Detection (Change of Character): Automatically identifies structural shifts in marke
The Market Structure Trend Targets   is a powerful trading indicator designed to give traders a clear, structured, and data-driven view of market momentum, breakouts, and key price reaction zones. Built on the principles of   smart market structure analysis , it helps identify not only trend direction, but also   precise breakout levels ,   trend exhaustion , and   potential reversal zones   — all with visual clarity and trader-friendly metrics. Key Features Breakout Points with Numbered Markers
Supertrend Targets Signal   is a powerful trend-following and breakout confirmation indicator designed to help traders   identify high-probability entry points ,   visualize dynamic target zones , and   receive clean, reliable signals   across various market conditions. The core trend logic is built on a custom Supertrend that uses an ATR-based band structure with long smoothing chains—first through a WMA, then an EMA—allowing the trend line to respond to major shifts while ignoring noise. A key
The   MACD-FVG Signal System   is a hybrid trading indicator that combines the power of momentum analysis through the   MACD (Moving Average Convergence Divergence)   with the precision of   Fair Value Gap (FVG)   detection to generate high-probability buy and sell signals. This indicator enhances traditional MACD signals by validating momentum shifts with market inefficiencies, offering traders a more refined entry strategy. Key Features: MACD with Histogram Display Clearly visualizes the MAC
The   RSI Divergence + FVG Signal   indicator combines   Relative Strength Index (RSI) Divergence   with   Fair Value Gap (FVG)   detection to generate high-probability buy and sell signals based on both momentum shifts and institutional imbalance zones. Core Features: RSI Divergence Detection : Identifies both regular and hidden bullish/bearish divergences between price and RSI. Divergences indicate potential trend reversals or continuation. FVG Zone Recognition : Detects Fair Value Gaps (imbal
Filtro:
Sem comentários
Responder ao comentário