Volume at Price VAP
- Indicatori
- Samuele Borella
- Versione: 1.0
- Attivazioni: 6
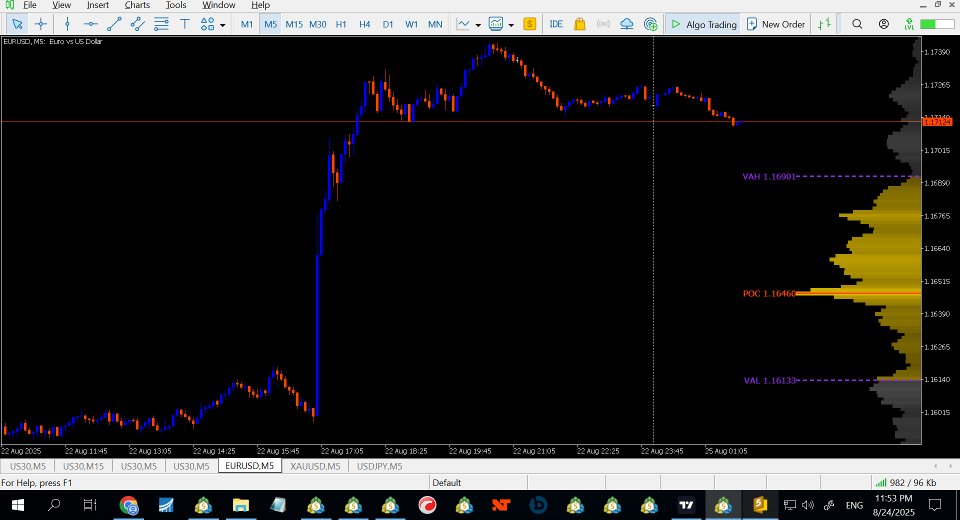
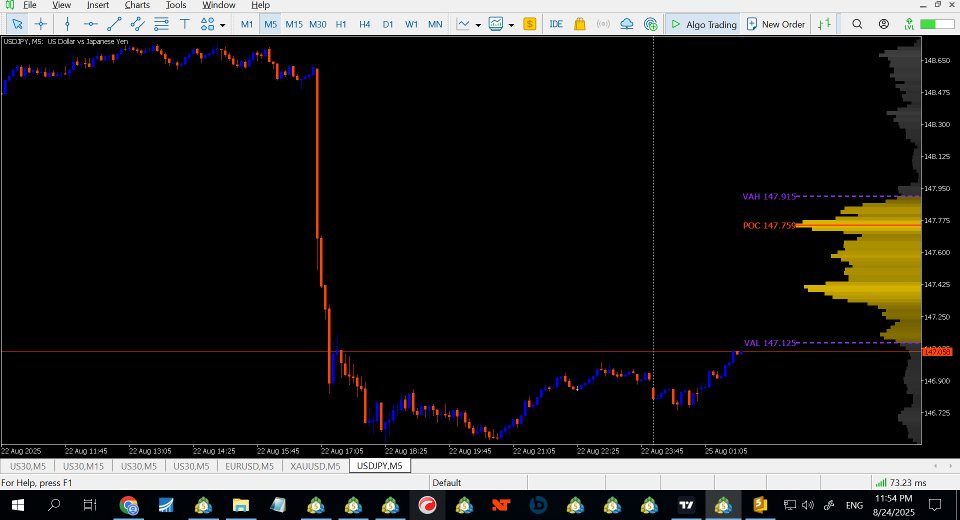
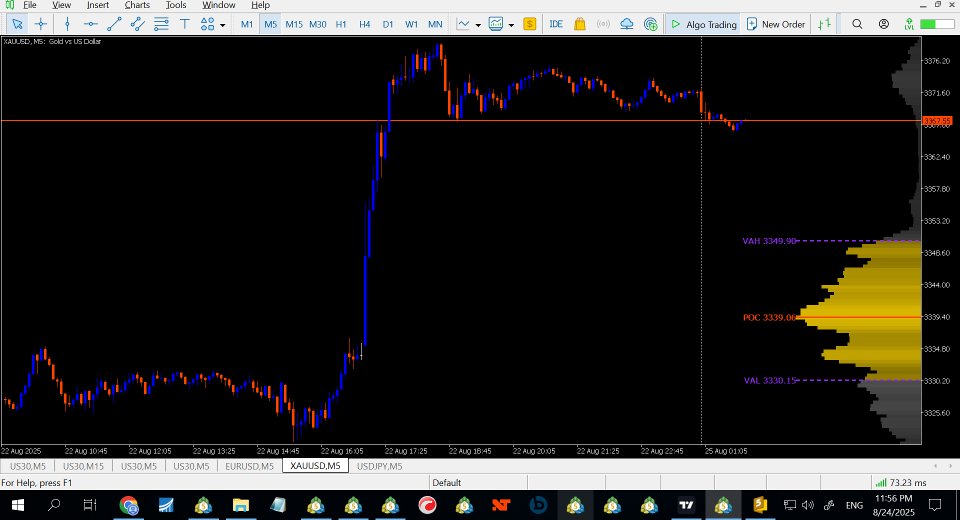
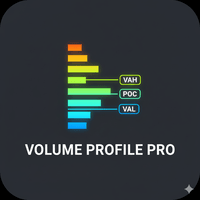
VAP is a right-anchored Volume Profile Heatmap for MetaTrader 5 designed for clean, fast, and stable execution on any chart. It shows where trading activity clustered, not just when—so you can read balance/imbalance, spot value migration, and plan trades with precise references: VAH, VAL, and POC.
What VAP shows
-
Heatmap Profile (tick-volume):
A compact, right-anchored histogram that scales with the chart.-
Value Area (~70%) in Gold
-
Non-Value in White
-
Soft shadow gradient for depth and quick read
-
-
POC (Point of Control):
Solid Orange-Red line (width 3) across the iceberg’s depth, with label and price. -
VAH / VAL:
Blue-Violet dashed lines (width 3) at the true edges of Value, with labels and prices. -
Labels in front of the lines:
The text is aligned at the “front” (left end) of the line with 0 spacing, so the number always matches the level you see.
VAP uses tick volume provided by your broker. Across brokers, totals can differ; the structure and levels generally remain consistent.
Why traders like it
-
Anchored & stable: The profile clamps to the rightmost visible bars—zoom or scroll and VAP stays put.
-
Clean visuals: A single “iceberg” with shadow tonality; no clutter, no flicker.
-
Actionable levels: VAH/VAL/POC align with the histogram’s geometry, so what you see is what you trade.
-
Timeframe-agnostic: Works on M1 to MN, and on Forex, indices, crypto, metals, and futures-style symbols (with tick data).
Core logic (short & transparent)
-
The indicator builds a histogram of tick volume between low–high of each bar in the chosen slice.
-
The POC is the bin with the highest accumulated volume.
-
The Value Area expands from the POC outwards (left/right by price) until ~70% of total volume is covered.
-
VAH is the top edge of the VA; VAL is the bottom edge.
-
Lines are drawn exactly at those edges; labels print the same price used for the line.
Typical uses
-
Mean-reversion: Fade tests of VAL/VAH within a balanced day/week; target mid/POC.
-
Breakout & Go: When price accepts above VAH (or below VAL) and the profile shifts, follow the move into the new value.
-
Confluence: Align VAP levels with session highs/lows, ADR, key S/R, or your order-flow triggers.
-
Context: Compare successive days/weeks to see value migration (up, down, or unchanged).
(Trading involves risk. VAP does not generate signals; it provides structure.)
Inputs (concise)
Slice & cadence
-
Slice – Day / Week / Month (default: Week)
-
Timer (sec) – 2 by default; refresh cadence
Geometry
-
Bins – number of price rows in the histogram (default 120)
-
Max profile width (px) – iceberg max thickness (default 250)
-
Right pad (px) – gap from price axis (default 0)
-
Min bar thickness (px) – minimum row width, keeps slim profiles visible
Colors & style
-
VA color – Gold
-
Non-VA color – White
-
VAH/VAL color – BlueViolet (dashed)
-
POC color – OrangeRed (solid)
-
Line width – 3
-
Dash length / gap – dash geometry
-
Label font size – 21
Mode
-
Render mode – Canvas (default) or Objects
-
Canvas = best performance & visuals
-
Objects = standard chart objects for users who prefer them
-
Tips for best results
-
Leave Canvas as default for the smoothest, flicker-free experience.
-
On very volatile symbols, you can increase Bins (e.g., 160–200) for finer price resolution.
-
If your broker’s tick volume is sparse on higher TFs, build profiles on M5–H1 slices for intraday, H1–H4 for swing.
-
Combine VAP with your entry model (e.g., footprint, DOM, candle patterns). Use VAP levels for location, not timing.
Known nuances (good to know)
-
Tick volume ≠ exchange volume. It tracks activity well on FX/CFD; absolute numbers differ by broker.
-
Rounding: Prices and lines are printed to the symbol’s native digits.
-
Closed vs open market: When the market is closed, minor differences can appear until live ticks resume.
-
Objects mode: Provided for flexibility. If you mass-clone charts with many object indicators, MT5 can slow down—Canvas is lighter.
Installation & use
-
Copy Volume at Price (VAP) into MQL5/Indicators and compile.
-
Attach to any chart.
-
Choose Slice: Day/Week/Month .
-
(Optional) Adjust Bins and Max profile width (px) to taste.
-
Trade around VAH / VAL / POC with your strategy.
Changelog
v1.0
-
Initial release: right-anchored Canvas heatmap, VA (~70%), POC, VAH/VAL lines with labels, weekly default slice, 2-second redraw, white non-value, gold value, purple VA lines, orange-red POC, label font 21, zero-gap front alignment. Optional Objects render mode.
FAQ
Q: Does VAP repaint?
A: No. The profile updates as new bars/ticks add volume to the current slice (day/week/month). Historical slices are fixed.
Q: Why do my numbers differ from another platform?
A: Different brokers feed different tick streams. Structure is typically consistent; exact totals can vary.
Q: Can I plot multiple profiles?
A: Yes—attach multiple instances with different slices or colors.
Q: Will VAP slow my platform?
A: Canvas mode is optimized. If you load dozens of heavy indicators per chart, consider reducing Bins or timer frequency.
License & support
-
Single-user license per MQL5 Market policy.
-
Free updates within the major version.
-
Questions or suggestions? Reach out via MQL5 messages—feedback is welcome.
Give your charts location, not noise.
With VAP, you’ll see where the market cared most—so you can decide what to do next.

