ATR Bands by tSageHuz

Here's a clearer, more organized description for the indicator:

An enhanced ATR Bands indicator that provides flexible, configurable price bands based on Average True Range (ATR). While traditional ATR-based indicators often have limitations in their configurability and functionality, this version offers comprehensive features for both stop-loss and take-profit level calculations.

Key Features:

  • Configurable source price (close, high, low) for ATR band calculations
  • Adjustable scaling factors with decimal precision for fine-tuned bands
  • Upper and lower bands displayed simultaneously
  • Optional take-profit bands with independent scaling
  • On-chart data table showing exact values and distances from close
  • Compatible with non-chart timeframes
  • Organized settings with helpful tooltips and common value suggestions

The indicator can help identify potential support/resistance zones, particularly during consolidation periods. When price breaks and closes outside the ATR bands, it often signals a significant move in that direction, making it useful for both standalone signals and confluence with other indicators.

Default Settings:

  • ATR Period: 3 (updated from 14)
  • Band Scaling Factor: 2.5 (updated from 2.0)

Based on the original work by AlexanderTeaH, with significant enhancements to improve usability and technical analysis capabilities.


Input Parameters:

- ATRPeriod (default = 3): Number of periods for ATR calculation
- ATRMultiplier (default = 2.5): Multiplier for ATR bands width
- ShowTPBands (default = false): Enable/disable Take-Profit bands
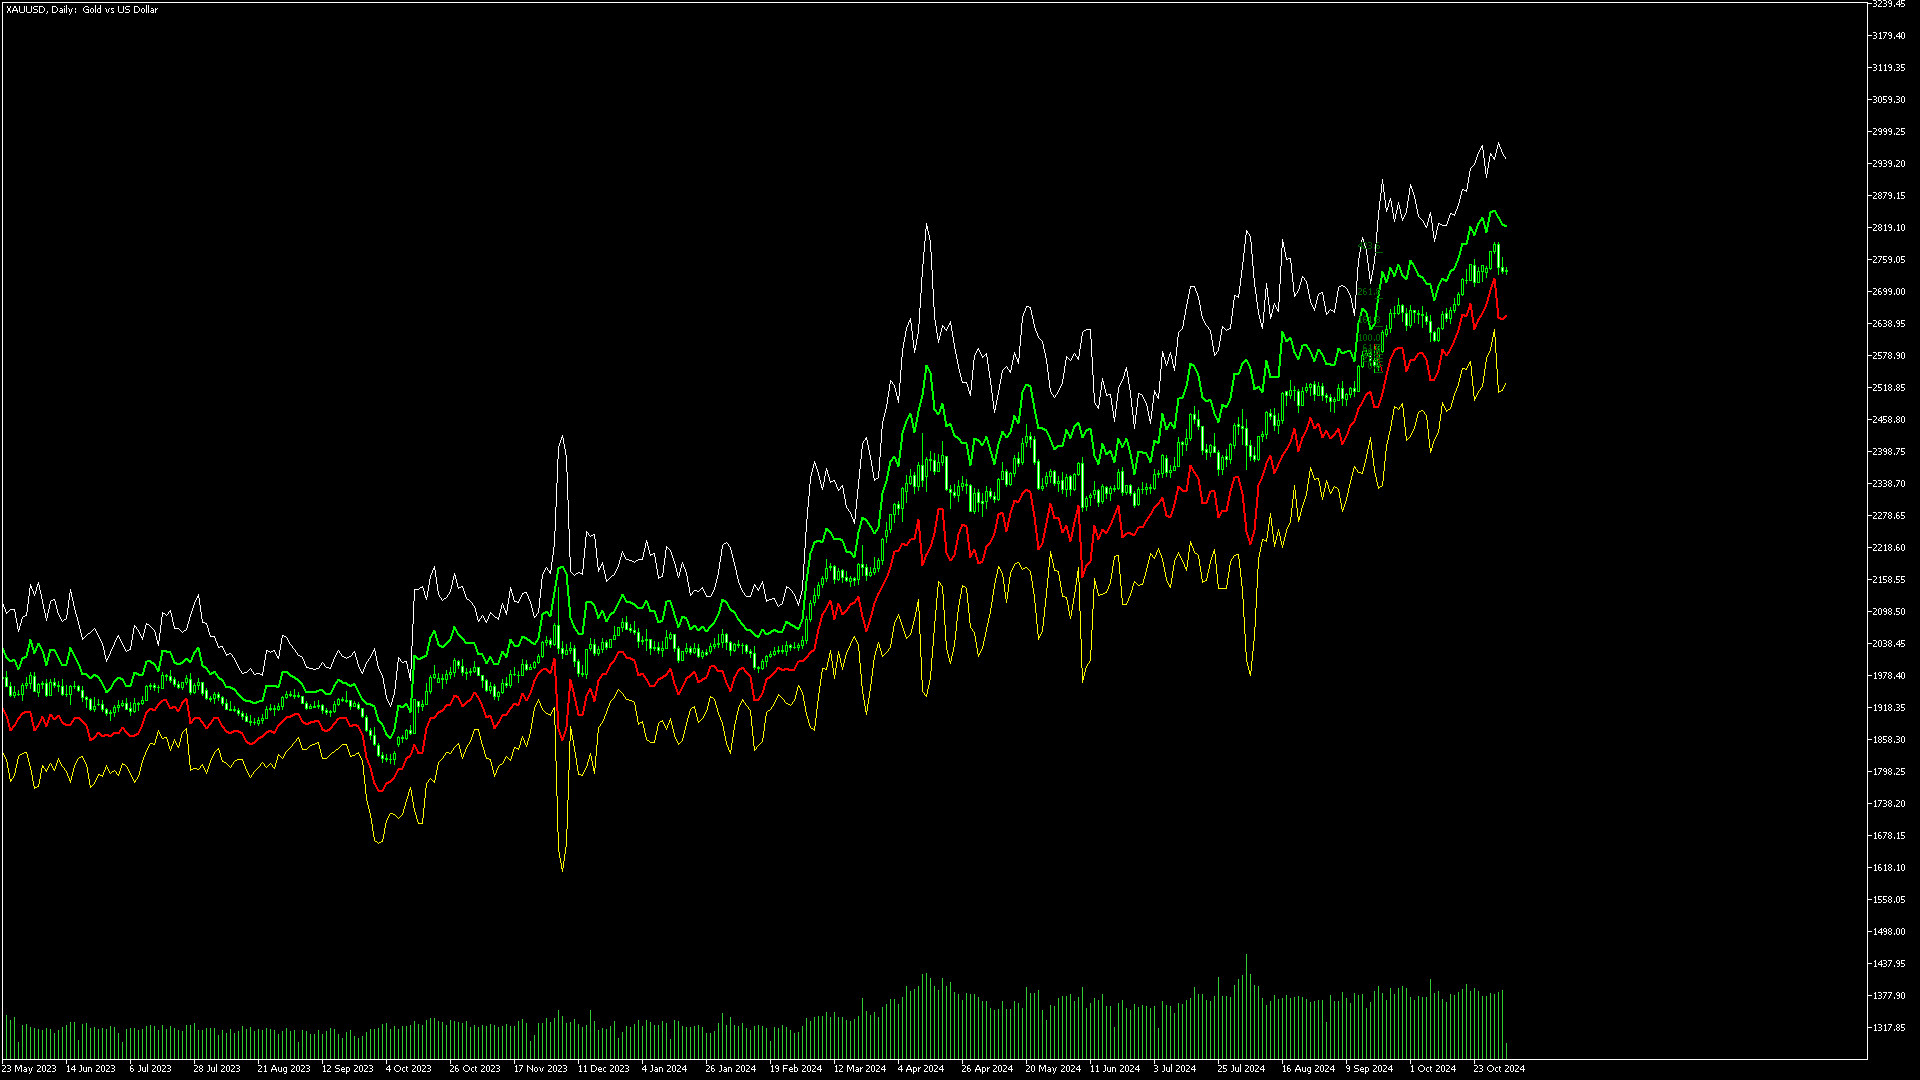
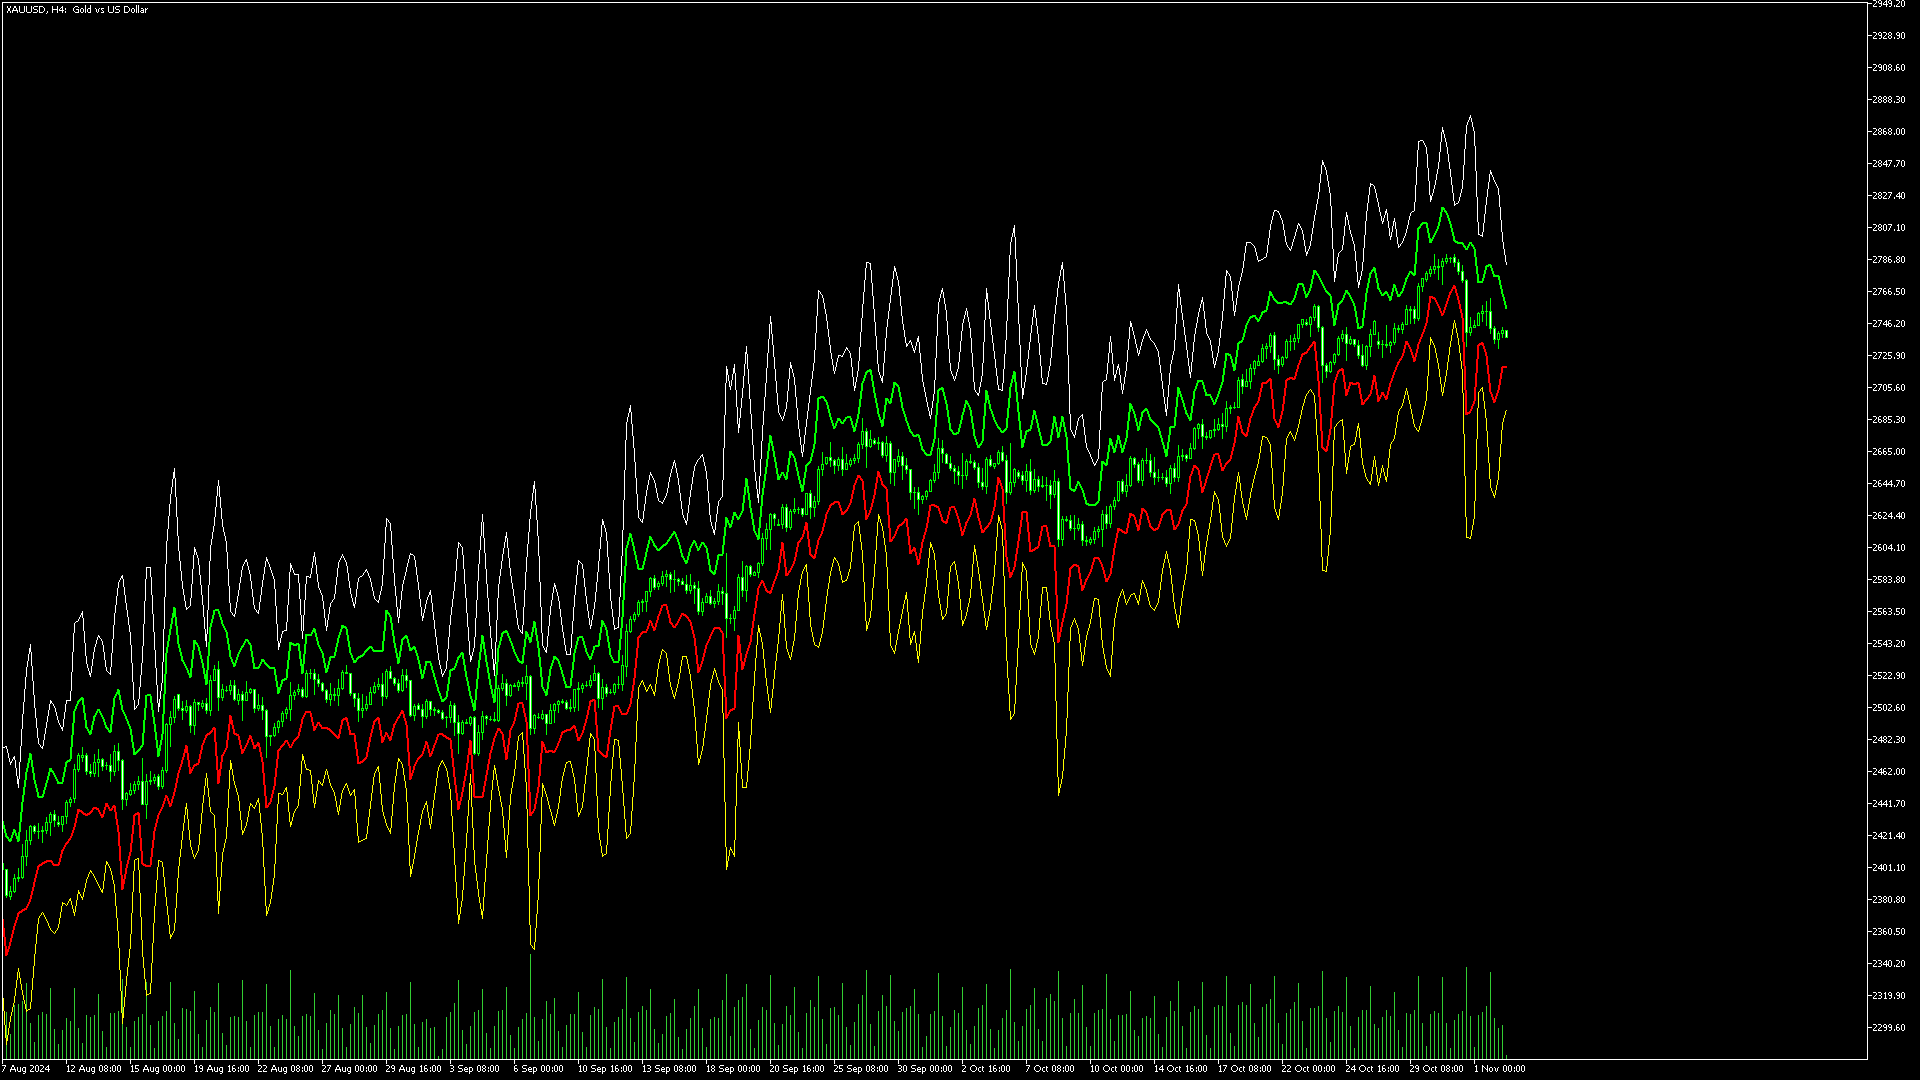
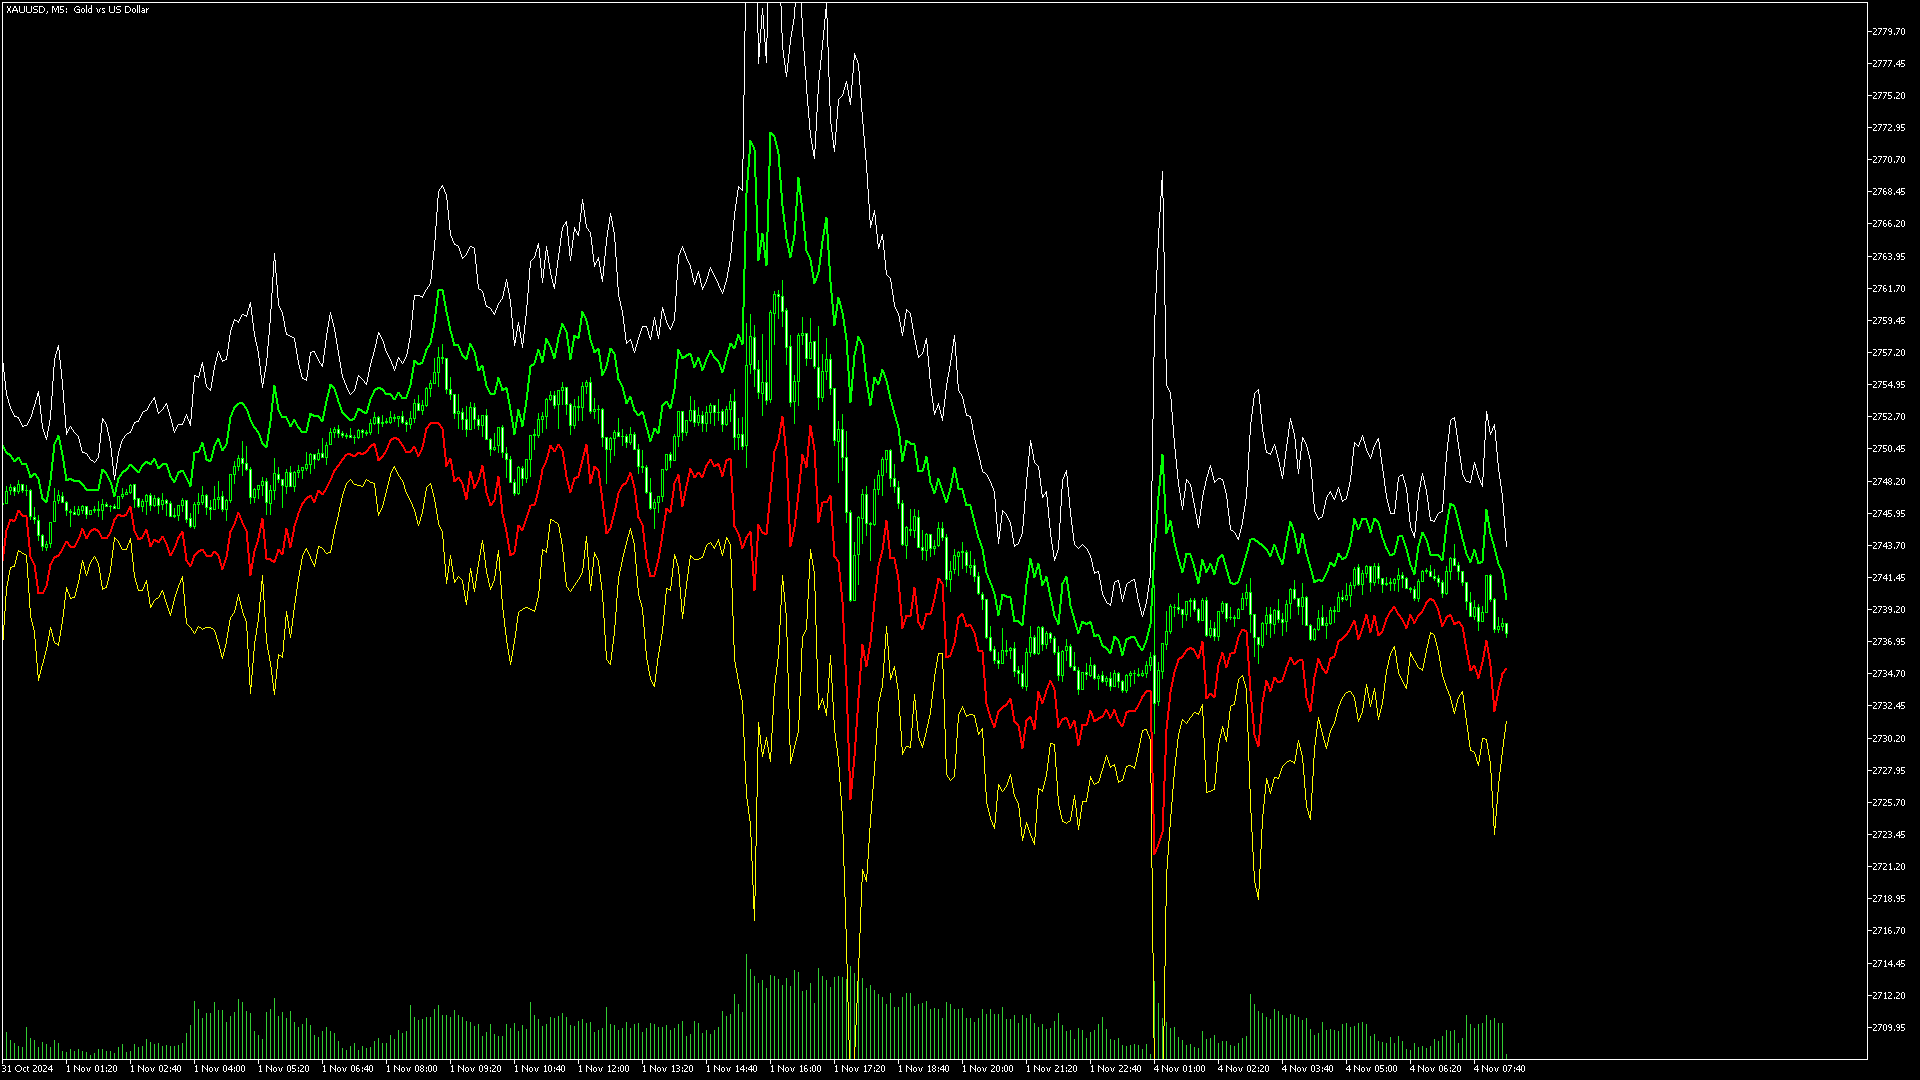
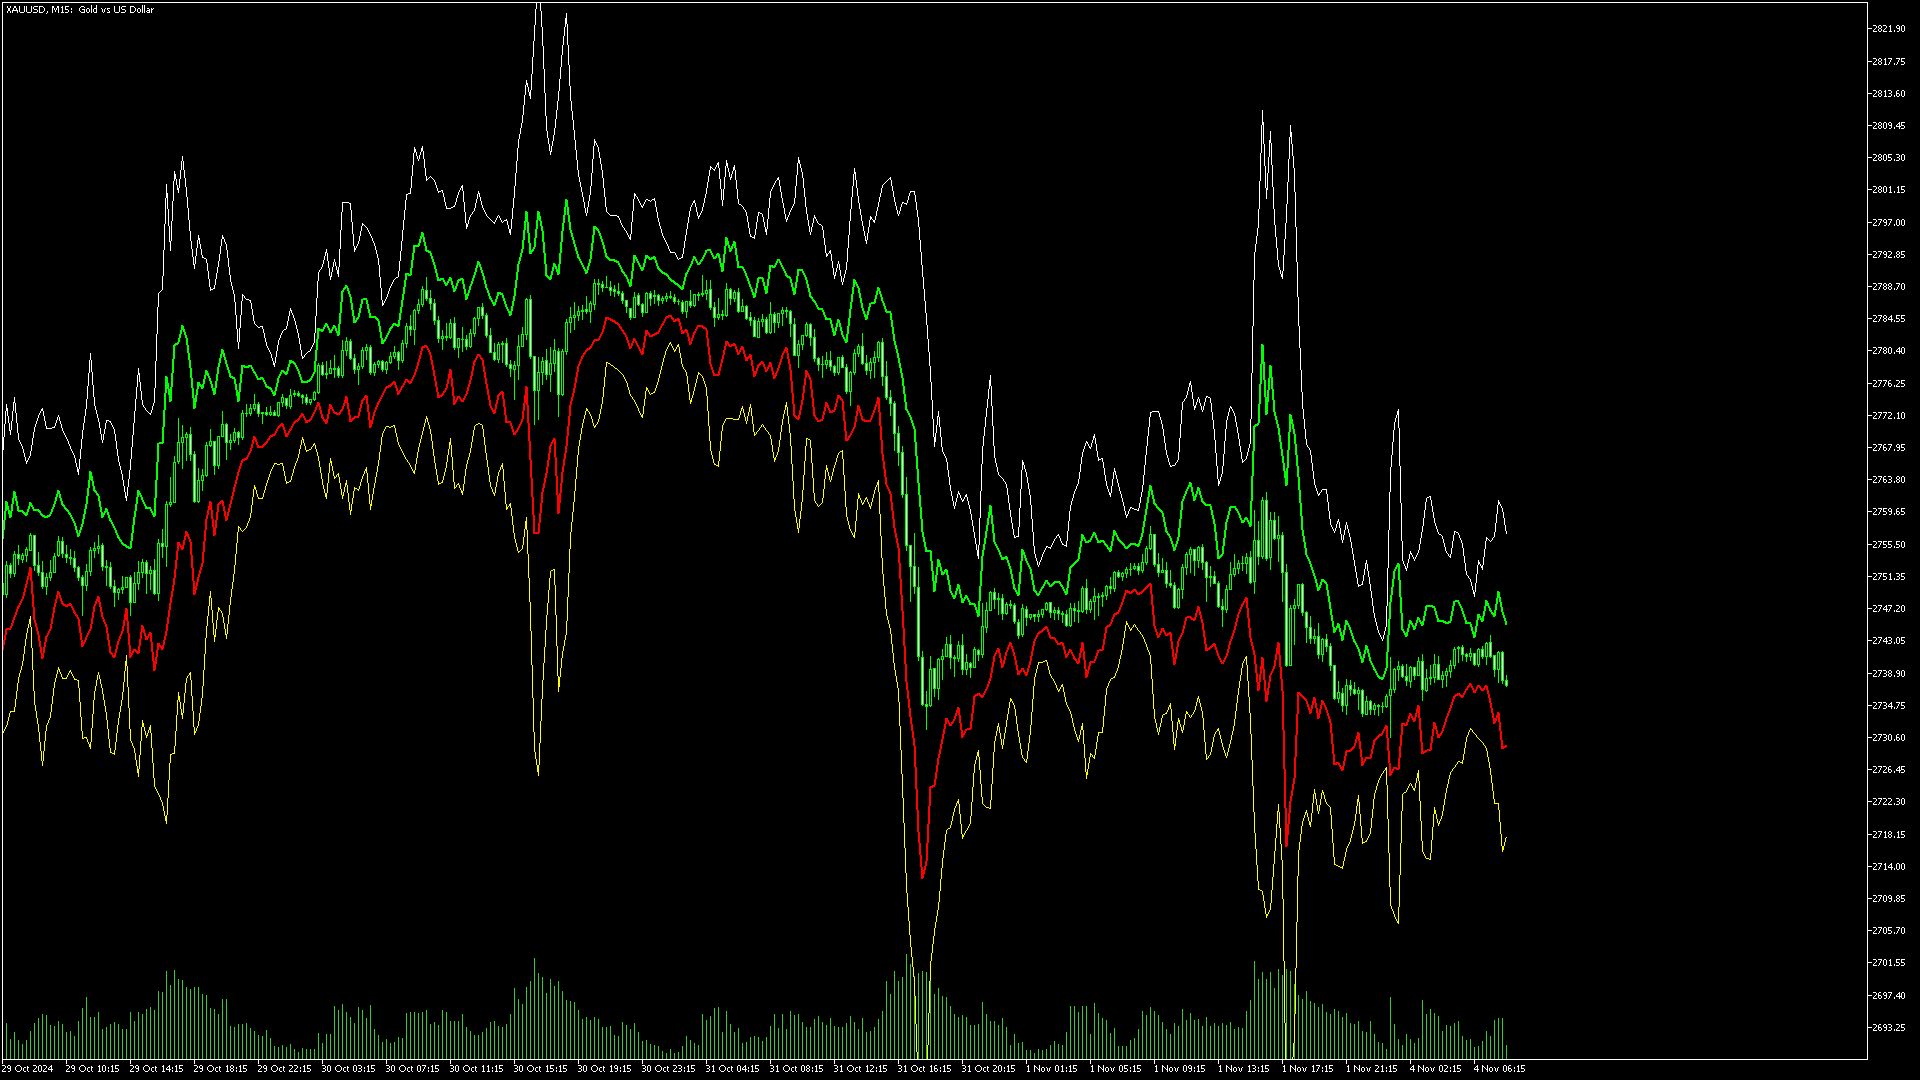
- TPScaleFactor (default = 1.5): Multiplier for Take-Profit bands Colors and Visualization:
- Upper ATR Band: Green line (width 2) - Lower ATR Band: Red line (width 2)
- Upper TP Band: White line (width 1)
- only if ShowTPBands is true
- Lower TP Band: Yellow line (width 1)
- only if ShowTPBands is true

Basic Usage:

1. The ATR bands show volatility-based support and resistance levels

2. Upper Band (Green) = Potential resistance/short entry

3. Lower Band (Red) = Potential support/long entry

Trading Scenarios:

a) Long Position:

   - Entry: When price approaches the Lower ATR Band (red line)

   - Stop Loss: Below the Lower ATR Band

   - Take Profit: At the Upper TP Band (if enabled)


b) Short Position:

   - Entry: When price approaches the Upper ATR Band (green line)

   - Stop Loss: Above the Upper ATR Band

   - Take Profit: At the Lower TP Band (if enabled)


Common Settings:

- For less volatile pairs: Try ATRPeriod = 14, ATRMultiplier = 2.0

- For more volatile pairs: Try ATRPeriod = 3, ATRMultiplier = 2.5

- For aggressive trading: Lower ATRMultiplier (e.g., 1.5)

- For conservative trading: Higher ATRMultiplier (e.g., 3.0)

1. Combine with other indicators:

   - Trend indicators (Moving Averages, MACD)

   - Momentum indicators (RSI, Stochastic)

   - Support/Resistance levels


2. Risk Management:

   - Don't rely solely on the bands for entries/exits

   - Always use proper position sizing

   - Consider market conditions and news events


3. Optimization:

   - Use the Strategy Tester to find optimal settings for your trading style

   - Test different ATRPeriod and ATRMultiplier combinations

   - Keep track of which settings work best for different market conditions


Produtos recomendados
Follow The Line MT5
Oliver Gideon Amofa Appiah
4.6 (35)
This indicator obeys the popular maxim that: "THE TREND IS YOUR FRIEND" It paints a GREEN line for BUY and also paints a RED line for SELL. (you can change the colors). It gives alarms and alerts of all kinds. IT DOES NOT REPAINT and can be used for all currency pairs and timeframes. Yes, as easy and simple as that. Even a newbie can use it to make great and reliable trades. NB: For best results, get my other premium indicators for more powerful and reliable signals. Get them here: https://www.m
FREE
KeltnerChannelIndicatorMT5
Todd Terence Bates
3 (2)
The Keltner Channel is a volatility-based technical indicator composed of three separate lines. The middle line is an exponential moving average (EMA) of the price. Additional lines are placed above and below the EMA. The upper band is typically set two times the Average True Range (ATR) above the EMA, and the lower band is typically set two times the ATR below the EMA. The bands expand and contract as volatility (measured by ATR) expands and contracts. Since most price action will be encompasse
FREE
FractalEfficiencyIndicator   A ratio between 0 and 1 with the higher values representing a more efficient or trending market,  It is used in the calculation of Perry J. Kaufman Adaptive Moving Average (KAMA), dividing the price change over a period by the absolute sum of the price movements that occurred to achieve that change. The Fractal Efficiency or also known as Efficiency Ratio was first published by Perry J. Kaufman in his book   ‘Smarter Trading‘. This is mostly considered a filter for v
FREE
Технический индикатор Trend Moving Average позволяет определить глобальное направление рынка. Данный технический индикатор создан для того, чтобы определить «линию наименьшего сопротивления» рынка и понять в какую сторону направлен тренд. Помимо классического использования МА, индикатор позволяет понять направленность рынка на основе динамики его значений. Так, если значение индикатора демонстрируют переход с нисходящего значения в восходящее (и наоборот) - это является дополнительным торговым с
FREE
Phoenix Moving Average Meter
PHOENIX GLOBAL INVESTMENTS LTD
Medidor de Média Móvel Phoenix (MT5) Ferramenta profissional de análise e visualização de tendências de média móvel para MetaTrader 5. Combina análise inteligente de inclinação, medição da largura da nuvem e classificação de regime em um painel limpo e em tempo real. Visão geral O Medidor de Média Móvel Phoenix analisa a relação entre uma média móvel rápida e lenta para determinar a direção, a força e a maturidade da tendência. O indicador monitora continuamente o ângulo da inclinação da MA,
FREE
Multi-timeframe trend indicator based on the ADX / ADXWilder indicator with Fibonacci levels The indicator shows trend areas using ADX or ADXWilder indicator data from multiple timeframes. The impulse mode of the indicator allows you to catch the beginning of a trend, and several "Screens" with different timeframes allow you to filter out market noise. Fibonacci levels are added to the price chart, which have flexible settings. How the indicator works: if PDI is greater than NDI, then   it`s
FREE
O indicador identifica quando ocorre uma divergência entre o preço e um indicador ou oscilador. Ele identifica divergências regulares e ocultas. Combinado com suas próprias regras e técnicas, este indicador permitirá que você crie (ou aprimore) seu próprio sistema poderoso. Recursos Pode detectar divergências para os seguintes osciladores / indicadores:       MACD, OsMA, Stochastics, RSI, CCI, RVI, Awesome, ADX, ATR, OBV, Índice composto, MFI e Momentum. Apenas um oscilador / indicador pode ser
FREE
TANIN RISK REWARD MT5 is the ultimate position calculation assistant for Price Action traders. If you love the flexibility of the Long/Short Position tool on TradingView, this indicator brings that exact, lightning-fast experience to your MetaTrader 5 terminal. Designed by Tanin Coder, this tool allows you to map out your Trade Entry, Stop Loss, and Take Profit visually on the chart with automatic Risk-Reward ratio recalculations. A professional, fast, and interactive drawing tool supporting Dyn
FREE
TTM Squeeze MT5
Tinashe Ndarimani
4.83 (6)
Overview The TTM Squeeze indicator helps identify low volatility periods (squeeze) that often precede price breakouts. It uses Bollinger Bands (BB) and Keltner Channels (KC) to determine when the market is "coiling" and ready to move. Configuration Guide Volatility Settings The indicator uses Bollinger Bands to measure market volatility. When BBs are inside Keltner Channels, a squeeze is detected. The squeeze suggests the market is consolidating and may soon break out. True Range Option Optional
FREE
TSO Moving Average Slope MT5
Dionisis Nikolopoulos
5 (3)
The Moving Average Slope (MAS) subtracts the moving average level n-periods ago from the current moving average level. This way, the trend of the moving average can be drawn on the moving average line. Features Observe uptrends and downtrends at a glance. The indicator is non-repainting. Returns buffer values for the trend of the moving average to be used as part of an EA. (see below) Inputs Moving Average Period : The period of the moving average (MA). Slope Period : Number of periods between
FREE
Bollinger Bands Technical Indicator (BB) is similar to envelopes. The only difference is that the bands of Envelopes are plotted a fixed distance (%) away from the moving average, while the Bollinger Bands are plotted a certain number of standard deviations away from it. Standard deviation is a measure of volatility, therefore Bollinger Bands adjust themselves to the market conditions. When the markets become more volatile, the bands widen and they contract during less volatile periods. This ada
FREE
Candle Countdown — Tempo preciso até o fechamento da vela para MT5 Candle Countdown é um instrumento simples e preciso que mostra o tempo restante até o fechamento da vela atual diretamente no gráfico. Quando a entrada depende do fechamento da vela, até mesmo alguns segundos fazem diferença. Este indicador permite ver o tempo exato e tomar decisões sem pressa ou suposições. Um indicador para controle preciso do fechamento da vela. O indicador mostra: tempo restante até o fechamento da vela hora
FREE
HMA Color with Alerts MT5
Pavel Zamoshnikov
4.75 (57)
Hull Moving Average (HMA) is well-deservedly popular among traders because of the effective averaging of market noise and a relatively small delay. The current MetaTrader 5 version changes its color when the movement direction changes. Sound and text signals are available. It also supports sending email and push messages. It is possible to trigger a signal on the current incomplete bar, although such a signal may be canceled before completion if conditions are no longer appropriate. One of the p
FREE
FVG Indicator
Daniel Moises Pimentel Flores
This indicator identifies and highlights market inefficiencies, known as Fair Value Gaps (FVG), on price charts. Using a custom algorithm, the indicator detects these areas of imbalance where the price moves sharply, creating potential trading opportunities. Indicator Parameters: Bullish FVG Color (clrBlue) : Color used to highlight bullish inefficiencies. The default value is blue. Bearish FVG Color (clrRed) : Color used to highlight bearish inefficiencies. The default value is red. Bullish FVG
FREE
Free automatic Fibonacci is an indicator that automatically plots a Fibonacci retracement based on the number of bars you select on the BarsToScan setting in the indicator. The Fibonacci is automatically updated in real time as new highest and lowest values appears amongst the selected bars. You can select which level values to be displayed in the indicator settings. You can also select the color of the levels thus enabling the trader to be able to attach the indicator several times with differe
FREE
Donchian Channel DC is the indicator of Donchian Channels, that plots maximum and minimum values of a specific period, besides mean value line. It´s possible to configure simple period for analysis and the indicator will plot all three values. You can trade with this indicator as trend or reversal, according to each strategy. Do not let to test others indicators as soon as others expert advisors.
RANGE TRADING METHOD GUIDE Using the MultiTF_TopBottom_Bands Indicator *** Group support:  https://www.mql5.com/en/channels/vuongphamtrading 1. INTRODUCTION 1.1. What is Range Trading? Range Trading is a trading method based on identifying the price oscillation zone (range) of the market and utilizing price movements within this zone to trade. 1.2. Basic Principles Top : Resistance zone - where price typically gets pushed down Bottom : Support zone - where price typically gets pushed up Range :
FREE
TrailingStop MA
Andrej Nikitin
3.5 (2)
O indicador desenha duas médias móveis simples utilizando preços máximos e mínimos A linha de MA_High é exibido quando a média móvel é direcionada para baixo. Ele pode ser usado para definir uma ordem de stop para uma posição de venda. A linha de MA_Low é exibido quando a média móvel é dirigida para cima. Ela pode ser usado para definir uma ordem de stop para uma posição comprada. O indicador é usado no Expert Advisor TrailingStop . Parâmetros Period - Período de cálculo da média móvel. Deviatio
FREE
Se você é (ou foi) um fã do indicador RSI, vai adorar o indicador Dynamic Momentum Index de Tushar Chande, que, em termos simples, é um RSI de comprimento variável dinâmico, tornando-o mais poderoso. O indicador DMI usa internamente um número variável de barras em seus cálculos, levando em consideração os níveis de volatilidade do mercado atual que você está analisando. Dessa forma, o indicador DMI usará mais barras conforme a volatilidade diminui e menos barras quando a volatilidade aumenta, pr
FREE
Mitimom
Danil Poletavkin
The indicator is based on Robert Miner's methodology described in his book "High probability trading strategies" and displays signals along with momentum of 2 timeframes. A Stochastic oscillator is used as a momentum indicator. The settings speak for themselves period_1 is the current timeframe, 'current' period_2 is indicated - the senior timeframe is 4 or 5 times larger than the current one. For example, if the current one is 5 minutes, then the older one will be 20 minutes The rest of the s
FREE
MACD Enhanced
Nikita Berdnikov
5 (3)
Introducing the MACD  Enhanced – an advanced MACD (Moving Average Convergence Divergence) indicator that provides traders with extended capabilities for trend and momentum analysis in financial markets. The indicator uses the difference between the fast and slow exponential moving averages to determine momentum, direction, and strength of the trend, creating clear visual signals for potential entry and exit points. Attention! To achieve the best results, it is recommended to adapt the indicator
FREE
Bollinger Bands B
Flavio Javier Jarabeck
4.25 (4)
John Bollinger created this indicator in 2010 as a way to read the original indicator (Bollinger Bands) in a more "technical" way, shown as an oscillator. The typical range of the Bollinger Bands %B is 0 - 0.5 - 1.0, where "0" represents the lower band, the "0.5" the middle band, and "1" the upper band. The line on the indicator represents the Closing prices. As simple as that. SETTINGS Bollinger Bands period of analysis Standard Deviation multiplier Shift Price type to be analyzed If you like
FREE
This indicator is a zero-lag indicator and displays  strength of trend change . True Trend  Oscillator Pro works best in combination with True Trend Moving Average Pro that displays exact trend as is. Oscillator value is exact price change in given direction of the trend. True Trend Moving Average Pro: https://www.mql5.com/en/market/product/103586 If you set PERIOD input parameter to 1 this indicator becomes a sharpshooter for binary options. Developers can use True Trend Oscillator in Exper
FREE
Este indicador inovador de medir a força das moedas da INFINITY é um assistente indispensável para cambistas e comerciantes que negociam em longo prazo. O sistema de análise de força / fraqueza das moedas é conhecido há muito tempo e é usado no mercado pelos principais traders do mundo. Qualquer negociação de arbitragem não está completa sem essa análise. Nosso indicador determina facilmente a força das moedas subjacentes em relação umas às outras. Ele exibe gráficos de linhas em todas ou no pa
FREE
This is addition of  Effective SV squeeze momentum  that add bolliger band and Keltner channel to chart window.  Squeeze momentum introduced by “John Carter”, the squeeze indicator for MT5 represents a volatility-based tool. Regardless, we can also consider the squeeze indicator as a momentum indicator, as many traders use it to identify the direction and strength of price moves. In fact, the Tradingview  squeeze indicator shows when a financial instrument is willing to change from a trending ma
FREE
TrendBite v1.5 - Indicador profissional de acompanhamento de tendências Desenvolvedor: 8aLt4 Versão: 1.5 Plataforma: MetaTrader 5  Visão geral O TrendBite v1.5 é um indicador de análise técnica avançado, concebido para identificar mudanças de tendência no mercado e fornecer sinais de compra e venda claros aos investidores. Baseado no algoritmo das Bandas de Bollinger, esta ferramenta capta com precisão as inversões de tendência, sendo ideal tanto para principiantes como para traders experiente
FREE
Indicator and Expert Adviser  EA Available in the comments section of this product. Download with Indicator must have indicator installed for EA to work. Mt5 indicator alerts for bollinger band and envelope extremes occurring at the same time. Buy signal alerts occur when A bullish candle has formed below both the lower bollinger band and the lower envelope  Bar must open and close below both these indicators. Sell signal occur when A bear bar is formed above the upper bollinger band and upper
FREE
ChannelRSI5
Iurii Tokman
5 (5)
ChannelRSI5   O indicador Relative Strength Index (RSI) com níveis dinâmicos de zonas de sobrecompra e sobrevenda. Os níveis dinâmicos mudam e se ajustam às mudanças atuais no indicador e nos preços e representam uma espécie de canal. Configurações do indicador period_RSI - Período médio para calcular o índice RSI. Applicated_RSI - O preço aplicado. Pode ser qualquer uma das constantes de preço: PRICE_CLOSE - Preço de fechamento, PRICE_OPEN - Preço de abertura, PRICE_HIGH - Preço máximo para o p
FREE
Intraday Momentum Index IMI
Danilo Hudson Couto Monteiro
Indicador IMI (Intraday Momentum Index) Descrição O Indicador IMI (Intraday Momentum Index) é uma poderosa ferramenta de análise técnica desenvolvida para identificar a força do momentum e potenciais reversões no mercado. Este indicador quantifica a relação entre ganhos e perdas durante um período específico, ajudando traders a avaliar a dinâmica atual do mercado. Características Oscila entre 0 e 100, facilitando a interpretação das condições de mercado Identifica com precisão áreas de sobrecomp
FREE
Indicador Heiken Ashi MT5 Eleve sua análise de mercado com o Indicador Heiken Ashi MT5. Esta poderosa ferramenta transforma os dados de preços padrão em velas mais suaves, focadas em tendências, facilitando a identificação de tendências de mercado e potenciais pontos de reversão. Características principais: Identificação clara de tendências: Distingue visualmente entre tendências de alta e baixa com cores de velas distintas. Redução de ruído: Filtra as flutuações de preços, proporcionando uma v
FREE
Os compradores deste produto também adquirem
SuperScalp Pro
Van Minh Nguyen
4.72 (18)
SuperScalp Pro – Sistema avançado de indicador de scalping com múltiplos filtros SuperScalp Pro é um sistema avançado de indicador de scalping que combina o clássico Supertrend com múltiplos filtros inteligentes de confirmação. O indicador opera de forma eficiente em todos os timeframes de M1 a H4 e é especialmente adequado para XAUUSD, BTCUSD e principais pares Forex. Pode ser usado como sistema independente ou integrado de forma flexível a estratégias de trading existentes. O indicador integra
Entry In The Zone and SMC Multi Timeframe is a real-time 2-in-1 market analysis tool that combines market structure analysis and a No Repaint BUY / SELL signal system into a single indicator, built on Smart Money Concepts (SMC) — a widely adopted framework used by professional traders to understand market structure. This indicator helps you see the market more clearly, make decisions based on structure rather than guesswork, and focus on high-probability zones where price is more likely to react
Azimuth Pro
Ottaviano De Cicco
5 (6)
Azimuth Pro V2: Estrutura Fractal Sintética e Entradas Confirmadas para MT5 Visão geral Azimuth Pro é um indicador de estrutura swing multinível da Merkava Labs . Quatro camadas de swing aninhadas, VWAP ancorado em swings, detecção de padrões ABC, filtragem estrutural de três timeframes e entradas confirmadas em barra fechada — um gráfico, um fluxo de trabalho dos micro-swings aos macro-ciclos. Este não é um produto de sinais cegos. É um fluxo de trabalho baseado em estrutura para traders que v
Divergence Bomber
Ihor Otkydach
4.9 (86)
Cada comprador deste indicador recebe adicionalmente, e de forma gratuita: A ferramenta exclusiva "Bomber Utility", que acompanha automaticamente cada operação, define os níveis de Stop Loss e Take Profit e fecha operações de acordo com as regras da estratégia; Arquivos de configuração (set files) para ajustar o indicador em diferentes ativos; Set files para configurar o Bomber Utility nos modos: "Risco Mínimo", "Risco Balanceado" e "Estratégia de Espera"; Um vídeo tutorial passo a passo que aju
Power Candles MT5
Daniel Stein
4.75 (8)
Power Candles – Sinais de entrada baseados em força para qualquer mercado Power Candles leva a análise de força comprovada da Stein Investments diretamente para o seu gráfico de preços. Em vez de reagir apenas ao preço, cada candle é colorido com base na força real do mercado, permitindo identificar instantaneamente a construção de momentum, aceleração de força e transições limpas de tendência. Uma única lógica para todos os mercados Power Candles funciona automaticamente em todos os símbolos de
Gold Entry Sniper
Tahir Mehmood
5 (8)
Gold Entry Sniper – Painel ATR Multi-Tempo Profissional para Scalping e Swing Trading em Ouro Gold Entry Sniper é um indicador avançado para MetaTrader 5 projetado para fornecer sinais de compra/venda precisos para XAUUSD e outros ativos, com base na lógica de Trailing Stop ATR e análise multi-tempo . Ideal tanto para scalpers quanto para swing traders. Principais Recursos e Vantagens Análise Multi-Tempo – Veja a tendência de M1, M5 e M15 em um único painel. Trailing Stop Baseado em ATR – Níveis
Trend Screener Pro MT5
STE S.S.COMPANY
4.85 (104)
Desbloqueie o poder da negociação de tendências com o indicador Trend Screener: sua solução definitiva de negociação de tendências, alimentada por lógica difusa e sistema de múltiplas moedas! Eleve sua negociação de tendências com o Trend Screener, o revolucionário indicador de tendências alimentado por lógica difusa. É um poderoso indicador de acompanhamento de tendências que combina mais de 13 ferramentas e recursos premium e 3 estratégias de negociação, tornando-o uma escolha versátil para to
Se você comprar este indicador, receberá meu Gerenciador de Operações Profissional + EA  GRATUITAMENTE. Primeiramente, vale ressaltar que este Sistema de Trading é um Indicador Não Repintado, Não Redesenho e Não Atrasado, o que o torna ideal tanto para o trading manual quanto para o automatizado. Curso online, manual e download de predefinições. O "Sistema de Trading Inteligente MT5" é uma solução completa de trading projetada para traders novos e experientes. Ele combina mais de 10 indicadores
Meridian Pro
Ottaviano De Cicco
5 (1)
Meridian Pro: Matriz Profissional de Tendência Multi-Timeframe para MT5 Visão geral Meridian Pro é uma matriz de tendência multi-timeframe da Merkava Labs que comprime estado direcional, força, condição de momentum e concordância da matriz em um painel compacto. Um motor adaptativo, aplicado consistentemente de M1 a W1. Sem ajuste por símbolo. Sem acúmulo de indicadores. Uma leitura estruturada em todos os ativos e todos os timeframes. Oferta de lançamento — Obtenha o Meridian Pro por USD 99 (in
Quantum TrendPulse
Bogdan Ion Puscasu
5 (22)
Apresentando   Quantum TrendPulse   , a ferramenta de negociação definitiva que combina o poder do   SuperTrend   ,   RSI   e   Stochastic   em um indicador abrangente para maximizar seu potencial de negociação. Projetado para traders que buscam precisão e eficiência, este indicador ajuda você a identificar tendências de mercado, mudanças de momentum e pontos de entrada e saída ideais com confiança. Principais características: Integração SuperTrend:   siga facilmente a tendência predominante do
Gann Made Easy   é um sistema de negociação Forex profissional e fácil de usar, baseado nos melhores princípios de negociação usando a teoria do sr. W. D. Gann. O indicador fornece sinais precisos de COMPRA e VENDA, incluindo níveis de Stop Loss e Take Profit. Você pode negociar mesmo em movimento usando notificações PUSH. Entre em contato comigo após a compra para receber instruções de negociação e ótimos indicadores extras gratuitamente! Provavelmente você já ouviu muitas vezes sobre os método
Btmm state engine pro
Garry James Goodchild
5 (4)
BTMM State Engine Pro is a MetaTrader 5 indicator for traders who use the Beat The Market Maker approach: Asian session context, kill zone timing, level progression, peak formation detection, and a multi-pair scanner from a single chart. It combines cycle state logic with a built-in scanner dashboard so you do not need the same tool on many charts at once. What it does Draws the Asian session range; session times can follow broker server offset or be set in inputs. Tracks level progression (L
FX Trend MT5 NG
Daniel Stein
5 (4)
FX Trend NG: A Nova Geração de Inteligência de Tendência Multi-Mercado Visão Geral FX Trend NG é uma ferramenta profissional de análise de tendências e monitoramento de mercado em múltiplos períodos de tempo. Permite compreender a estrutura completa do mercado em segundos. Em vez de alternar entre vários gráficos, você visualiza instantaneamente quais ativos estão em tendência, onde o momentum está enfraquecendo e onde existe alinhamento forte entre diferentes timeframes. Oferta de Lançamento
Crystal Heikin Ashi Signals
Muhammad Jawad Shabir
5 (2)
Crystal Heikin Ashi Signals - Professional Trend & Signal Detection Indicator Advanced Heikin Ashi Visualization with Intelligent Signal System for Manual & Automated Trading Final Price: $149 ---------> Price goes up $10 after every 10 sales . Limited slots available — act fast . Overview Crystal Heikin Ashi Signals is a professional-grade MetaTrader 5 indicator that combines pure Heikin Ashi candle visualization with an advanced momentum-shift detection system. Designed for both manual traders
OmniSync Projection
Antonio-alin Teculescu
5 (1)
Chronos Fractal Engine is an innovative price projection indicator for MetaTrader 5, designed to transform your technical analysis by intelligently identifying and projecting historical price patterns. Built upon an advanced correlation algorithm and the fractal principles of the market, this powerful tool visualizes potential future price movements, giving you a unique edge in your trading decisions. What is Chronos Fractal Engine? At its core, the Chronos Fractal Engine employs a sophisticat
ARICoins
Temirlan Kdyrkhan
ARICoin is a powerful trading companion designed to generate high-probability entry signals with dynamic TP/SL/DP levels based on volatility. Built-in performance tracking shows win/loss stats, PP1/PP2 hits, and success rates all updated live. Key Features: Buy/Sell signals with adaptive volatility bands Real-time TP/SL/DP levels based on ATR Built-in MA Filter with optional ATR/StdDev volatility Performance stats panel (Success, Profit/Loss, PP1/PP2) Alerts via popup, sound, push, or email Cust
Antes de tudo, vale ressaltar que esta Ferramenta de Negociação é um Indicador Não Repintante, Não Redesenhante e Não Atrasado, o que a torna ideal para negociação profissional. Curso online, manual do utilizador e demonstração. O Indicador de Conceitos de Ação de Preço Inteligente é uma ferramenta muito poderosa tanto para traders novos quanto experientes. Ele combina mais de 20 indicadores úteis em um único, combinando ideias avançadas de negociação como Análise do Trader do Círculo Interno
Trend indicator AI mt5
Ramil Minniakhmetov
5 (16)
O indicador Trend Ai é uma ótima ferramenta que irá melhorar a análise de mercado de um trader, combinando a identificação de tendências com pontos de entrada acionáveis e alertas de reversão. Este indicador permite que os usuários naveguem pelas complexidades do mercado forex com confiança e precisão Além dos sinais primários, o indicador Trend Ai identifica pontos de entrada secundários que surgem durante retrações ou retrações, permitindo que os comerciantes capitalizem as correções de preço
FX Power MT5 NG
Daniel Stein
5 (31)
FX Power: Analise a Força das Moedas para Decisões de Negociação Mais Inteligentes Visão Geral FX Power é a sua ferramenta essencial para compreender a força real das principais moedas e do ouro em quaisquer condições de mercado. Identificando moedas fortes para comprar e fracas para vender, FX Power simplifica as decisões de negociação e revela oportunidades de alta probabilidade. Quer você prefira seguir tendências ou antecipar reversões usando valores extremos de Delta, esta ferramenta adap
Veja qual estrategia realmente funciona no seu simbolo - antes de arriscar dinheiro real. Power Bar detecta barras de preco extremas em qualquer simbolo e qualquer timeframe, e entao faz backtest instantaneo de 3 estrategias de trading diferentes para que voce possa comparar taxas de acerto, fatores de lucro e P&L lado a lado. Tudo em um unico painel interativo. Sem suposicoes. Sem curve-fitting. Apenas dados. O que torna o Power Bar unico? A maioria dos indicadores fornece um sinal e deixa voc
Smart Stop Indicator – Precisão inteligente de stop-loss diretamente no seu gráfico Visão geral O Smart Stop Indicator é a solução ideal para traders que desejam definir seu stop-loss de forma clara e metódica, sem adivinhações ou decisões baseadas apenas na intuição. A ferramenta combina lógica clássica de price action (topos mais altos, fundos mais baixos) com um sistema moderno de detecção de rompimentos para identificar onde realmente deve estar o próximo nível lógico de stop. Seja em tend
Bill Williams Advanced
Siarhei Vashchylka
5 (11)
Bill Williams Advanced is designed for automatic chart analysis using Bill Williams' "Profitunity" system. The indicator analyzes four timeframes at once. Manual (Be sure to read before purchasing) Advantages 1. Analyzes the chart using Bill Williams' "Profitunity" system. Signals are displayed in a table in the corner of the screen and on the price chart. 2. Finds all known AO and AC signals, as well as zone signals. Equipped with a trend filter based on the Alligator. 3. Finds "Divergence Bar
RelicusRoad Pro: Sistema Operacional Quantitativo de Mercado 70% DE DESCONTO ACESSO VITALÍCIO (TEMPO LIMITADO) - JUNTE-SE A 2.000+ TRADERS Por que a maioria dos traders falha mesmo com indicadores "perfeitos"? Porque eles operam Conceitos Únicos no vácuo. Um sinal sem contexto é uma aposta. Você precisa de CONFLUÊNCIA . RelicusRoad Pro não é um simples indicador de seta. É um Ecossistema Quantitativo de Mercado completo. Ele mapeia a "Estrada do Valor Justo", distinguindo ruído de rupturas estru
Atomic Analyst MT5
Issam Kassas
3.94 (31)
Primeiramente, vale ressaltar que este Indicador de Negociação não repinta, não redesenha e não apresenta atrasos, tornando-o ideal tanto para negociação manual quanto automatizada. Manual do utilizador: configurações, entradas e estratégia. O Analista Atômico é um Indicador de Ação de Preço PA que utiliza a força e o momentum do preço para encontrar uma vantagem melhor no mercado. Equipado com filtros avançados que ajudam a remover ruídos e sinais falsos, e aumentam o potencial de negociação.
Berma Bands
Muhammad Elbermawi
5 (8)
O indicador Berma Bands (BBs) é uma ferramenta valiosa para traders que buscam identificar e capitalizar tendências de mercado. Ao analisar a relação entre o preço e os BBs, os traders podem discernir se um mercado está em uma fase de tendência ou de variação. Visite o [ Blog Berma Home ] para saber mais. As Bandas de Berma são compostas por três linhas distintas: a Banda de Berma Superior, a Banda de Berma Média e a Banda de Berma Inferior. Essas linhas são plotadas em torno do preço, criando u
ARIPoint
Temirlan Kdyrkhan
ARIPoint is a powerful trading companion designed to generate high-probability entry signals with dynamic TP/SL/DP levels based on volatility. Built-in performance tracking shows win/loss stats, PP1/PP2 hits, and success rates all updated live. Key Features: Buy/Sell signals with adaptive volatility bands Real-time TP/SL/DP levels based on ATR Built-in MA Filter with optional ATR/StdDev volatility Performance stats panel (Success, Profit/Loss, PP1/PP2) Alerts via popup, sound, push, or email Cu
Advanced Supply Demand MT5
Bernhard Schweigert
4.53 (15)
Atualmente com 33% de desconto! A melhor solução para qualquer Trader Novato ou especialista! Este indicador é uma ferramenta de negociação exclusiva, de alta qualidade e acessível porque incorporamos uma série de recursos proprietários e uma nova fórmula. Com esta atualização, você poderá mostrar fusos horários duplos. Você não só será capaz de mostrar um TF mais alto, mas também mostrar ambos, o TF do gráfico, MAIS o TF mais alto: MOSTRANDO ZONAS ANINHADAS. Todos os traders de Oferta e Demanda
Auto Optimized Parabolic RSI: Avançado Motor de Momentum 3D A maioria dos indicadores de varejo falha porque depende de parâmetros estáticos que quebram no momento em que a volatilidade do mercado muda. O Auto Optimized Parabolic RSI resolve o problema de "obsolescência do indicador" recalculando continuamente a sua própria vantagem matemática, trazendo uma adaptação quantitativa de nível institucional diretamente para o seu terminal MT5. A Vantagem Principal: Otimização 3D em Memória Personaliz
ICT PO3 (Power of 3) AMD Protocol Framework Indicator True Time & Structure Integration   |  Non-Repainting | Real-Time  | Multi-Asset  | MT4 Version Available Full Setup Guide & Strategy Playbook: https://www.mql5.com/en/blogs/post/768683 MT4 Version: https://www.mql5.com/en/market/product/171742 Indicator Overview The ICT PO3 AMD Protocol Framework is a complete structural overlay for MetaTrader 5 that maps the True Daily Cycle directly onto your lower-timeframe execution chart. It projects
PZ Trend Trading MT5
PZ TRADING SLU
3.8 (5)
O Trend Trading é um indicador projetado para lucrar o máximo possível com as tendências que ocorrem no mercado, cronometrando retrocessos e rupturas. Ele encontra oportunidades de negociação analisando o que o preço está fazendo durante as tendências estabelecidas. [ Guia de instalação | Guia de atualização | Solução de problemas | FAQ | Todos os produtos ] Negocie mercados financeiros com confiança e eficiência Lucre com as tendências estabelecidas sem ser chicoteado Reconhecer retrocessos
Mais do autor
TK Rainbow
Nguyen Trung Khiem
5 (1)
Indicador TK - Rainbow Descrição: O indicador TK - Rainbow é uma ferramenta robusta para análise técnica, projetada para fornecer uma visão clara das tendências de mercado por meio de uma abordagem com várias linhas. Com 30 linhas calculadas em diferentes períodos, oferece uma análise extensa dos movimentos de preços. O indicador utiliza um esquema de duas cores para destacar tendências de alta e baixa, facilitando a interpretação das condições do mercado de relance. Principais Características:
FREE
Resumo O Indicador de ATR Multinível e Bandas de Média Móvel é uma ferramenta poderosa projetada para ajudar os traders a identificar tendências de mercado, níveis de suporte e resistência, e volatilidade. O indicador combina múltiplas médias móveis com um multiplicador de ATR (Amplitude Média Verdadeira) para criar um gráfico de bandas visual ao redor da flutuação dos preços. Ajuda os traders a detectar possíveis áreas de reversão, condições de tendência e zonas de consolidação do mercado. Cara
FREE
TSageHuz Gold
Nguyen Trung Khiem
Important Note: “This EA is designed for Gold as our testing focused primarily on Gold. You may use it on other forex symbols, but you will need to find suitable settings for them. It may not work effectively on indices or other commodities.” No Expert Advisor (EA) can guarantee consistent long-term profits. However, "tSageHuz v10 - Scalper Trading EA for Gold" has been rigorously backtested from January 1, 2024, to October 31, 2024, showing consistent profitability. Starting with a $100 balance
Description : The "MVRV by Age Approximation" indicator offers traders a unique on-chart visualization of the Market Value to Realized Value (MVRV) ratio, segmented by holding periods, or "age cohorts." This indicator is designed to approximate the MVRV metric by categorizing assets into short-term, mid-term, and long-term holders, providing a clear view of the relative unrealized profit or loss across different holding periods. Using simple moving averages over adjustable periods, this indicato
MACD Gold Slow Scalper Description: "MACD Gold Slow Scalper" is an automated trading system designed for the MetaTrader platform, leveraging the proven effectiveness of the Moving Average Convergence Divergence (MACD) indicator. This Expert Advisor specializes in trading gold (XAU/USD), aiming for stable and slow scalping trades based on MACD signals. Trading Strategy: The "MACD Gold Slow Scalper" operates by analyzing fast and slow EMA crossovers within the MACD indicator to identify potential
Filtro:
Sem comentários
Responder ao comentário